IoT Processor Market
Explore FMI’s in-depth coverage on the IoT Processor Market to gain Exhaustive Analyses of Key Segments
IoT Processor Market by Type, Application & Region- Forecast 2022 – 2032
IoT Processor Market Outlook (2022-2032)
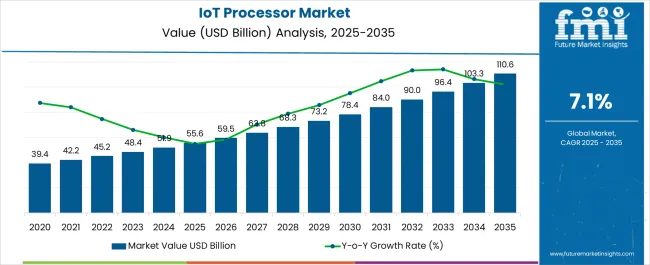
[299 Pages Report] The global IoT Processor market size reached a valuation of US$ 45,420 Million in 2022. The technology is anticipated to create revenue streams, increase business efficiencies, enable new business models, and improve the way existing services are delivered across a wide range of industries to drive the IoT processor market.
The overall sales of IoT Processors are projected to grow at a robust CAGR of 7.4% between 2022 and 2032, totaling around US$ 92,925.7 Million by the end of 2032.
Data Points |
Key Statistics |
IoT Processor Market Size (2022) |
US$ 45,420 Million |
IoT Processor Market Revenue Forecast (2032) |
US$ 92,925.7 Million |
IoT Processor Market Growth Rate (2022-2032) |
7.4% CAGR |
North America Market Share |
40.1% |
The internet of things (IoT) is powering every aspect of human life in this digital world. Every day, massive amounts of data are obtained by these connected devices. For these connected devices to operate effectively, they must transfer data and information in real-time to overcome human issues.
IoT also refers to more data, more sensors, faster responses, end-to-end communication, and smarter user interfaces. All of these characteristics, such as a high-performance sensor, more silicon area, more power, and more heat, come at a cost. While general-purpose processors are ideal for running applications on embedded systems, they are not proficient in dedicated tasks like those required for IoT applications. A low-power processor that can host various applications from multiple connected devices in real time is known as an IoT processor.
Let us know your requirement to get
100% FREE customization
Which Factors are driving the Growth of the IoT Processor Market?
As more devices become associated daily, carrier suppliers are finding it challenging to collect, process, and dispatch data from one device to another due to general-purpose sensor conformance limitations. This leads to a distinct necessity for IoT processors. For example, IoT processors in wearable devices control sense, process, store, and interpret data while ingesting very little power.
This would not have been possible if wearable device distributors such as Apple Inc. and Xiaomi used general-purpose processors in their equipment. Furthermore, technological developments in cognitive and affective computing are accelerating the expansion of the IoT Processor market.
Which Factors are restraining the Growth of the IoT Processor Market?
Despite the substantial opportunities offered by the IoT market for processor industry players, some processor manufacturers have been hesitant to make significant investments in this sector.
The primary issue is that IoT products tend to appeal to a niche market and generate remarkably low sales volume. However, more semiconductor companies will make investments in the IoT processor market in the coming years.
Find your sweet spots for generating winning opportunities in this market.
Talk to AnalystHow Will Growth Unfold in the North America IoT Processor Market?
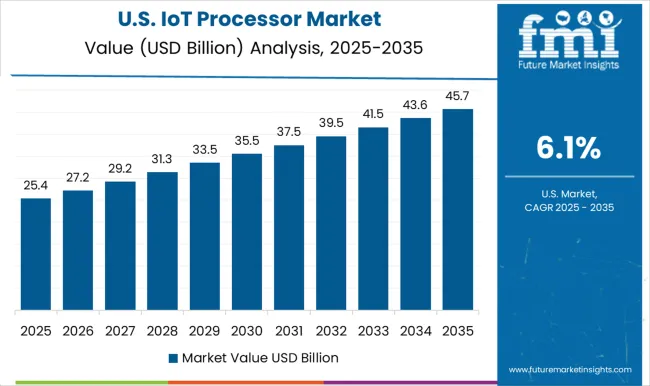
North America is anticipated to be the world's largest market for IoT processors. The vast bulk of IoT processor vendors, such as Intel and Texas Instruments, are headquartered in America, and they are additionally investing in the local market's IoT ecosystem. For example, BMW Group, Intel, and Mobileye collaborated on autonomous driving. North America has a 40.1% market share of the global IoT processor market.
Furthermore, due to the proliferation of cloud platforms and rising R&D investments, the internet of things processors market is witnessing widespread adoption in the region. According to GSMA intelligence's October 2021 report in North America, the overall number of IoT connections is expected to reach 5.1 billion by 2025. In 2020, the total number of connected devices in the province will be 2.9 billion.
Which Factors are pushing the IoT Processor Sales in the Asia Pacific?
Because nations such as China and Taiwan have a massive pool of semiconductor manufacturers, the Asia-Pacific region is predicted to have a moderate growth rate for the IoT Processor market.
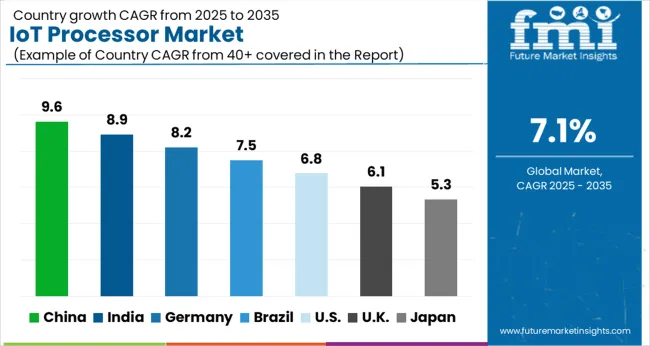
Additionally, due to the increasing projects for smart cities and rising approaches, such as Smart Wellington (New Zealand), Intelligent Disease Prediction Project (China), and cloud spending in the region, Asia Pacific is expected to exhibit the highest CAGR during the forecast years.
A unified Market Research Subscription Platform, built for today's disparate research needs.
How Will Growth Unfold in the European IoT Processor Market?
Europe is expected to lead the global, surpassing North America in terms of market share. Because healthcare is expected to compensate for a sizable market share in Europe, the sector is becoming inherently tied to large databases. Diagnostic analytics, descriptive analytics, prescriptive modeling, and actionable insights can all be provided by IoT technology in combination with big data analytics.
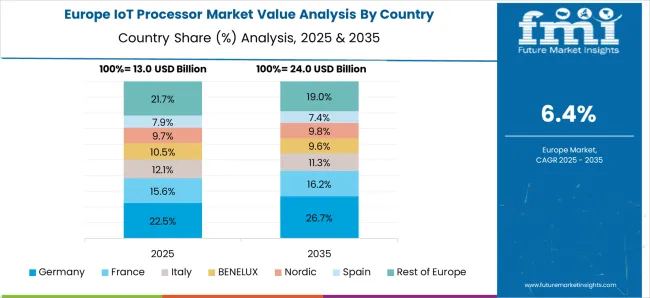
In Europe, network adapters combined with big data are expected to gain traction. Furthermore, due to the region's growing demand for IIoT technology, Germany, the United Kingdom, France, Italy, Spain, and the Netherlands are driving the region's adoption of this market. Similarly, sophisticated technology is being adopted at a rapid pace in Eastern Europe and Nordic countries. Europe is accounting for a market share of 23.6% of the global IoT processor market.
Category-wise Analysis
Which Segments Dominate the Global IoT Processor Market?
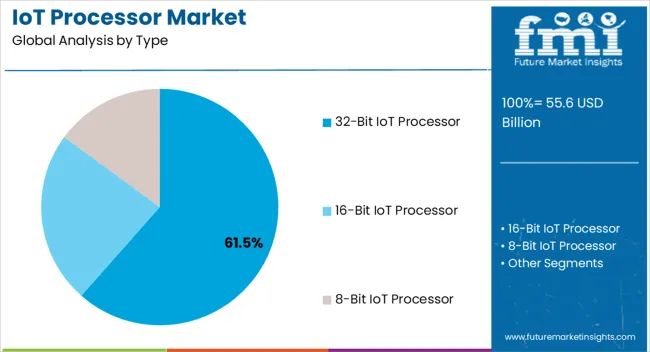
The 8-bit IoT Processor has a lot so much architectural variation. It is a widely used, well-understood 8-bit architecture that remains prevalent among embedded developers. As a result, the 8-bit IoT Processor segment is expected to grow significantly.
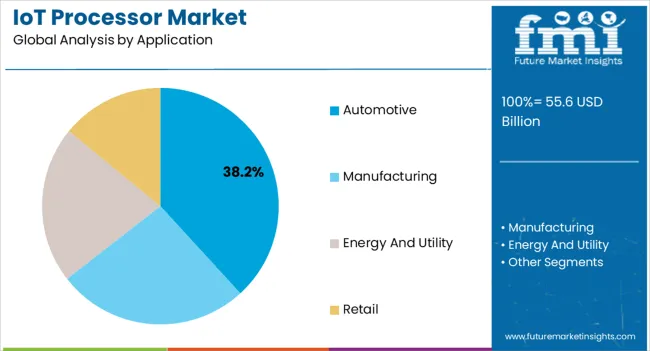
With connectivity and smart devices becoming the mainstream in automobiles, automakers are upgrading their offerings with a suite of technologies such as the Internet of Things (IoT). According to BI Intelligence, connected cars will develop $8.1 trillion between 2015 and 2020. According to these figures, IoT and related digitalization advancements will induce a fundamental transformation in the world of mobility. As a result, the automotive segment is expected to expand faster.
The Start-Up Ecosystem: How key Players are opening Frontiers for Future Growth?
Manufacturers are adopting various marketing strategies such as new product launches, geographical expansion, mergers and acquisitions, partnerships, and collaboration to identify the interest of potential buyers and create a larger customer base. For instance,
- Samsara Inc. is an American Internet of Things company based in San Francisco, California. It was established in 2015. Samsara offers an Industrial IoT platform as a service (PaaS), application infrastructure and middleware, predictive analysis and modeling, functional applications, networks and interconnection, and sensor technologies.
- Benjamin Forgan and Patrick Wilbur founded Hologram in 2014. Hologram's Internet of Things platform can connect devices with healthcare professionals to enable private cellular data transmission and remote monitoring of patients.
Who are the Leading Players in IoT Processor Market?
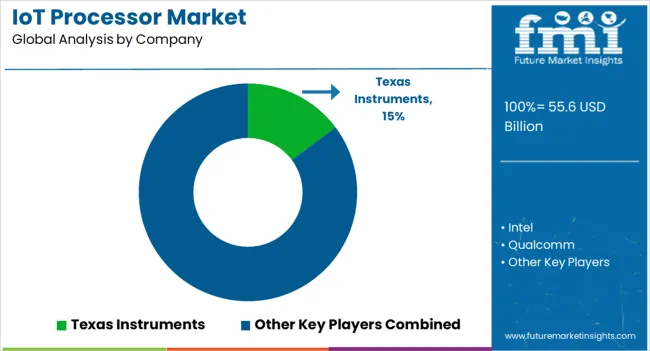
Some of the leading IoT processor manufacturers include Intel Corporation, QUALCOMM, Samsung, Lenovo, and ARM. These key IoT Processor providers are adopting various strategies such as new product launches and approvals, partnerships, collaborations, acquisitions, mergers, etc. to increase their sales and gain a competitive edge in the global IoT Processor market. For instance,
- The Qualcomm® QCS6125 SoC for IoT, which was launched in March 2022, is optimized for retail IoT solutions to facilitate payment applications ranging from secure-rich POS systems to touchless and biometric payment processors.
- Lenovo launched a suite of ThinkIoT Smarter Store Solutions in October 2020 to help retailers enhance productivity and store safety.
- In January 2022, Samsung introduced the Exynos I T100, a new Internet of Things (IoT) solution that improves the security and reliability of devices built for short-range communications.
- Latest IoT-focused 12th Gen Intel Core processors, which were launched in January 2022, offer greater core count and effectiveness to customers in retail, manufacturing, healthcare, and digital safety.
Report Scope
Attribute |
Details |
Market Size Value in 2022 |
US$ 45,420 Million |
Market Forecast Value in 2032 |
US$ 92,925.7 Million |
Global Growth Rate |
7.4% CAGR |
Forecast Period |
2022-2032 |
Historical Data Available for |
2016-2021 |
Market Analysis |
US$ Million for Value |
Key Regions Covered |
|
Key Countries Covered |
|
Key Market Segments Covered |
|
Key Companies Profiled |
|
Pricing |
Available upon Request |
Key Segments of IoT Processor Industry Survey
By Type:
- 8 bit IoT Processor
- 16 bit IoT Processor
- 32 bit IoT Processor
By Application:
- Automotive
- Manufacturing
- Energy and Utility
- Retail
By Region:
- North America IoT Processor Market
- Latin America IoT Processor Market
- Europe IoT Processor Market
- East Asia IoT Processor Market
- South Asia IoT Processor Market
- Oceania IoT Processor Market
- Middle East & Africa IoT Processor Market
Frequently Asked Questions
What is the current valuation of the IoT processor market?
The global IoT processor market reached US$ 45,420 Million in 2022
What is the anticipated growth rate for IoT processors during the projected period?
As per FMI, the IoT processor industry is expected to grow at a CAGR of 7.4% from 2022-2032
What is the projected valuation for the IoT processor market by 2032?
The global sales of IoT processors are anticipated to total a valuation of US$ 92,925.7 Million by 2032
Who are the prominent IoT Processor providers?
Some of the leading manufacturers include Intel Corporation, QUALCOMM, Samsung, Lenovo and ARM among others
Table of Content
1. Executive Summary 1.1. Global Market Outlook 1.2. Demand-side Trends 1.3. Supply-side Trends 1.4. Technology Roadmap Analysis 1.5. Analysis and Recommendations 2. Market Overview 2.1. Market Coverage / Taxonomy 2.2. Market Definition / Scope / Limitations 3. Market Background 3.1. Market Dynamics 3.1.1. Drivers 3.1.2. Restraints 3.1.3. Opportunity 3.1.4. Trends 3.2. Scenario Forecast 3.2.1. Demand in Optimistic Scenario 3.2.2. Demand in Likely Scenario 3.2.3. Demand in Conservative Scenario 3.3. Opportunity Map Analysis 3.4. Investment Feasibility Matrix 3.5. PESTLE and Porter’s Analysis 3.6. Regulatory Landscape 3.6.1. By Key Regions 3.6.2. By Key Countries 3.7. Regional Parent Market Outlook 4. Global Market Analysis 2016-2021 and Forecast, 2022-2032 4.1. Historical Market Size Value (US$ Mn) Analysis, 2016-2021 4.2. Current and Future Market Size Value (US$ Mn) Projections, 2022-2032 4.2.1. Y-o-Y Growth Trend Analysis 4.2.2. Absolute $ Opportunity Analysis 5. Global Market Analysis 2016-2021 and Forecast 2022-2032, By Type 5.1. Introduction / Key Findings 5.2. Historical Market Size Value (US$ Mn) Analysis By Type, 2016-2021 5.3. Current and Future Market Size Value (US$ Mn) Analysis and Forecast By Type, 2022-2032 5.3.1. 8bit 5.3.2. 16bit 5.3.3. 32bit 5.4. Y-o-Y Growth Trend Analysis By Type, 2016-2021 5.5. Absolute $ Opportunity Analysis By Type, 2022-2032 6. Global Market Analysis 2016-2021 and Forecast 2022-2032, By Application 6.1. Introduction / Key Findings 6.2. Historical Market Size Value (US$ Mn) Analysis By Application, 2016-2021 6.3. Current and Future Market Size Value (US$ Mn) Analysis and Forecast By Application, 2022-2032 6.3.1. Automotive 6.3.2. Manufacturing 6.3.3. Energy and utility 6.3.4. Retail 6.4. Y-o-Y Growth Trend Analysis By Application, 2016-2021 6.5. Absolute $ Opportunity Analysis By Application, 2022-2032 7. Global Market Analysis 2016-2021 and Forecast 2022-2032, By Region 7.1. Introduction 7.2. Historical Market Size Value (US$ Mn) Analysis By Region, 2016-2021 7.3. Current Market Size Value (US$ Mn) Analysis and Forecast By Region, 2022-2032 7.3.1. North America 7.3.2. Latin America 7.3.3. Europe 7.3.4. South Asia 7.3.5. East Asia 7.3.6. Oceania 7.3.7. MEA 7.4. Market Attractiveness Analysis By Region 8. North America Market Analysis 2016-2021 and Forecast 2022-2032, By Country 8.1. Historical Market Size Value (US$ Mn) Trend Analysis By Market Taxonomy, 2016-2021 8.2. Market Size Value (US$ Mn) Forecast By Market Taxonomy, 2022-2032 8.2.1. By Country 8.2.1.1. U.S. 8.2.1.2. Canada 8.2.2. By Type 8.2.3. By Application 8.3. Market Attractiveness Analysis 8.3.1. By Country 8.3.2. By Type 8.3.3. By Application 8.4. Key Takeaways 9. Latin America Market Analysis 2016-2021 and Forecast 2022-2032, By Country 9.1. Historical Market Size Value (US$ Mn) Trend Analysis By Market Taxonomy, 2016-2021 9.2. Market Size Value (US$ Mn) Forecast By Market Taxonomy, 2022-2032 9.2.1. By Country 9.2.1.1. Brazil 9.2.1.2. Mexico 9.2.1.3. Rest of Latin America 9.2.2. By Type 9.2.3. By Application 9.3. Market Attractiveness Analysis 9.3.1. By Country 9.3.2. By Type 9.3.3. By Application 9.4. Key Takeaways 10. Europe Market Analysis 2016-2021 and Forecast 2022-2032, By Country 10.1. Historical Market Size Value (US$ Mn) Trend Analysis By Market Taxonomy, 2016-2021 10.2. Market Size Value (US$ Mn) Forecast By Market Taxonomy, 2022-2032 10.2.1. By Country 10.2.1.1. Germany 10.2.1.2. U.K. 10.2.1.3. France 10.2.1.4. Spain 10.2.1.5. Italy 10.2.1.6. Rest of Europe 10.2.2. By Type 10.2.3. By Application 10.3. Market Attractiveness Analysis 10.3.1. By Country 10.3.2. By Type 10.3.3. By Application 10.4. Key Takeaways 11. South Asia Market Analysis 2016-2021 and Forecast 2022-2032, By Country 11.1. Historical Market Size Value (US$ Mn) Trend Analysis By Market Taxonomy, 2016-2021 11.2. Market Size Value (US$ Mn) Forecast By Market Taxonomy, 2022-2032 11.2.1. By Country 11.2.1.1. India 11.2.1.2. Malaysia 11.2.1.3. Singapore 11.2.1.4. Thailand 11.2.1.5. Rest of South Asia 11.2.2. By Type 11.2.3. By Application 11.3. Market Attractiveness Analysis 11.3.1. By Country 11.3.2. By Type 11.3.3. By Application 11.4. Key Takeaways 12. East Asia Market Analysis 2016-2021 and Forecast 2022-2032, By Country 12.1. Historical Market Size Value (US$ Mn) Trend Analysis By Market Taxonomy, 2016-2021 12.2. Market Size Value (US$ Mn) Forecast By Market Taxonomy, 2022-2032 12.2.1. By Country 12.2.1.1. China 12.2.1.2. Japan 12.2.1.3. South Korea 12.2.2. By Type 12.2.3. By Application 12.3. Market Attractiveness Analysis 12.3.1. By Country 12.3.2. By Type 12.3.3. By Application 12.4. Key Takeaways 13. Oceania Market Analysis 2016-2021 and Forecast 2022-2032, By Country 13.1. Historical Market Size Value (US$ Mn) Trend Analysis By Market Taxonomy, 2016-2021 13.2. Market Size Value (US$ Mn) Forecast By Market Taxonomy, 2022-2032 13.2.1. By Country 13.2.1.1. Australia 13.2.1.2. New Zealand 13.2.2. By Type 13.2.3. By Application 13.3. Market Attractiveness Analysis 13.3.1. By Country 13.3.2. By Type 13.3.3. By Application 13.4. Key Takeaways 14. MEA Market Analysis 2016-2021 and Forecast 2022-2032, By Country 14.1. Historical Market Size Value (US$ Mn) Trend Analysis By Market Taxonomy, 2016-2021 14.2. Market Size Value (US$ Mn) Forecast By Market Taxonomy, 2022-2032 14.2.1. By Country 14.2.1.1. GCC Countries 14.2.1.2. South Africa 14.2.1.3. Israel 14.2.1.4. Rest of MEA 14.2.2. By Type 14.2.3. By Application 14.3. Market Attractiveness Analysis 14.3.1. By Country 14.3.2. By Type 14.3.3. By Application 14.4. Key Takeaways 15. Key Countries Market Analysis 15.1. U.S. 15.1.1. Pricing Analysis 15.1.2. Market Share Analysis, 2021 15.1.2.1. By Type 15.1.2.2. By Application 15.2. Canada 15.2.1. Pricing Analysis 15.2.2. Market Share Analysis, 2021 15.2.2.1. By Type 15.2.2.2. By Application 15.3. Brazil 15.3.1. Pricing Analysis 15.3.2. Market Share Analysis, 2021 15.3.2.1. By Type 15.3.2.2. By Application 15.4. Mexico 15.4.1. Pricing Analysis 15.4.2. Market Share Analysis, 2021 15.4.2.1. By Type 15.4.2.2. By Application 15.5. Germany 15.5.1. Pricing Analysis 15.5.2. Market Share Analysis, 2021 15.5.2.1. By Type 15.5.2.2. By Application 15.6. U.K. 15.6.1. Pricing Analysis 15.6.2. Market Share Analysis, 2021 15.6.2.1. By Type 15.6.2.2. By Application 15.7. France 15.7.1. Pricing Analysis 15.7.2. Market Share Analysis, 2021 15.7.2.1. By Type 15.7.2.2. By Application 15.8. Spain 15.8.1. Pricing Analysis 15.8.2. Market Share Analysis, 2021 15.8.2.1. By Type 15.8.2.2. By Application 15.9. Italy 15.9.1. Pricing Analysis 15.9.2. Market Share Analysis, 2021 15.9.2.1. By Type 15.9.2.2. By Application 15.10. India 15.10.1. Pricing Analysis 15.10.2. Market Share Analysis, 2021 15.10.2.1. By Type 15.10.2.2. By Application 15.11. Malaysia 15.11.1. Pricing Analysis 15.11.2. Market Share Analysis, 2021 15.11.2.1. By Type 15.11.2.2. By Application 15.12. Singapore 15.12.1. Pricing Analysis 15.12.2. Market Share Analysis, 2021 15.12.2.1. By Type 15.12.2.2. By Application 15.13. Thailand 15.13.1. Pricing Analysis 15.13.2. Market Share Analysis, 2021 15.13.2.1. By Type 15.13.2.2. By Application 15.14. China 15.14.1. Pricing Analysis 15.14.2. Market Share Analysis, 2021 15.14.2.1. By Type 15.14.2.2. By Application 15.15. Japan 15.15.1. Pricing Analysis 15.15.2. Market Share Analysis, 2021 15.15.2.1. By Type 15.15.2.2. By Application 15.16. South Korea 15.16.1. Pricing Analysis 15.16.2. Market Share Analysis, 2021 15.16.2.1. By Type 15.16.2.2. By Application 15.17. Australia 15.17.1. Pricing Analysis 15.17.2. Market Share Analysis, 2021 15.17.2.1. By Type 15.17.2.2. By Application 15.18. New Zealand 15.18.1. Pricing Analysis 15.18.2. Market Share Analysis, 2021 15.18.2.1. By Type 15.18.2.2. By Application 15.19. GCC Countries 15.19.1. Pricing Analysis 15.19.2. Market Share Analysis, 2021 15.19.2.1. By Type 15.19.2.2. By Application 15.20. South Africa 15.20.1. Pricing Analysis 15.20.2. Market Share Analysis, 2021 15.20.2.1. By Type 15.20.2.2. By Application 15.21. Israel 15.21.1. Pricing Analysis 15.21.2. Market Share Analysis, 2021 15.21.2.1. By Type 15.21.2.2. By Application 16. Market Structure Analysis 16.1. Competition Dashboard 16.2. Competition Benchmarking 16.3. Market Share Analysis of Top Players 16.3.1. By Regional 16.3.2. By Type 16.3.3. By Application 17. Competition Analysis 17.1. Competition Deep Dive 17.1.1. Texas Instruments 17.1.1.1. Overview 17.1.1.2. Product Portfolio 17.1.1.3. Profitability by Market Segments 17.1.1.4. Sales Footprint 17.1.1.5. Strategy Overview 17.1.1.5.1. Marketing Strategy 17.1.2. Intel 17.1.2.1. Overview 17.1.2.2. Product Portfolio 17.1.2.3. Profitability by Market Segments 17.1.2.4. Sales Footprint 17.1.2.5. Strategy Overview 17.1.2.5.1. Marketing Strategy 17.1.3. Qualcomm 17.1.3.1. Overview 17.1.3.2. Product Portfolio 17.1.3.3. Profitability by Market Segments 17.1.3.4. Sales Footprint 17.1.3.5. Strategy Overview 17.1.3.5.1. Marketing Strategy 17.1.4. ARM 17.1.4.1. Overview 17.1.4.2. Product Portfolio 17.1.4.3. Profitability by Market Segments 17.1.4.4. Sales Footprint 17.1.4.5. Strategy Overview 17.1.4.5.1. Marketing Strategy 17.1.5. Atmel 17.1.5.1. Overview 17.1.5.2. Product Portfolio 17.1.5.3. Profitability by Market Segments 17.1.5.4. Sales Footprint 17.1.5.5. Strategy Overview 17.1.5.5.1. Marketing Strategy 17.1.6. Freescale 17.1.6.1. Overview 17.1.6.2. Product Portfolio 17.1.6.3. Profitability by Market Segments 17.1.6.4. Sales Footprint 17.1.6.5. Strategy Overview 17.1.6.5.1. Marketing Strategy 17.1.7. Amulet Technologies 17.1.7.1. Overview 17.1.7.2. Product Portfolio 17.1.7.3. Profitability by Market Segments 17.1.7.4. Sales Footprint 17.1.7.5. Strategy Overview 17.1.7.5.1. Marketing Strategy 17.1.8. Broadcom Inc. 17.1.8.1. Overview 17.1.8.2. Product Portfolio 17.1.8.3. Profitability by Market Segments 17.1.8.4. Sales Footprint 17.1.8.5. Strategy Overview 17.1.8.5.1. Marketing Strategy 17.1.9. 4D Systems 17.1.9.1. Overview 17.1.9.2. Product Portfolio 17.1.9.3. Profitability by Market Segments 17.1.9.4. Sales Footprint 17.1.9.5. Strategy Overview 17.1.9.5.1. Marketing Strategy 17.1.10. Renesas Electronics 17.1.10.1. Overview 17.1.10.2. Product Portfolio 17.1.10.3. Profitability by Market Segments 17.1.10.4. Sales Footprint 17.1.10.5. Strategy Overview 17.1.10.5.1. Marketing Strategy 18. Assumptions & Acronyms Used 19. Research Methodology
Let us know your requirement to get
100% FREE customization
List of Tables
Table 1: Global Market Value (US$ Mn) Forecast by Region, 2016-2032 Table 2: Global Market Value (US$ Mn) Forecast by Type, 2016-2032 Table 3: Global Market Value (US$ Mn) Forecast by Application, 2016-2032 Table 4: North America Market Value (US$ Mn) Forecast by Country, 2016-2032 Table 5: North America Market Value (US$ Mn) Forecast by Type, 2016-2032 Table 6: North America Market Value (US$ Mn) Forecast by Application, 2016-2032 Table 7: Latin America Market Value (US$ Mn) Forecast by Country, 2016-2032 Table 8: Latin America Market Value (US$ Mn) Forecast by Type, 2016-2032 Table 9: Latin America Market Value (US$ Mn) Forecast by Application, 2016-2032 Table 10: Europe Market Value (US$ Mn) Forecast by Country, 2016-2032 Table 11: Europe Market Value (US$ Mn) Forecast by Type, 2016-2032 Table 12: Europe Market Value (US$ Mn) Forecast by Application, 2016-2032 Table 13: South Asia Market Value (US$ Mn) Forecast by Country, 2016-2032 Table 14: South Asia Market Value (US$ Mn) Forecast by Type, 2016-2032 Table 15: South Asia Market Value (US$ Mn) Forecast by Application, 2016-2032 Table 16: East Asia Market Value (US$ Mn) Forecast by Country, 2016-2032 Table 17: East Asia Market Value (US$ Mn) Forecast by Type, 2016-2032 Table 18: East Asia Market Value (US$ Mn) Forecast by Application, 2016-2032 Table 19: Oceania Market Value (US$ Mn) Forecast by Country, 2016-2032 Table 20: Oceania Market Value (US$ Mn) Forecast by Type, 2016-2032 Table 21: Oceania Market Value (US$ Mn) Forecast by Application, 2016-2032 Table 22: MEA Market Value (US$ Mn) Forecast by Country, 2016-2032 Table 23: MEA Market Value (US$ Mn) Forecast by Type, 2016-2032 Table 24: MEA Market Value (US$ Mn) Forecast by Application, 2016-2032
Find your sweet spots for generating winning opportunities in this market.
Talk to AnalystList of Charts
Figure 1: Global Market Value (US$ Mn) by Type, 2022-2032 Figure 2: Global Market Value (US$ Mn) by Application, 2022-2032 Figure 3: Global Market Value (US$ Mn) by Region, 2022-2032 Figure 4: Global Market Value (US$ Mn) Analysis by Region, 2016-2032 Figure 5: Global Market Value Share (%) and BPS Analysis by Region, 2022-2032 Figure 6: Global Market Y-o-Y Growth (%) Projections by Region, 2022-2032 Figure 7: Global Market Value (US$ Mn) Analysis by Type, 2016-2032 Figure 8: Global Market Value Share (%) and BPS Analysis by Type, 2022-2032 Figure 9: Global Market Y-o-Y Growth (%) Projections by Type, 2022-2032 Figure 10: Global Market Value (US$ Mn) Analysis by Application, 2016-2032 Figure 11: Global Market Value Share (%) and BPS Analysis by Application, 2022-2032 Figure 12: Global Market Y-o-Y Growth (%) Projections by Application, 2022-2032 Figure 13: Global Market Attractiveness by Type, 2022-2032 Figure 14: Global Market Attractiveness by Application, 2022-2032 Figure 15: Global Market Attractiveness by Region, 2022-2032 Figure 16: North America Market Value (US$ Mn) by Type, 2022-2032 Figure 17: North America Market Value (US$ Mn) by Application, 2022-2032 Figure 18: North America Market Value (US$ Mn) by Country, 2022-2032 Figure 19: North America Market Value (US$ Mn) Analysis by Country, 2016-2032 Figure 20: North America Market Value Share (%) and BPS Analysis by Country, 2022-2032 Figure 21: North America Market Y-o-Y Growth (%) Projections by Country, 2022-2032 Figure 22: North America Market Value (US$ Mn) Analysis by Type, 2016-2032 Figure 23: North America Market Value Share (%) and BPS Analysis by Type, 2022-2032 Figure 24: North America Market Y-o-Y Growth (%) Projections by Type, 2022-2032 Figure 25: North America Market Value (US$ Mn) Analysis by Application, 2016-2032 Figure 26: North America Market Value Share (%) and BPS Analysis by Application, 2022-2032 Figure 27: North America Market Y-o-Y Growth (%) Projections by Application, 2022-2032 Figure 28: North America Market Attractiveness by Type, 2022-2032 Figure 29: North America Market Attractiveness by Application, 2022-2032 Figure 30: North America Market Attractiveness by Country, 2022-2032 Figure 31: Latin America Market Value (US$ Mn) by Type, 2022-2032 Figure 32: Latin America Market Value (US$ Mn) by Application, 2022-2032 Figure 33: Latin America Market Value (US$ Mn) by Country, 2022-2032 Figure 34: Latin America Market Value (US$ Mn) Analysis by Country, 2016-2032 Figure 35: Latin America Market Value Share (%) and BPS Analysis by Country, 2022-2032 Figure 36: Latin America Market Y-o-Y Growth (%) Projections by Country, 2022-2032 Figure 37: Latin America Market Value (US$ Mn) Analysis by Type, 2016-2032 Figure 38: Latin America Market Value Share (%) and BPS Analysis by Type, 2022-2032 Figure 39: Latin America Market Y-o-Y Growth (%) Projections by Type, 2022-2032 Figure 40: Latin America Market Value (US$ Mn) Analysis by Application, 2016-2032 Figure 41: Latin America Market Value Share (%) and BPS Analysis by Application, 2022-2032 Figure 42: Latin America Market Y-o-Y Growth (%) Projections by Application, 2022-2032 Figure 43: Latin America Market Attractiveness by Type, 2022-2032 Figure 44: Latin America Market Attractiveness by Application, 2022-2032 Figure 45: Latin America Market Attractiveness by Country, 2022-2032 Figure 46: Europe Market Value (US$ Mn) by Type, 2022-2032 Figure 47: Europe Market Value (US$ Mn) by Application, 2022-2032 Figure 48: Europe Market Value (US$ Mn) by Country, 2022-2032 Figure 49: Europe Market Value (US$ Mn) Analysis by Country, 2016-2032 Figure 50: Europe Market Value Share (%) and BPS Analysis by Country, 2022-2032 Figure 51: Europe Market Y-o-Y Growth (%) Projections by Country, 2022-2032 Figure 52: Europe Market Value (US$ Mn) Analysis by Type, 2016-2032 Figure 53: Europe Market Value Share (%) and BPS Analysis by Type, 2022-2032 Figure 54: Europe Market Y-o-Y Growth (%) Projections by Type, 2022-2032 Figure 55: Europe Market Value (US$ Mn) Analysis by Application, 2016-2032 Figure 56: Europe Market Value Share (%) and BPS Analysis by Application, 2022-2032 Figure 57: Europe Market Y-o-Y Growth (%) Projections by Application, 2022-2032 Figure 58: Europe Market Attractiveness by Type, 2022-2032 Figure 59: Europe Market Attractiveness by Application, 2022-2032 Figure 60: Europe Market Attractiveness by Country, 2022-2032 Figure 61: South Asia Market Value (US$ Mn) by Type, 2022-2032 Figure 62: South Asia Market Value (US$ Mn) by Application, 2022-2032 Figure 63: South Asia Market Value (US$ Mn) by Country, 2022-2032 Figure 64: South Asia Market Value (US$ Mn) Analysis by Country, 2016-2032 Figure 65: South Asia Market Value Share (%) and BPS Analysis by Country, 2022-2032 Figure 66: South Asia Market Y-o-Y Growth (%) Projections by Country, 2022-2032 Figure 67: South Asia Market Value (US$ Mn) Analysis by Type, 2016-2032 Figure 68: South Asia Market Value Share (%) and BPS Analysis by Type, 2022-2032 Figure 69: South Asia Market Y-o-Y Growth (%) Projections by Type, 2022-2032 Figure 70: South Asia Market Value (US$ Mn) Analysis by Application, 2016-2032 Figure 71: South Asia Market Value Share (%) and BPS Analysis by Application, 2022-2032 Figure 72: South Asia Market Y-o-Y Growth (%) Projections by Application, 2022-2032 Figure 73: South Asia Market Attractiveness by Type, 2022-2032 Figure 74: South Asia Market Attractiveness by Application, 2022-2032 Figure 75: South Asia Market Attractiveness by Country, 2022-2032 Figure 76: East Asia Market Value (US$ Mn) by Type, 2022-2032 Figure 77: East Asia Market Value (US$ Mn) by Application, 2022-2032 Figure 78: East Asia Market Value (US$ Mn) by Country, 2022-2032 Figure 79: East Asia Market Value (US$ Mn) Analysis by Country, 2016-2032 Figure 80: East Asia Market Value Share (%) and BPS Analysis by Country, 2022-2032 Figure 81: East Asia Market Y-o-Y Growth (%) Projections by Country, 2022-2032 Figure 82: East Asia Market Value (US$ Mn) Analysis by Type, 2016-2032 Figure 83: East Asia Market Value Share (%) and BPS Analysis by Type, 2022-2032 Figure 84: East Asia Market Y-o-Y Growth (%) Projections by Type, 2022-2032 Figure 85: East Asia Market Value (US$ Mn) Analysis by Application, 2016-2032 Figure 86: East Asia Market Value Share (%) and BPS Analysis by Application, 2022-2032 Figure 87: East Asia Market Y-o-Y Growth (%) Projections by Application, 2022-2032 Figure 88: East Asia Market Attractiveness by Type, 2022-2032 Figure 89: East Asia Market Attractiveness by Application, 2022-2032 Figure 90: East Asia Market Attractiveness by Country, 2022-2032 Figure 91: Oceania Market Value (US$ Mn) by Type, 2022-2032 Figure 92: Oceania Market Value (US$ Mn) by Application, 2022-2032 Figure 93: Oceania Market Value (US$ Mn) by Country, 2022-2032 Figure 94: Oceania Market Value (US$ Mn) Analysis by Country, 2016-2032 Figure 95: Oceania Market Value Share (%) and BPS Analysis by Country, 2022-2032 Figure 96: Oceania Market Y-o-Y Growth (%) Projections by Country, 2022-2032 Figure 97: Oceania Market Value (US$ Mn) Analysis by Type, 2016-2032 Figure 98: Oceania Market Value Share (%) and BPS Analysis by Type, 2022-2032 Figure 99: Oceania Market Y-o-Y Growth (%) Projections by Type, 2022-2032 Figure 100: Oceania Market Value (US$ Mn) Analysis by Application, 2016-2032 Figure 101: Oceania Market Value Share (%) and BPS Analysis by Application, 2022-2032 Figure 102: Oceania Market Y-o-Y Growth (%) Projections by Application, 2022-2032 Figure 103: Oceania Market Attractiveness by Type, 2022-2032 Figure 104: Oceania Market Attractiveness by Application, 2022-2032 Figure 105: Oceania Market Attractiveness by Country, 2022-2032 Figure 106: MEA Market Value (US$ Mn) by Type, 2022-2032 Figure 107: MEA Market Value (US$ Mn) by Application, 2022-2032 Figure 108: MEA Market Value (US$ Mn) by Country, 2022-2032 Figure 109: MEA Market Value (US$ Mn) Analysis by Country, 2016-2032 Figure 110: MEA Market Value Share (%) and BPS Analysis by Country, 2022-2032 Figure 111: MEA Market Y-o-Y Growth (%) Projections by Country, 2022-2032 Figure 112: MEA Market Value (US$ Mn) Analysis by Type, 2016-2032 Figure 113: MEA Market Value Share (%) and BPS Analysis by Type, 2022-2032 Figure 114: MEA Market Y-o-Y Growth (%) Projections by Type, 2022-2032 Figure 115: MEA Market Value (US$ Mn) Analysis by Application, 2016-2032 Figure 116: MEA Market Value Share (%) and BPS Analysis by Application, 2022-2032 Figure 117: MEA Market Y-o-Y Growth (%) Projections by Application, 2022-2032 Figure 118: MEA Market Attractiveness by Type, 2022-2032 Figure 119: MEA Market Attractiveness by Application, 2022-2032 Figure 120: MEA Market Attractiveness by Country, 2022-2032
Need specific information?
Request CustomizationExplore Technology Insights
View Reports