IoT For Cold Chain Monitoring Market
Market Insights on IoT For Cold Chain Monitoring covering sales outlook, demand forecast & up-to-date key trends
IoT For Cold Chain Monitoring Market By Component (Hardware, IoT Software/Platform for Cold Chain Monitoring, Services), Enterprise Size (SMEs, Large Enterprises), Industry (Healthcare & Pharma, Retail & CPG, Food & Beverages, Chemicals) & Region - Forecast to 2021 - 2031
About the Report
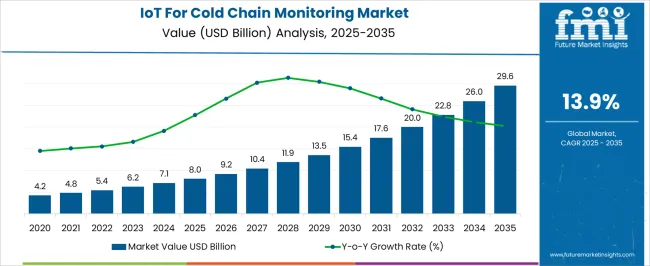
The Internet of Things (IoT) has been transforming the perishable supply chain. The advent of smarter cold chain systems has been providing managers live data about temperature and location besides empowering them with the ability to remotely control logistics. As a result of the increasing demand for real-time and remote surveillance of crucial parameters of shipment, IoT cold chain monitoring has become highly sought-after in the transport of medicines, frozen food, vaccines, and other products. Globally, the IoT for cold chain monitoring market is expected to reach a valuation of 17.8 Bn by 2031.
In its new study, ESOMAR-certified market research and consulting firm Future Market Insights (FMI) offers insights about key factors driving demand for IoT for cold chain monitoring. The report tracks the global sales of IoT for cold chain monitoring in 20+ high-growth markets, along with analyzing the impact COVID-19 has had on the pharma & healthcare, and food & beverages industry in general, and IoT for cold chain monitoring in particular.
Let us know your requirement to get
100% FREE customization
What is the Future Outlook for IoT for Cold Chain Monitoring Market in Comparison to Historical Pattern?
Between 2016 and 2020, global IoT for cold chain monitoring registered the CAGR of 11.0%. Rising government investments and efforts to reduce food spoilage and prevent damage of other temperature sensitive goods have fueled the demand for cold chain monitoring in industries such as food & beverages, healthcare & pharma, chemicals and others.
The rising demand for cold chain warehousing during COVID-19 pandemic had a positive impact on the IoT for cold chain monitoring market. During the extended period of lockdown observed around the world, increasing demand for packaged food & beverages products was noted. Food manufacturers have been increasingly adopting the IoT for cold chain monitoring solutions for monitoring the food products and to boost their shelf-life.
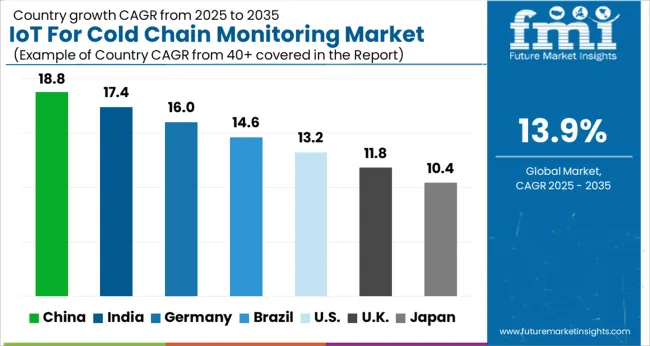
Because IoT-enabled temperature monitoring helps in monitoring goods round the clock, temperature logging has become way easier than manual methods, previously undertaken. This has resulted in increasing demand for data cold chain monitoring during the pandemic. Driven by these factors, the IoT for cold chain monitoring demand is likely to increase, expanding at a CAGR exceeding 13.6% throughout the 2021-2031 assessment period.
How will Blockchain Technology Influence Demand for Cold Chain Monitoring?
Blockchain technology offers a way to record transactions or any digital interaction and is designed to be transparent, secure, and efficient. Blockchain is the digital, distributed transaction ledger that is stored and maintained on multiple systems belonging to multiple entities sharing identical information. The demand for blockchain technology is increasing in cold chain monitoring as it increases the efficiency and transparency of supply chain and positively affects the cold chain processes, from delivery to storage and payment.
Due to transparency and security achieved by blockchain, the speed of physical flow of goods is increased. Blockchain records every single asset from product to containers as it flows through the supply chain nodes. It also helps in keeping track of information regarding orders, receipt, invoice, payments, and digital assets such as copyrights, certifications, barcodes, and other things. Through its decentralized nature, it shares the information about process, delivery, production, maintenance, between suppliers and vendors, bringing new modalities of collaboration in complex assembly lines.
Blockchain integration with cold chain results in increased sustainability, reduced errors and delays, it minimizes transportation cost, enables faster identification of errors, and offers improved product transport and inventory management. Through these advantages, blockchain integration in cold chain can help in strengthening corporate identities of market players.
Find your sweet spots for generating winning opportunities in this market.
Talk to AnalystWhy is Cold Chain Monitoring Moving to Cloud?
The cloud is metaphor for computing, where everything is a service that can connect and combine with other services to meet an infinite number of application needs. Organizations across the world have migrated some or most of their existing on premise applications to a cloud provider’s platform to take better advantage of cloud scalability and modern architectural patterns. Cloud computing is used for managing, storing, and processing data from disparate locations, and over the internet delivers hosted services.
When applications are hosted in the cloud, they are using data center resources from the cloud provider. Most colocation providers are involved in the construction of data centers to collect space to cloud service providers. Cloud computing can offer critical software for business management, reducing cost incurred on maintaining hardware and software effectively
Integrating on premise supply chain management can increase unnecessary burden of expenditures on organizations. On the business side, it might require large upfront cost to build an effective supply chain. Considering intrinsic challenges of building and managing rigid legacy on premise applications, supply chain providers are shifting towards more flexible, modern, and state-of-the-art solutions such as cloud services.
What is the Potential of Logistics 4.0 for IoT for Cold Chain Monitoring?
Logistics 4.0 enables process improvement through a variety of technological advancements, which include automated systems, driverless transport vehicle, and robotics. Increase in adoption of cloud-based technology with usage of logistics 4.0 and IoT is driving growth of the cold chain monitoring market. The IoT usage in cold chain monitoring is increasing as it helps in reducing cost and delays by avoiding risk.
IoT sensors are built into cargo, ships, cabs, and trains and are connected to an alarm system or dispatcher that is tracking and monitoring. These sensors transmit information to the team who then gains insights of hidden risk and knowledge. This also gives accurate in-transit visibility and delivery of goods. The demand for cloud-based software as a service is increasing in cold chain monitoring, as it helps the professional to access critical data and application both, on the road and in the office from any connected device.

An unified Market Research Subscription Platform, built for today’s disparate research needs.
What are Key Threats Posed by IoT for Cold Chain Monitoring?
A huge amount of data is generated in cold chain monitoring, which is analyzed and used for decision making by professionals. The data is collected by using devices such as data logger, various IoT sensors, and GPS devices. The data collected through these devices can be tampered or unauthorized user can access the device for data theft. This may lead to the misuse of important information regarding products, orders by unauthorized users. However, this a major challenge that is restricting growth of the IoT for cold chain monitoring market.
What are Prospects for Cold Chain Companies amid Pandemic?
In COVID-19 pandemic, the cold chain is priority as manufacturers and distributor are looking that how cold chain would be used to successfully deliver a temperature sensitive COVID-19 vaccine. The cold chain companies are highly adopting the cloud storage, blockchain, IoT sensors for monitoring and gaining real time insights for temperature change so that the vaccine is prevented from any kind of damage.
IoT sensors are the most important tools for understanding the temperature changes in vaccine once the vaccine is out of manufacturing facilities. As the COVID-19 vaccines will be distributed across the globe, it is creating opportunities for cold chain companies.
Market Share Analysis of IoT for Cold Chain Monitoring Vendors
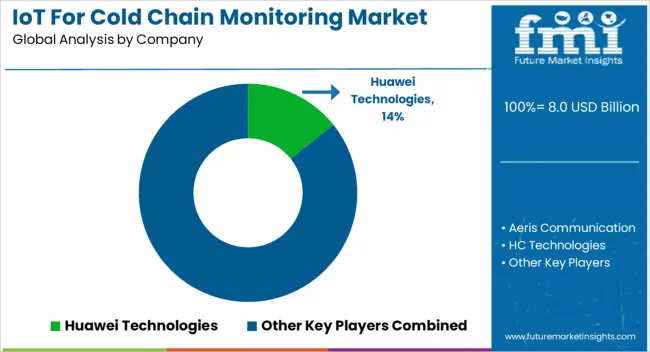
The IoT for cold chain monitoring market is fragmented. The companies that hold market share of 10% to 12% are tier-1 companies and this group includes players such as Huawei Technologies, TE Connectivity.
The companies with market share of above 7% and below 12% are the promising players. These companies are likely to showcase a quick growth trend and harness the opportunities that the global market has to offer to accommodate business expansion and revenue generation. This group includes Zebra Technologies.
Companies that have a relatively lower size with a market share worth less than 7% are strategizing to attract new clientele in foreign markets. The companies in this group are Moschip Technologies Limited, Laird Connectivity, Aeris Communication.
Country-wise Analysis
What are Opportunities for IoT for Cold Chain Monitoring Sales in the U.S.?
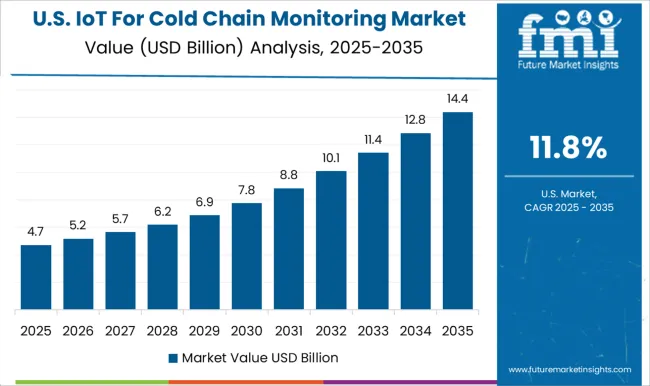
Until 2020, IoT for cold chain monitoring sales across the United States experienced a Y-o-Y growth of over 8% to reach US$ 2.9 Bn. The market is set to further aggrandize at a CAGR of nearly 8.6% through 2031. U.S. is offering the opportunity for generation of high revenue during the forecast period, owing to high presence of cold chain monitoring solution players.
U.S. has witnessed a high demand for chilled products, frozen meat, dairy products, increase in variety of drugs and this is increasing the demand for IoT for cold chain monitoring.
Based on current trend estimates, in 2019, U.S. was world’s largest pharmaceutical market that accounted for 48% of global pharmaceutical market. Due to increasing demand for medicines in U.S. the demand for IoT for cold chain monitoring also increased for monitoring the medicines temperature and prevent from damage.
How Big is the U.K. IoT for Cold Chain Monitoring Landscape?
The U.K IoT for cold chain monitoring market is expanding due to rise in online grocery shopping that resulted in the increasing number of refrigerated warehouse. The U.K. has been named as the third largest online grocery market in the world. Around 6.1% of the grocery sales in the U.K. is made online, which in turn is propelling the U.K. IoT for cold chain monitoring market growth.
The growing demand for refrigerated warehouse and development of pharma sector is driving the IoT for cold chain monitoring market in U.K. The U.K. DC IoT cold chain monitoring market is estimated to reach a valuation of 555 Mn by the end of 2031 by registering a CAGR of 11%
How is IoT for Cold Chain Monitoring Expanding in China?
China is estimated to record an incremental opportunity worth US$ 1.6 Bn during the forecast period. China IoT for cold chain monitoring market growth is driven by meat, quick frozen food, fruits & vegetables and dairy products. China food industry generated revenue of around 8 Tr in 2019.
Key player food & beverages sector in China are focusing on investing in cold chain monitoring to offer their fresh and undamaged products in the market.
How Big is ASEAN IoT for Cold Chain Monitoring Market?
ASEAN is estimated to register a high growth at a CAGR of 19.2% during the forecast period. As the COVID-19 pandemic is affecting various industries including the food & beverages, the cold storage companies have emerged as a key point in the supply chain.
Food manufacturers and cold storage warehouse are operating with skeletal workforce for ensuring the flow of fresh food products to super markets, grocery stores and convenience store.
As various ASEAN countries are imposing lockdown for mitigating the spread of virus, cold chain technologies are helping cold chain operators in managing and keeping products within a specific temperature range throughout the supply chain as the demand for fresh and frozen food is increasing.
Adoption of cold chain technologies such as cloud WMS, RFID, sensor tags, AGVs, IOT and mobile racking is increasing for enhancing the overall warehouse operations, improve efficiency and connect seamlessly to every step of the cold chain process.
For mitigating the impact of COVID-19 cold storage companies are revisiting their supply chain strategy and are increasing adopting the sensor technologies, implementing supply chain risk management and business continuity strategies. Cold chain companies need to continuously improve by embracing automation and digitization to reduce costs and increase business efficiency.
Category-wise Insights
What is Supporting Uptake of IoT Software/Platform for Cold Chain Monitoring?
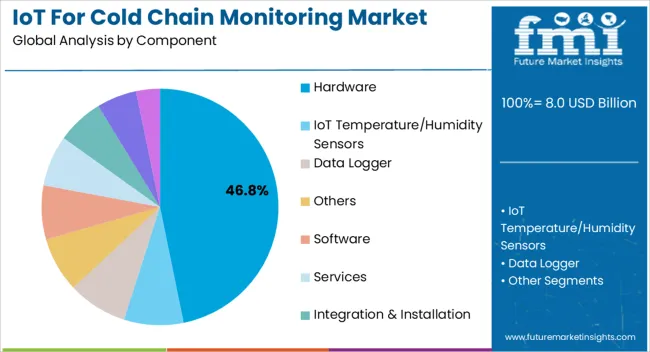
By component, IoT Software/ Platform for cold chain monitoring is expected to register a CAGR of 15.1% throughout the forecast period. The IoT software for cold chain monitoring offers the ability to uninterruptedly monitor the performance of cold chain in real time and ensure adherence to guidelines set by regulatory agencies.
Players are focusing on offering the IoT software for reporting, data analytics and tracking for products. However, over the course of the forecast period, dominance is going to remain with the hardware segment in terms of component.
Which Enterprise Size is Exhibiting High Demand?
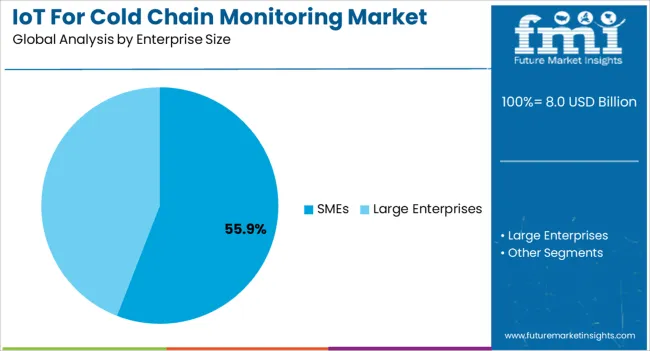
While the uptake among large enterprises continues to be higher, FMI has projected the demand for small and medium enterprises (SMEs) to rise at a higher pace in the coming years. Growth in the latter category of industries will be supported by the rapid adoption of IoT technologies among SMEs, intended at reducing overall expenditure incurred on various operations.
Which Industry Dominated in 2020?
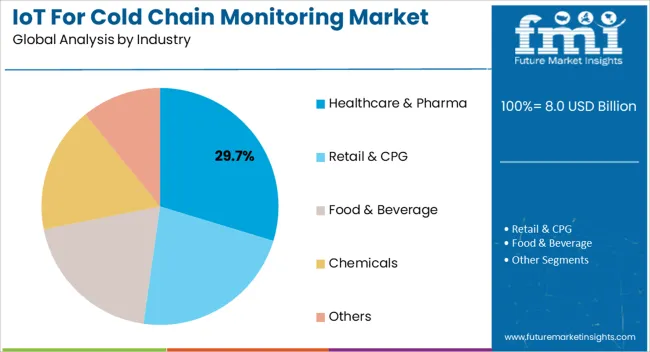
The food & beverages industry dominated and accounted a market share of 30.5% in 2020. The perishability of food and its wastages has been a major concern that starts from the raw material procurement to showcasing end products on the retail shelf. Noticeable changes in ambient temperature resulting from climate changes have an alarming effect on cold chain infrastructure, thus the increasing need for resilient cold chain solutions to protect the food products from damage.
Competition Landscape
FMI has profiled the following prominent IoT for Cold Chain Monitoring providers in its report:
- Huawei Technologies
- Aeris Communication
- HC Technologies
- SenseGiz Inc.,
- Zebra Technologies
- TE Connectivity
- Moschip Technologies Limited
- Laird Connectivity
- Roambee Corporation
The aforementioned players rely on multiple expansion strategies to deepen penetration across lucrative markets. These strategies include product launches, collaborations with key players, partnerships, acquisitions and strengthening of regional and global distribution networks.
SenseGiz Inc., for instance, is a company that offers enterprise and industrial IoT products for sensors based monitoring, security and real time asset tracking application.
In August 2020, Roambee Corporation entered into partnership agreement with Rogers to enable businesses to take advantage of Internet of Things technologies, resulting in smarter, more agile supply chain and connected operations.
Also, in December 2020, Laird Connectivity introduced Sentrius BT610 IoT sensor that is built on Laird Connectivity expertise developing the longest range sensors.
IoT for Cold Chain Monitoring Market Report Scope
Attribute |
Details |
Forecast Period |
2021-2031 |
Historical Data Available for |
2016-2020 |
Market Analysis |
US$ Mn for Value & Units for Volume |
Key Regions Covered |
North America, Europe, Middle East & Africa and Rest of the World |
Key Countries Covered |
U.S., Canada, Germany, Italy, France, U.K., Spain, GCC and South Africa |
Key Segments Covered |
Component, Enterprise Size, Industry and Region |
Key Companies Profiled |
|
Customization & Pricing |
Key Segments Covered of the IoT for Cold Chain Monitoring Market
Component
- Hardware
- IoT Temperature/Humidity Sensors
- Data Logger
- Others
- IoT Software/Platform for Cold Chain Monitoring
- Services
- Integration & Installation
- Consulting
- Support & Maintenance
Enterprise Size
- SMEs
- Large Enterprises
Industry
- Healthcare & Pharma
- Retail & CPG
- Food & Beverages
- Chemicals
- Others
Region
- North America
- Latin America
- Europe
- East Asia
- South Asia & Pacific
- Middle East & Africa (MEA)
Frequently Asked Questions
FMI projects the global IoT for cold chain monitoring market to register a CAGR of 13.6% during 2021-2031 owing to focus on quality and product sensitivity, government changing policies, and regulations and growth in pharma sector.
In recent years, the demand for IoT for cold chain monitoring has been increasing owing to increasing investments in R&D of wireless sensors, and cold chain monitoring software by key players.
Prominent players operating in the global IoT for Cold Chain Monitoring landscape include Huawei Technologies, Roambee Corporation, TE Connectivity, Moschip Technologies Limited, HC Technologies, Laird Connectivity among others
The hardware platform for IoT for Cold Chain Monitoring is highly sought-after. However, growth in the IoT Software/Platform for Cold Chain Monitoring is likely to happen at a higher pace between 2021 and 2031.
1. Executive Summary
1.1. Global Market Outlook
1.2. Demand Side Trends
1.3. Supply Side Trends
1.4. Analysis and Recommendations
2. Market Overview
2.1. Market Coverage / Taxonomy
2.2. Market Definition / Scope / Limitations
3. Key Market Trends
3.1. Key Trends Impacting the Market
3.2. Server Technology Innovation / Development Trends
3.3. Key Success Factors
4. IoT for Cold Chain Monitoring - Pricing Analysis
4.1. Pricing Analysis, By Component
4.2. Average Pricing Analysis Benchmark
5. COVID-19 Impact Analysis
5.1. Impact of COVID-19 on IoT for Cold Chain Monitoring Market
5.1.1. Pre-COVID-19 Market Growth
5.1.2. Post-COVID-19 Market Growth
5.2. Expected Recovery Scenario (Short Term/Mid Term/Long Term)
5.3. Key Action Points for DC Powered Server Vendors
6. Market Structure Analysis
6.1. Market Analysis by Tier of Companies
6.2. Market Concentration
6.3. Market Share Analysis of Top Players
6.4. Market Presence Analysis
6.4.1. Regional footprint by Players
6.4.2. Product footprint by Players
6.4.3. Channel footprint by Players
7. Global IoT for Cold Chain Monitoring Market Demand (in Volume in ‘000 Units) Analysis 2016-2020 and Forecast, 2021-2031
7.1. Historical Market Volume (‘000 Units) Analysis, 2016-2020
7.2. Current and Future Market Volume (‘000 Units) Projections, 2021-2031
7.2.1. Y-o-Y Growth Trend Analysis
8. Global IoT for Cold Chain Monitoring Market Demand (in Value in US$ Mn) Analysis 2016-2020 and Forecast, 2021-2031
8.1. Historical Market Value (US$ Mn) Analysis, 2016-2020
8.2. Current and Future Market Value (US$ Mn) Projections, 2021-2031
8.2.1. Y-o-Y Growth Trend Analysis
8.2.2. Absolute $ Opportunity Analysis
9. Market Background
9.1. Macro-Economic Factors
9.2. Forecast Factors - Relevance & Impact
9.3. Value Chain
9.4. Market Dynamics
9.4.1. Drivers
9.4.2. Restraints
9.4.3. Opportunities
10. Global IoT for Cold Chain Monitoring Market Analysis 2016-2020 and Forecast 2021-2031, by Component
10.1. Introduction / Key Findings
10.2. Historical Market Size (US$ Mn) and Volume (‘000 Units) Analysis By Component, 2016 - 2020
10.3. Current and Future Market Size (US$ Mn) and Volume (‘000 Units) Analysis and Forecast By Component, 2021 - 2031
10.3.1. Hardware
10.3.1.1. IoT Temperature/Humidity Sensors
10.3.1.2. Data Loggers
10.3.1.3. Others
10.3.2. IoT Software/Platform for Cold Chain Monitoring
10.3.3. Services
10.3.3.1. Integration & Installation
10.3.3.2. Consulting
10.3.3.3. Support & Maintenance
10.4. Market Attractiveness Analysis by Component
11. Global IoT for Cold Chain Monitoring Market Analysis 2016-2020 and Forecast 2021-2031, by Enterprise Size
11.1. Introduction / Key Findings
11.2. Historical Market Size (US$ Mn) Analysis By Enterprise Size, 2016 - 2020
11.3. Current and Future Market Size (US$ Mn) Analysis and Forecast by Enterprise Size, 2021 - 2031
11.3.1. SMEs
11.3.2. Large Enterprises
11.4. Market Attractiveness Analysis by Enterprise Size
12. Global IoT for Cold Chain Monitoring Market Analysis 2016-2020 and Forecast 2021-2031, by Industry
12.1. Introduction / Key Findings
12.2. Historical Market Size (US$ Mn) Analysis By Industry, 2016 - 2020
12.3. Current and Future Market Size (US$ Mn) Analysis and Forecast by Industry, 2021 - 2031
12.3.1. Healthcare & Pharma
12.3.2. Retail & CPG
12.3.3. Food & Beverages
12.3.4. Chemicals
12.3.5. Others
12.4. Market Attractiveness Analysis by Industry
13. Global IoT for Cold Chain Monitoring Market Analysis 2016-2020 and Forecast 2021-2031, by Region
13.1. Introduction / Key Findings
13.2. Historical Market Size (US$ Mn) and Volume (‘000 Units) Analysis By Region, 2016 - 2020
13.3. Current and Future Market Size (US$ Mn) and Volume (‘000 Units) Analysis and Forecast By Region, 2021 - 2031
13.3.1. North America
13.3.2. Latin America
13.3.3. Europe
13.3.4. East Asia
13.3.5. South Asia & Pacific
13.3.6. Middle East & Africa
13.4. Market Attractiveness Analysis By Region
14. North America IoT for Cold Chain Monitoring Market Analysis 2016-2020 and Forecast 2021-2031
14.1. Introduction
14.2. Historical Market Size (US$ Mn) and Volume (‘000 Units) Trend Analysis By Market Taxonomy, 2016 - 2020
14.3. Current and Future Market Size (US$ Mn) and Volume (‘000 Units) Forecast By Market Taxonomy, 2021 - 2031
14.3.1. By Component
14.3.2. By Enterprise Size
14.3.3. By Industry
14.3.4. By Country
14.3.4.1. U.S.
14.3.4.2. Canada
14.4. Market Attractiveness Analysis
14.4.1. By Component
14.4.2. By Enterprise Size
14.4.3. By Industry
14.4.4. By Country
14.5. Market Trends
14.6. Key Market Participants - Intensity Mapping
15. Latin America IoT for Cold Chain Monitoring Market Analysis 2016-2020 and Forecast 2021-2031
15.1. Introduction
15.2. Historical Market Size (US$ Mn) and Volume (‘000 Units) Trend Analysis By Market Taxonomy, 2016 - 2020
15.3. Current and Future Market Size (US$ Mn) and Volume (‘000 Units) Forecast By Market Taxonomy, 2021 - 2031
15.3.1. By Component
15.3.2. By Enterprise Size
15.3.3. By Industry
15.3.4. By Country
15.3.4.1. Brazil
15.3.4.2. Mexico
15.3.4.3. Rest of Latin America
15.4. Market Attractiveness Analysis
15.4.1. By Component
15.4.2. By Enterprise Size
15.4.3. By Industry
15.4.4. By Country
15.5. Market Trends
15.6. Key Market Participants - Intensity Mapping
16. Europe IoT for Cold Chain Monitoring Market Analysis 2016-2020 and Forecast 2021-2031
16.1. Introduction
16.2. Historical Market Size (US$ Mn) and Volume (‘000 Units) Trend Analysis By Market Taxonomy, 2016 - 2020
16.3. Current and Future Market Size (US$ Mn) and Volume (‘000 Units) Forecast By Market Taxonomy, 2021 - 2031
16.3.1. By Component
16.3.2. By Enterprise Size
16.3.3. By Industry
16.3.4. By Country
16.3.4.1. Germany
16.3.4.2. Italy
16.3.4.3. France
16.3.4.4. U.K.
16.3.4.5. Spain
16.3.4.6. BENELUX
16.3.4.7. Russia
16.3.4.8. Rest of Europe
16.4. Market Attractiveness Analysis
16.4.1. By Component
16.4.2. By Enterprise Size
16.4.3. By Industry
16.4.4. By Country
16.5. Market Trends
16.6. Key Market Participants - Intensity Mapping
17. East Asia IoT for Cold Chain Monitoring Market Analysis 2016-2020 and Forecast 2021-2031
17.1. Introduction
17.2. Historical Market Size (US$ Mn) and Volume (‘000 Units) Trend Analysis By Market Taxonomy, 2016 - 2020
17.3. Current and Future Market Size (US$ Mn) and Volume (‘000 Units) Forecast By Market Taxonomy, 2021 - 2031
17.3.1. By Component
17.3.2. By Enterprise Size
17.3.3. By Industry
17.3.4. By Country
17.3.4.1. China
17.3.4.2. Japan
17.3.4.3. South Korea
17.4. Market Attractiveness Analysis
17.4.1. By Component
17.4.2. By Enterprise Size
17.4.3. By Industry
17.4.4. By Country
17.5. Market Trends
17.6. Key Market Participants - Intensity Mapping
18. South Asia & Pacific IoT for Cold Chain Monitoring Market Analysis 2016-2020 and Forecast 2021-2031
18.1. Introduction
18.2. Historical Market Size (US$ Mn) and Volume (‘000 Units) Trend Analysis By Market Taxonomy, 2016 - 2020
18.3. Current and Future Market Size (US$ Mn) and Volume (‘000 Units) Forecast By Market Taxonomy, 2021 - 2031
18.3.1. By Component
18.3.2. By Enterprise Size
18.3.3. By Industry
18.3.4. By Country
18.3.4.1. India
18.3.4.2. Thailand
18.3.4.3. Indonesia
18.3.4.4. Malaysia
18.3.4.5. Australia & New Zealand
18.3.4.6. Rest of South Asia
18.4. Market Attractiveness Analysis
18.4.1. By Component
18.4.2. By Enterprise Size
18.4.3. By Industry
18.4.4. By Country
18.5. Market Trends
18.6. Key Market Participants - Intensity Mapping
19. Middle East and Africa IoT for Cold Chain Monitoring Market Analysis 2016-2020 and Forecast 2021-2031
19.1. Introduction
19.2. Historical Market Size (US$ Mn) and Volume (‘000 Units) Trend Analysis By Market Taxonomy, 2016 - 2020
19.3. Current and Future Market Size (US$ Mn) and Volume (‘000 Units) Forecast By Market Taxonomy, 2021 - 2031
19.3.1. By Component
19.3.2. By Enterprise Size
19.3.3. By Industry
19.3.4. By Country
19.3.4.1. GCC Countries
19.3.4.2. Turkey
19.3.4.3. Northern Africa
19.3.4.4. South Africa
19.3.4.5. Rest of Middle East and Africa
19.4. Market Attractiveness Analysis
19.4.1. By Component
19.4.2. By Enterprise Size
19.4.3. By Industry
19.4.4. By Country
19.5. Market Trends
19.6. Key Market Participants - Intensity Mapping
20. Key and Emerging Countries Analysis- IoT for Cold Chain Monitoring Market
20.1. U.S. IoT for Cold Chain Monitoring Market Analysis
20.1.1. By Component
20.1.2. By Enterprise Size
20.1.3. By Industry
20.2. Canada IoT for Cold Chain Monitoring Market Analysis
20.2.1. By Component
20.2.2. By Enterprise Size
20.2.3. By Industry
20.3. Mexico IoT for Cold Chain Monitoring Market Analysis
20.3.1. By Component
20.3.2. By Enterprise Size
20.3.3. By Industry
20.4. Brazil IoT for Cold Chain Monitoring Market Analysis
20.4.1. By Component
20.4.2. By Enterprise Size
20.4.3. By Industry
20.5. Germany IoT for Cold Chain Monitoring Market Analysis
20.5.1. By Component
20.5.2. By Enterprise Size
20.5.3. By Industry
20.6. Italy IoT for Cold Chain Monitoring Market Analysis
20.6.1. By Component
20.6.2. By Enterprise Size
20.6.3. By Industry
20.7. France IoT for Cold Chain Monitoring Market Analysis
20.7.1. By Component
20.7.2. By Enterprise Size
20.7.3. By Industry
20.8. U.K. IoT for Cold Chain Monitoring Market Analysis
20.8.1. By Component
20.8.2. By Enterprise Size
20.8.3. By Industry
20.9. Spain IoT for Cold Chain Monitoring Market Analysis
20.9.1. By Component
20.9.2. By Enterprise Size
20.9.3. By Industry
20.10. BENELUX IoT for Cold Chain Monitoring Market Analysis
20.10.1. By Component
20.10.2. By Enterprise Size
20.10.3. By Industry
20.11. Russia IoT for Cold Chain Monitoring Market Analysis
20.11.1. By Component
20.11.2. By Enterprise Size
20.11.3. By Industry
20.12. China IoT for Cold Chain Monitoring Market Analysis
20.12.1. By Component
20.12.2. By Enterprise Size
20.12.3. By Industry
20.13. Japan IoT for Cold Chain Monitoring Market Analysis
20.13.1. By Component
20.13.2. By Enterprise Size
20.13.3. By Industry
20.14. South Korea IoT for Cold Chain Monitoring Market Analysis
20.14.1. By Component
20.14.2. By Enterprise Size
20.14.3. By Industry
20.15. India IoT for Cold Chain Monitoring Market Analysis
20.15.1. By Component
20.15.2. By Enterprise Size
20.15.3. By Industry
20.16. ASEAN IoT for Cold Chain Monitoring Market Analysis
20.16.1. By Component
20.16.2. By Enterprise Size
20.16.3. By Industry
20.17. Australia and New Zealand IoT for Cold Chain Monitoring Market Analysis
20.17.1. By Component
20.17.2. By Enterprise Size
20.17.3. By Industry
20.18. GCC Countries IoT for Cold Chain Monitoring Market Analysis
20.18.1. By Component
20.18.2. By Enterprise Size
20.18.3. By Industry
20.19. Turkey IoT for Cold Chain Monitoring Market Analysis
20.19.1. By Component
20.19.2. By Enterprise Size
20.19.3. By Industry
20.20. South Africa IoT for Cold Chain Monitoring Market Analysis
20.20.1. By Component
20.20.2. By Enterprise Size
20.20.3. By Industry
21. Competition Analysis
21.1. Competition Dashboard
21.2. Competition Deep Dive
21.2.1. Huawei Technologies Co., Ltd.
21.2.1.1. Business Overview
21.2.1.2. Product & Service Portfolio
21.2.1.3. Key Financial Data
21.2.1.4. Strategy Overview
21.2.1.4.1. Marketing Strategy
21.2.1.4.2. Product Strategy
21.2.1.4.3. Channel Strategy
21.2.2. TE Connectivity
21.2.2.1. Business Overview
21.2.2.2. Product & Service Portfolio
21.2.2.3. Key Financial Data
21.2.2.4. Strategy Overview
21.2.2.4.1. Marketing Strategy
21.2.2.4.2. Product Strategy
21.2.2.4.3. Channel Strategy
21.2.3. Zebra Technologies
21.2.3.1. Business Overview
21.2.3.2. Product & Service Portfolio
21.2.3.3. Key Financial Data
21.2.3.4. Strategy Overview
21.2.3.4.1. Marketing Strategy
21.2.3.4.2. Product Strategy
21.2.3.4.3. Channel Strategy
21.2.4. MosChip Technologies Limited
21.2.4.1. Business Overview
21.2.4.2. Product & Service Portfolio
21.2.4.3. Key Financial Data
21.2.4.4. Strategy Overview
21.2.4.4.1. Marketing Strategy
21.2.4.4.2. Product Strategy
21.2.4.4.3. Channel Strategy
21.2.5. Aeris
21.2.5.1. Business Overview
21.2.5.2. Product & Service Portfolio
21.2.5.3. Key Financial Data
21.2.5.4. Strategy Overview
21.2.5.4.1. Marketing Strategy
21.2.5.4.2. Product Strategy
21.2.5.4.3. Channel Strategy
21.2.6. Laird Connectivity
21.2.6.1. Business Overview
21.2.6.2. Product & Service Portfolio
21.2.6.3. Key Financial Data
21.2.6.4. Strategy Overview
21.2.6.4.1. Marketing Strategy
21.2.6.4.2. Product Strategy
21.2.6.4.3. Channel Strategy
21.2.7. Roambee Corporation
21.2.7.1. Business Overview
21.2.7.2. Product & Service Portfolio
21.2.7.3. Key Financial Data
21.2.7.4. Strategy Overview
21.2.7.4.1. Marketing Strategy
21.2.7.4.2. Product Strategy
21.2.7.4.3. Channel Strategy
21.2.8. SenseGiz Inc.
21.2.8.1. Business Overview
21.2.8.2. Product & Service Portfolio
21.2.8.3. Key Financial Data
21.2.8.4. Strategy Overview
21.2.8.4.1. Marketing Strategy
21.2.8.4.2. Product Strategy
21.2.8.4.3. Channel Strategy
21.2.9. HC Technologies
21.2.9.1. Business Overview
21.2.9.2. Product & Service Portfolio
21.2.9.3. Key Financial Data
21.2.9.4. Strategy Overview
21.2.9.4.1. Marketing Strategy
21.2.9.4.2. Product Strategy
21.2.9.4.3. Channel Strategy
21.2.10. DycodeX
21.2.10.1. Business Overview
21.2.10.2. Product & Service Portfolio
21.2.10.3. Key Financial Data
21.2.10.4. Strategy Overview
21.2.10.4.1. Marketing Strategy
21.2.10.4.2. Product Strategy
21.2.10.4.3. Channel Strategy
22. Assumptions and Acronyms Used
23. Research Methodology
Let us know your requirement to get
100% FREE customization
Table 01: Region-wise IoT for Cold Chain Monitoring Market Average Pricing (US$) Analysis by Component, 2020
Table 02: Global IoT for Cold Chain Monitoring Market Value (US$ Mn) Analysis by Component, 2016-2031
Table 03: Global IoT for Cold Chain Monitoring Market Volume (Units) Analysis by Component, 2020-2031
Table 04: Global IoT for Cold Chain Monitoring Market Value (US$ Mn) Analysis by Enterprise Size, 2016-2031
Table 05: Global IoT for Cold Chain Monitoring Market Value (US$ Mn) Analysis by Industry, 2016-2031
Table 06: Global IoT for Cold Chain Monitoring Market Value (US$ Mn) Analysis by Region, 2016-2031
Table 07: North America IoT for Cold Chain Monitoring Market Value (US$ Mn) Analysis by Component, 2016-2031
Table 08: North America IoT for Cold Chain Monitoring Market Volume (Units) Analysis by Component, 2020-2031
Table 09: North America IoT for Cold Chain Monitoring Market Value (US$ Mn) Analysis by Enterprise Size, 2016-2031
Table 10: North America IoT for Cold Chain Monitoring Market Value (US$ Mn) Analysis by Industry, 2016-2031
Table 11: North America IoT for Cold Chain Monitoring Market Value (US$ Mn) Analysis by Country, 2016-2031
Table 12: Latin America IoT for Cold Chain Monitoring Market Value (US$ Mn) Analysis by Component, 2016-2031
Table 13: Latin America IoT for Cold Chain Monitoring Market Volume (Units) Analysis by Component, 2020-2031
Table 14: Latin America IoT for Cold Chain Monitoring Market Value (US$ Mn) Analysis by Enterprise Size, 2016-2031
Table 15: Latin America IoT for Cold Chain Monitoring Market Value (US$ Mn) Analysis by Industry, 2016-2031
Table 16: Latin America IoT for Cold Chain Monitoring Market Value (US$ Mn) Analysis By Country, 2015 – 2030
Table 17: Europe IoT for Cold Chain Monitoring Market Value (US$ Mn) Analysis by Component, 2016-2031
Table 18: Europe IoT for Cold Chain Monitoring Market Volume (Units) Analysis by Component, 2020-2031
Table 19: Europe IoT for Cold Chain Monitoring Market Value (US$ Mn) Analysis by Enterprise Size, 2016-2031
Table 20: Europe IoT for Cold Chain Monitoring Market Value (US$ Mn) Analysis by Industry, 2016-2031
Table 21: Europe IoT for Cold Chain Monitoring Market Value (US$ Mn) Analysis By Country, 2015 – 2030
Table 22: East Asia IoT for Cold Chain Monitoring Market Value (US$ Mn) Analysis by Component, 2016-2031
Table 23: East Asia IoT for Cold Chain Monitoring Market Volume (Units) Analysis by Component, 2020-2031
Table 24: East Asia IoT for Cold Chain Monitoring Market Value (US$ Mn) Analysis by Enterprise Size, 2016-2031
Table 25: East Asia IoT for Cold Chain Monitoring Market Value (US$ Mn) Analysis by Industry, 2016-2031
Table 26: East Asia IoT for Cold Chain Monitoring Market Value (US$ Mn) Analysis By Country, 2015 – 2030
Table 27: South Asia & Pacific IoT for Cold Chain Monitoring Market Value (US$ Mn) Analysis by Component, 2016-2031
Table 28: South Asia & Pacific IoT for Cold Chain Monitoring Market Volume (Units) Analysis by Component, 2020-2031
Table 29: South Asia & Pacific IoT for Cold Chain Monitoring Market Value (US$ Mn) Analysis by Enterprise Size, 2016-2031
Table 30: South Asia & Pacific IoT for Cold Chain Monitoring Market Value (US$ Mn) Analysis by Industry, 2016-2031
Table 31: South Asia & Pacific IoT for Cold Chain Monitoring Market Value (US$ Mn) Analysis By Country, 2015 – 2030
Table 32: Middle East & Africa IoT for Cold Chain Monitoring Market Value (US$ Mn) Analysis by Component, 2016-2031
Table 33: Middle East & Africa IoT for Cold Chain Monitoring Market Volume (Units) Analysis by Component, 2020-2031
Table 34: Middle East & Africa IoT for Cold Chain Monitoring Market Value (US$ Mn) Analysis by Enterprise Size, 2016-2031
Table 35: Middle East & Africa IoT for Cold Chain Monitoring Market Value (US$ Mn) Analysis by Industry, 2016-2031
Table 36: Middle East & Africa IoT for Cold Chain Monitoring Market Value (US$ Mn) Analysis By Country, 2015 – 2030
Find your sweet spots for generating winning opportunities in this market.
Talk to AnalystFigure 01: Global IoT for Cold Chain Monitoring Market Volume in Units and Y-o-Y Growth Rate from 2021 – 2031
Figure 02: Global IoT for Cold Chain Monitoring Market Size and Y-o-Y Growth Rate from 2021 – 2031
Figure 03: Global IoT for Cold Chain Monitoring Market Absolute $ Opportunity (US$ Mn), 2020 – 2031
Figure 04: Global IoT for Cold Chain Monitoring Market Share Analysis by Component– 2021 & 2031
Figure 05: Global IoT for Cold Chain Monitoring Market Y-o-Y Growth by Component, 2021 – 2031
Figure 06: Global IoT for Cold Chain Monitoring Market Attractiveness Analysis by Component, 2021 – 2031
Figure 07: Global IoT for Cold Chain Monitoring Market Share Analysis by Enterprise Size– 2021 & 2031
Figure 08: Global IoT for Cold Chain Monitoring Market Y-o-Y Growth by Enterprise Size, 2021 – 2031
Figure 09: Global IoT for Cold Chain Monitoring Market Attractiveness Analysis by Enterprise Size, 2021 – 2031
Figure 10: Global IoT for Cold Chain Monitoring Market Share Analysis by Industry – 2021 & 2031
Figure 11: Global IoT for Cold Chain Monitoring Market Y-o-Y Growth by Industry, 2021 – 2031
Figure 12: Global IoT for Cold Chain Monitoring Market Attractiveness Analysis by Industry, 2021 – 2031
Figure 13: Global IoT for Cold Chain Monitoring Market Value (US$ Mn), 2016-2020
Figure 14: Global IoT for Cold Chain Monitoring Market Value (US$ Mn), 2021-2031
Figure 15: Global IoT for Cold Chain Monitoring Market Share Analysis by Region – 2021 & 2031
Figure 16: Global IoT for Cold Chain Monitoring Market Y-o-Y Growth by Region, 2021 – 2031
Figure 17: Global IoT for Cold Chain Monitoring Market Attractiveness Analysis by Region, 2021 – 2031
Figure 18: North America IoT for Cold Chain Monitoring Market Absolute $ Opportunity (US$ Mn), 2016-2031
Figure 19: Latin America IoT for Cold Chain Monitoring Market Absolute $ Opportunity (US$ Mn), 2016-2031
Figure 20: Europe IoT for Cold Chain Monitoring Market Absolute $ Opportunity (US$ Mn), 2016-2031
Figure 21: East Asia IoT for Cold Chain Monitoring Market Absolute $ Opportunity (US$ Mn), 2016-2031
Figure 22: South Asia & Pacific IoT for Cold Chain Monitoring Market Absolute $ Opportunity (US$ Mn), 2016-2031
Figure 23: Middle East & Africa IoT for Cold Chain Monitoring Market Absolute $ Opportunity (US$ Mn), 2016-2031
Figure 24: North America IoT for Cold Chain Monitoring Market Value (US$ Mn), 2016-2020
Figure 25: North America IoT for Cold Chain Monitoring Market Value (US$ Mn), 2021-2031
Figure 26: North America IoT for Cold Chain Monitoring Market Share Analysis by Component– 2021 & 2031
Figure 27: North America IoT for Cold Chain Monitoring Market Y-o-Y Growth by Component, 2021 – 2031
Figure 28: North America IoT for Cold Chain Monitoring Market Attractiveness Analysis by Component, 2021 – 2031
Figure 29: North America IoT for Cold Chain Monitoring Market Share Analysis by Enterprise Size– 2021 & 2031
Figure 30: North America IoT for Cold Chain Monitoring Market Y-o-Y Growth by Enterprise Size, 2021 – 2031
Figure 31: North America IoT for Cold Chain Monitoring Market Attractiveness Analysis by Enterprise Size, 2021 – 2031
Figure 32: North America IoT for Cold Chain Monitoring Market Share Analysis by Industry – 2021 & 2031
Figure 33: North America IoT for Cold Chain Monitoring Market Y-o-Y Growth by Industry, 2021 – 2031
Figure 34: North America IoT for Cold Chain Monitoring Market Attractiveness Analysis by Industry, 2021 – 2031
Figure 35: North America IoT for Cold Chain Monitoring Market Share Analysis by Country – 2021 & 2031
Figure 36: North America IoT for Cold Chain Monitoring Market Y-o-Y Growth by Country, 2021 – 2031
Figure 37: North America IoT for Cold Chain Monitoring Market Attractiveness Analysis by Country, 2021 – 2031
Figure 38: U.S. IoT for Cold Chain Monitoring Market Absolute $ Opportunity (US$ Mn), 2016-2031
Figure 39: Canada IoT for Cold Chain Monitoring Market Absolute $ Opportunity (US$ Mn), 2016-2031
Figure 40: Latin America IoT for Cold Chain Monitoring Market Value (US$ Mn), 2016-2020
Figure 41: Latin America IoT for Cold Chain Monitoring Market Value (US$ Mn), 2021-2031
Figure 42: Latin America IoT for Cold Chain Monitoring Market Share Analysis by Component– 2021 & 2031
Figure 43: Latin America IoT for Cold Chain Monitoring Market Y-o-Y Growth by Component, 2021 – 2031
Figure 44: Latin America IoT for Cold Chain Monitoring Market Attractiveness Analysis by Component, 2021 – 2031
Figure 45: Latin America IoT for Cold Chain Monitoring Market Share Analysis by Enterprise Size– 2021 & 2031
Figure 46: Latin America IoT for Cold Chain Monitoring Market Y-o-Y Growth by Enterprise Size, 2021 – 2031
Figure 47: Latin America IoT for Cold Chain Monitoring Market Attractiveness Analysis by Enterprise Size, 2021 – 2031
Figure 48: Latin America IoT for Cold Chain Monitoring Market Share Analysis by Industry – 2021 & 2031
Figure 49: Latin America IoT for Cold Chain Monitoring Market Y-o-Y Growth by Industry, 2021 – 2031
Figure 50: Latin America IoT for Cold Chain Monitoring Market Attractiveness Analysis by Industry, 2021 – 2031
Figure 51: Latin America IoT for Cold Chain Monitoring Market Share Analysis by Country – 2021 & 2031
Figure 52: Latin America IoT for Cold Chain Monitoring Market Y-o-Y Growth by Country, 2021 – 2031
Figure 53: Latin America IoT for Cold Chain Monitoring Market Attractiveness Analysis By Country, 2021 – 2031
Figure 54: Brazil IoT for Cold Chain Monitoring Market Absolute $ Opportunity (US$ Mn), 2015 – 2030
Figure 55: Mexico IoT for Cold Chain Monitoring Market Absolute $ Opportunity (US$ Mn), 2015 – 2030
Figure 56: Rest of LA IoT for Cold Chain Monitoring Market Absolute $ Opportunity (US$ Mn), 2015 – 2030
Figure 57: Europe IoT for Cold Chain Monitoring Market Value (US$ Mn), 2016-2020
Figure 58: Europe IoT for Cold Chain Monitoring Market Value (US$ Mn), 2021-2031
Figure 59: Europe IoT for Cold Chain Monitoring Market Share Analysis by Component– 2021 & 2031
Figure 60: Europe IoT for Cold Chain Monitoring Market Y-o-Y Growth by Component, 2021 – 2031
Figure 61: Europe IoT for Cold Chain Monitoring Market Attractiveness Analysis by Component, 2021 – 2031
Figure 62: Europe IoT for Cold Chain Monitoring Market Share Analysis by Enterprise Size– 2021 & 2031
Figure 63: Europe IoT for Cold Chain Monitoring Market Y-o-Y Growth by Enterprise Size, 2021 – 2031
Figure 64: Europe IoT for Cold Chain Monitoring Market Attractiveness Analysis by Enterprise Size, 2021 – 2031
Figure 65: Europe IoT for Cold Chain Monitoring Market Share Analysis by Industry – 2021 & 2031
Figure 66: Europe IoT for Cold Chain Monitoring Market Y-o-Y Growth by Industry, 2021 – 2031
Figure 67: Europe IoT for Cold Chain Monitoring Market Attractiveness Analysis by Industry, 2021 – 2031
Figure 68: Europe IoT for Cold Chain Monitoring Market Share Analysis by Country – 2021 & 2031
Figure 69: Europe IoT for Cold Chain Monitoring Market Y-o-Y Growth by Country, 2021 – 2031
Figure 70: Europe IoT for Cold Chain Monitoring Market Attractiveness Analysis By Country, 2021 – 2031
Figure 71: Germany IoT for Cold Chain Monitoring Market Absolute $ Opportunity (US$ Mn), 2015 – 2030
Figure 72: Italy IoT for Cold Chain Monitoring Market Absolute $ Opportunity (US$ Mn), 2015 – 2030
Figure 73: France IoT for Cold Chain Monitoring Market Absolute $ Opportunity (US$ Mn), 2015 – 2030
Figure 74: U.K. IoT for Cold Chain Monitoring Market Absolute $ Opportunity (US$ Mn), 2015 – 2030
Figure 75: Spain IoT for Cold Chain Monitoring Market Absolute $ Opportunity (US$ Mn), 2015 – 2030
Figure 76: BENELUX IoT for Cold Chain Monitoring Market Absolute $ Opportunity (US$ Mn), 2015 – 2030
Figure 77: Russia IoT for Cold Chain Monitoring Market Absolute $ Opportunity (US$ Mn), 2015 – 2030
Figure 78: Rest of Europe IoT for Cold Chain Monitoring Market Absolute $ Opportunity (US$ Mn), 2015 – 2030
Figure 79: East Asia IoT for Cold Chain Monitoring Market Value (US$ Mn), 2016-2020
Figure 80: East Asia IoT for Cold Chain Monitoring Market Value (US$ Mn), 2021-2031
Figure 81: East Asia IoT for Cold Chain Monitoring Market Share Analysis by Component– 2021 & 2031
Figure 82: East Asia IoT for Cold Chain Monitoring Market Y-o-Y Growth by Component, 2021 – 2031
Figure 83: East Asia IoT for Cold Chain Monitoring Market Attractiveness Analysis by Component, 2021 – 2031
Figure 84: East Asia IoT for Cold Chain Monitoring Market Share Analysis by Enterprise Size– 2021 & 2031
Figure 85: East Asia IoT for Cold Chain Monitoring Market Y-o-Y Growth by Enterprise Size, 2021 – 2031
Figure 86: East Asia IoT for Cold Chain Monitoring Market Attractiveness Analysis by Enterprise Size, 2021 – 2031
Figure 87: East Asia IoT for Cold Chain Monitoring Market Share Analysis by Industry – 2021 & 2031
Figure 88: East Asia IoT for Cold Chain Monitoring Market Y-o-Y Growth by Industry, 2021 – 2031
Figure 89: East Asia IoT for Cold Chain Monitoring Market Attractiveness Analysis by Industry, 2021 – 2031
Figure 90: East Asia IoT for Cold Chain Monitoring Market Share Analysis by Country – 2021 & 2031
Figure 91: East Asia IoT for Cold Chain Monitoring Market Y-o-Y Growth by Country, 2021 – 2031
Figure 92: East Asia IoT for Cold Chain Monitoring Market Attractiveness Analysis By Country, 2021 – 2031
Figure 93: China IoT for Cold Chain Monitoring Market Absolute $ Opportunity (US$ Mn), 2015 – 2030
Figure 94: Japan IoT for Cold Chain Monitoring Market Absolute $ Opportunity (US$ Mn), 2015 – 2030
Figure 95: South Korea IoT for Cold Chain Monitoring Market Absolute $ Opportunity (US$ Mn), 2015 – 2030
Figure 96: South Asia & Pacific IoT for Cold Chain Monitoring Market Value (US$ Mn), 2016-2020
Figure 97: South Asia & Pacific IoT for Cold Chain Monitoring Market Value (US$ Mn), 2021-2031
Figure 98: South Asia & Pacific IoT for Cold Chain Monitoring Market Share Analysis by Component– 2021 & 2031
Figure 99: South Asia & Pacific IoT for Cold Chain Monitoring Market Y-o-Y Growth by Component, 2021 – 2031
Figure 100: South Asia & Pacific IoT for Cold Chain Monitoring Market Attractiveness Analysis by Component, 2021 – 2031
Figure 101: South Asia & Pacific IoT for Cold Chain Monitoring Market Share Analysis by Enterprise Size– 2021 & 2031
Figure 102: South Asia & Pacific IoT for Cold Chain Monitoring Market Y-o-Y Growth by Enterprise Size, 2021 – 2031
Figure 103: South Asia & Pacific IoT for Cold Chain Monitoring Market Attractiveness Analysis by Enterprise Size, 2021 – 2031
Figure 104: South Asia & Pacific IoT for Cold Chain Monitoring Market Share Analysis by Industry – 2021 & 2031
Figure 105: South Asia & Pacific IoT for Cold Chain Monitoring Market Y-o-Y Growth by Industry, 2021 – 2031
Figure 106: South Asia & Pacific IoT for Cold Chain Monitoring Market Attractiveness Analysis by Industry, 2021 – 2031
Figure 107: South Asia & Pacific IoT for Cold Chain Monitoring Market Share Analysis by Country – 2021 & 2031
Figure 108: South Asia & Pacific IoT for Cold Chain Monitoring Market Y-o-Y Growth by Country, 2021 – 2031
Figure 109: South Asia & Pacific IoT for Cold Chain Monitoring Market Attractiveness Analysis By Country, 2021 – 2031
Figure 110: India IoT for Cold Chain Monitoring Market Absolute $ Opportunity (US$ Mn), 2015 – 2030
Figure 111: ASEAN IoT for Cold Chain Monitoring Market Absolute $ Opportunity (US$ Mn), 2015 – 2030
Figure 112: Australia & New Zealand IoT for Cold Chain Monitoring Market Absolute $ Opportunity (US$ Mn), 2015 – 2030
Figure 113: Rest of South Asia & Pacific IoT for Cold Chain Monitoring Market Absolute $ Opportunity (US$ Mn), 2015 2030
Figure 114: Middle East & Africa IoT for Cold Chain Monitoring Market Value (US$ Mn), 2016-2020
Figure 115: Middle East & Africa IoT for Cold Chain Monitoring Market Value (US$ Mn), 2021-2031
Figure 116: Middle East & Africa IoT for Cold Chain Monitoring Market Share Analysis by Component– 2021 & 2031
Figure 117: Middle East & Africa IoT for Cold Chain Monitoring Market Y-o-Y Growth by Component, 2021 – 2031
Figure 118: Middle East & Africa IoT for Cold Chain Monitoring Market Attractiveness Analysis by Component, 2021 – 2031
Figure 119: Middle East & Africa IoT for Cold Chain Monitoring Market Share Analysis by Enterprise Size– 2021 & 2031
Figure 120: Middle East & Africa IoT for Cold Chain Monitoring Market Y-o-Y Growth by Enterprise Size, 2021 – 2031
Figure 121: Middle East & Africa IoT for Cold Chain Monitoring Market Attractiveness Analysis by Enterprise Size, 2021 – 2031
Figure 122: Middle East & Africa IoT for Cold Chain Monitoring Market Share Analysis by Industry – 2021 & 2031
Figure 123: Middle East & Africa IoT for Cold Chain Monitoring Market Y-o-Y Growth by Industry, 2021 – 2031
Figure 124: Middle East & Africa IoT for Cold Chain Monitoring Market Attractiveness Analysis by Industry, 2021 – 2031
Figure 125: Middle East & Africa IoT for Cold Chain Monitoring Market Share Analysis by Country – 2021 & 2031
Figure 126: Middle East & Africa IoT for Cold Chain Monitoring Market Y-o-Y Growth by Country, 2021 – 2031
Figure 127: Middle East & Africa IoT for Cold Chain Monitoring Market Attractiveness Analysis By Country, 2021 – 2031
Figure 128: GCC Countries IoT for Cold Chain Monitoring Market Absolute $ Opportunity (US$ Mn), 2015 – 2030
Figure 129: Turkey IoT for Cold Chain Monitoring Market Absolute $ Opportunity (US$ Mn), 2015 – 2030
Figure 130: South Africa IoT for Cold Chain Monitoring Market Absolute $ Opportunity (US$ Mn), 2015 – 2030
Figure 131: Rest of Middle East & Africa IoT for Cold Chain Monitoring Market Absolute $ Opportunity (US$ Mn), 2015 2030
Figure 132: U.S. Incremental Opportunity Share Analysis, by Component
Figure 133 : U.S. Incremental Opportunity Share Analysis, by Enterprise Size
Figure 134: U.S. Incremental Opportunity Share Analysis, by Industry
Figure 135: Canada Incremental Opportunity Share Analysis, by Component
Figure 136 : Canada Incremental Opportunity Share Analysis, by Enterprise Size
Figure 137: Canada Incremental Opportunity Share Analysis, by Industry
Figure 138: Brazil Incremental Opportunity Share Analysis, by Component
Figure 139 : Brazil Incremental Opportunity Share Analysis, by Enterprise Size
Figure 140: Brazil Incremental Opportunity Share Analysis, by Industry
Figure 141: Mexico Incremental Opportunity Share Analysis, by Component
Figure 142 : Mexico Incremental Opportunity Share Analysis, by Enterprise Size
Figure 143: Mexico Incremental Opportunity Share Analysis, by Industry
Figure 144: Germany Incremental Opportunity Share Analysis, by Component
Figure 145 : Germany Incremental Opportunity Share Analysis, by Enterprise Size
Figure 146: Germany Incremental Opportunity Share Analysis, by Industry
Figure 147: Italy Incremental Opportunity Share Analysis, by Component
Figure 148 : Italy Incremental Opportunity Share Analysis, by Enterprise Size
Figure 149: Italy Incremental Opportunity Share Analysis, by Industry
Figure 150: France Incremental Opportunity Share Analysis, by Component
Figure 151 : France Incremental Opportunity Share Analysis, by Enterprise Size
Figure 152: France Incremental Opportunity Share Analysis, by Industry
Figure 153: U.K. Incremental Opportunity Share Analysis, by Component
Figure 154: U.K. Incremental Opportunity Share Analysis, by Enterprise Size
Figure 155: U.K. Incremental Opportunity Share Analysis, by Industry
Figure 156: Spain Incremental Opportunity Share Analysis, by Component
Figure 157 : Spain Incremental Opportunity Share Analysis, by Enterprise Size
Figure 158: Spain Incremental Opportunity Share Analysis, by Industry
Figure 159: BENELUX Incremental Opportunity Share Analysis, by Component
Figure 160 : BENELUX Incremental Opportunity Share Analysis, by Enterprise Size
Figure 161: BENELUX Incremental Opportunity Share Analysis, by Industry
Figure 162: Russia Incremental Opportunity Share Analysis, by Component
Figure 163 : Russia Incremental Opportunity Share Analysis, by Enterprise Size
Figure 164: Russia Incremental Opportunity Share Analysis, by Industry
Figure 165: China Incremental Opportunity Share Analysis, by Component
Figure 166 : China Incremental Opportunity Share Analysis, by Enterprise Size
Figure 167: China Incremental Opportunity Share Analysis, by Industry
Figure 168: Japan Incremental Opportunity Share Analysis, by Component
Figure 169 : Japan Incremental Opportunity Share Analysis, by Enterprise Size
Figure 170: Japan Incremental Opportunity Share Analysis, by Industry
Figure 171: South Korea Incremental Opportunity Share Analysis, by Component
Figure 172 : South Korea Incremental Opportunity Share Analysis, by Enterprise Size
Figure 173: South Korea Incremental Opportunity Share Analysis, by Industry
Figure 174: India Incremental Opportunity Share Analysis, by Component
Figure 175 : India Incremental Opportunity Share Analysis, by Enterprise Size
Figure 176: India Incremental Opportunity Share Analysis, by Industry
Figure 177: ASEAN Incremental Opportunity Share Analysis, by Component
Figure 178 : ASEAN Incremental Opportunity Share Analysis, by Enterprise Size
Figure 179: ASEAN Incremental Opportunity Share Analysis, by Industry
Figure 180: Australia & New Zealand Incremental Opportunity Share Analysis, by Component
Figure 181 : Australia & New Zealand Incremental Opportunity Share Analysis, by Enterprise Size
Figure 182: Australia & New Zealand Incremental Opportunity Share Analysis, by Industry
Figure 183: GCC Countries Incremental Opportunity Share Analysis, by Component
Figure 184 : GCC Countries Incremental Opportunity Share Analysis, by Enterprise Size
Figure 185: GCC Countries Incremental Opportunity Share Analysis, by Industry
Figure 186: Turkey Incremental Opportunity Share Analysis, by Component
Figure 187 : Turkey Incremental Opportunity Share Analysis, by Enterprise Size
Figure 188: Turkey Incremental Opportunity Share Analysis, by Industry
Figure 189: South Africa Incremental Opportunity Share Analysis, by Component
Figure 190 : South Africa Incremental Opportunity Share Analysis, by Enterprise Size
Figure 191: South Africa Incremental Opportunity Share Analysis, by Industry
Need specific information?
Request CustomizationExplore Technology Insights
View Reports