The IoT Network Management Market is experiencing rapid expansion due to the increasing deployment of connected devices across industries, driving the need for efficient network monitoring and control. The growing adoption of IoT solutions in manufacturing, healthcare, logistics, and smart cities is leading to a surge in data generation, requiring scalable network management platforms to ensure seamless communication.
The market’s growth is further influenced by advancements in 5G connectivity, edge computing, and AI-driven automation, which enhance real-time decision-making and predictive maintenance capabilities. Enterprises are increasingly investing in network management systems to improve uptime, security, and device visibility while reducing operational costs.
The emphasis on interoperability and centralized control of heterogeneous networks has strengthened demand for intelligent management solutions As organizations shift toward digital transformation, the integration of IoT with analytics and cloud infrastructure continues to shape the future landscape of this market, offering new avenues for operational efficiency and innovation.
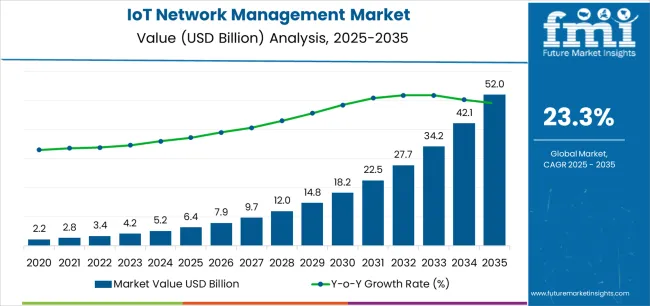
| Metric | Value |
|---|---|
| IoT Network Management Market Estimated Value in (2025 E) | USD 6.4 billion |
| IoT Network Management Market Forecast Value in (2035 F) | USD 52.0 billion |
| Forecast CAGR (2025 to 2035) | 23.3% |
The market is segmented by Solution, Enterprise Size, and Industry and region. By Solution, the market is divided into Platform and Services. In terms of Enterprise Size, the market is classified into Large Enterprises and Small And Mid-Sized Enterprises (SMEs). Based on Industry, the market is segmented into Manufacturing, IT & Telecom, BFSI, Healthcare, Transport & Logistics, Energy & Utilities, Retail, and Others. Regionally, the market is classified into North America, Latin America, Western Europe, Eastern Europe, Balkan & Baltic Countries, Russia & Belarus, Central Asia, East Asia, South Asia & Pacific, and the Middle East & Africa.
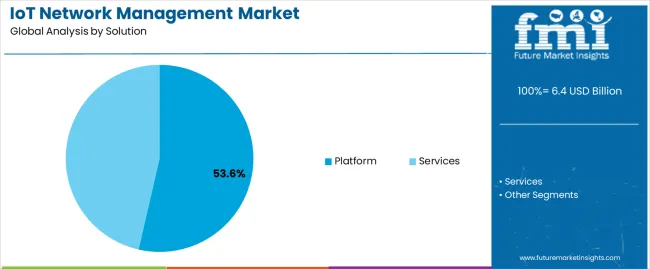
The platform solution segment is expected to hold 53.60% of the IoT Network Management Market revenue share in 2025, making it the leading solution type. The dominance of this segment is attributed to the growing reliance on centralized platforms that enable real-time device monitoring, performance optimization, and seamless integration across diverse IoT ecosystems.
The increasing complexity of IoT networks has driven the demand for platforms capable of managing large-scale deployments with automated workflows and enhanced data analytics capabilities. Enterprises prefer platform-based solutions for their flexibility, scalability, and ability to integrate security protocols that safeguard connected devices from potential cyber threats.
The rising need for predictive analytics, remote configuration, and multi-network orchestration further supports the growth of the platform segment Moreover, as businesses prioritize operational agility and data-driven insights, platform-based IoT management systems are expected to remain at the forefront of adoption.
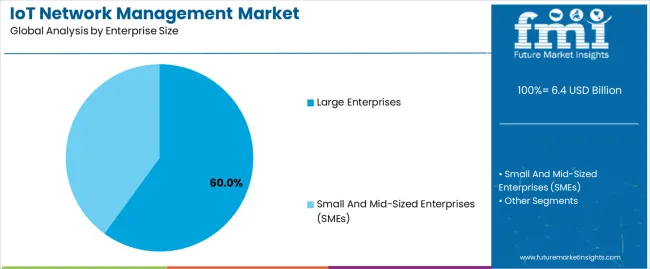
The large enterprises segment is projected to account for 60.00% of the IoT Network Management Market revenue share in 2025, making it the dominant enterprise size category. This segment’s growth is primarily driven by extensive IoT adoption across large-scale industries that require advanced network management systems to handle massive data volumes and complex device networks. Large enterprises are focusing on integrating IoT management solutions to improve operational visibility, ensure compliance, and enhance cybersecurity frameworks.
The financial capability of these organizations to invest in sophisticated platforms and customized solutions has further strengthened their adoption rate. Additionally, large enterprises often operate in multiple geographic regions, necessitating the use of centralized network management tools for real-time monitoring and coordination.
The ongoing digital transformation strategies and increasing dependence on cloud-enabled IoT infrastructure have reinforced the segment’s prominence As organizations continue to scale their IoT ecosystems, the demand for robust, secure, and efficient network management platforms within large enterprises is expected to grow consistently.
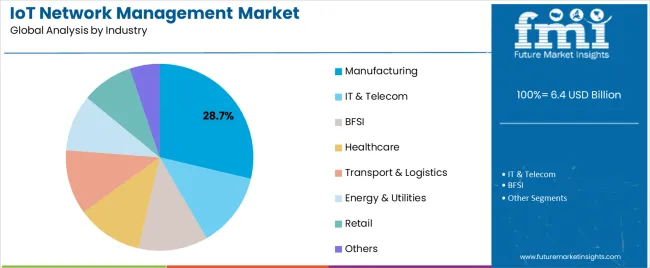
The manufacturing industry segment is expected to capture 28.70% of the IoT Network Management Market revenue share in 2025, positioning it as the leading industry segment. This dominance is influenced by the widespread adoption of IoT-enabled automation, predictive maintenance, and process optimization technologies within the manufacturing sector. Manufacturers are leveraging IoT network management platforms to enhance production efficiency, reduce downtime, and monitor equipment performance remotely.
The need for real-time visibility across connected machinery and supply chains has significantly accelerated platform adoption. Moreover, the integration of IoT with industrial control systems and smart sensors enables manufacturers to make data-driven decisions that improve productivity and quality control.
The growing emphasis on digital manufacturing and Industry 4.0 initiatives continues to drive demand for IoT network management solutions As global manufacturing ecosystems become more interconnected, the reliance on advanced network management systems to maintain efficiency, security, and operational accuracy is anticipated to expand further.
The below table presents the expected CAGR for the global IoT network management market over several semi-annual periods spanning from 2025 to 2035. This assessment outlines changes in the memory interconnect industry and identify revenue trends, offering key decision makers an understanding about market performance throughout the year.
H1 represents first half of the year from January to June, H2 spans from July to December, which is the second half. In the first half (H1) of the year from 2025 to 2035, the business is predicted to surge at a CAGR of 7.0%, followed by a slightly higher growth rate of 7.9% in the second half (H2) of the same decade.
| Particular | Value CAGR |
|---|---|
| H1 | 7.0% (2025 to 2035) |
| H2 | 7.9% (2025 to 2035) |
| H1 | 6.7% (2025 to 2035) |
| H2 | 8.1% (2025 to 2035) |
Moving into the subsequent period, from H1 2025 to H2 2035, the CAGR is projected to increase slightly to 6.7% in the first half and remain higher at 8.1% in the second half. In the first half (H1) the market witnessed a decrease of 30 BPS while in the second half (H2), the market witnessed an increase of 20 BPS.
Surge in Industrial IoT Devices Boosts Demand for Advanced Network Management Solutions
The fast growth of industrial IoT (IIoT) applications increasing need for advanced network management solutions. As industries adopt IoT technologies to improve their operations, handling these networks efficiently becomes crucial. IIoT involves involving machinery, sensors and equipment to collect and analyze data, which can recover production processes and operational efficiency.
As there is growing number of connected devices and the volume of data generated, traditional network management methods are no longer adequate. Companies need sophisticated tools to ensure smooth and reliable network performance.
According to industry estimates, the number of IIoT devices is predictable to reach over 6.4 billion by 2025, underlining the growing demand for effective network management solutions. This highlights the prominence of progressive IoT network management to grip complex industrial networks, preserve optimal performance and support real-time decision-making.
5G Technology is Enhancing the Capabilities of IoT Network Management to New Heights
The rollout of 5G technology is renovating the IoT network management industry by ominously boosting connectivity demands. With 5G, networks can handle much higher data speeds and more simultaneous connections than previous generations. This augmented capability enables the growth of smart devices and applications, making progressive IoT network management more critical than ever.
For instance, 5G can support up to 1 million devices per square kilometer, likened to 100,000 devices per square kilometer with 4G. This growth requires more cultured network management to certify smooth operation and efficiency.
As industries from healthcare to transportation integrate 5G, they make it essential robust IoT network management systems to handle the improved data flow and maintain performance. The demand for these systems is rising as industries seek to influence 5G’s proficiencies for smarter and more approachable network environments.
Smart Infrastructure Investments IS Creating New Business Avenues in IoT Network Management
Investing in smart infrastructure is a foremost growing source for IoT network management industries. As cities and industries build more smart infrastructure, such as intelligent transportation systems, smart grids and automated buildings, the demand for robust IoT network management solutions upsurges.
Smart infrastructure relies on a network of connected devices that essential constant monitoring and efficient management to safeguard smooth operations. For instance, smart traffic lights need real-time data to adjust traffic flow, while smart energy grids need precise management to poise supply and demand. As these projects grow, there’s a increasing need for IoT network solutions that can grip vast amounts of data and provide reliable connectivity.
This presents a significant prospect for companies to develop and offer advanced network management technologies. With global smart infrastructure spending expected to reach over USD 200 billion by 2025, the impending for growth in this industry is substantial.
Mitigating Data Security Risks is Essential to Protect Sensitive Information and Maintain Network Integrity Amidst Rapid Device Growth
Data security risks is creating abig hurdles in the industry, as more devices connect to networks, the potential for cyber threats rises, making robust security measures important. IoT networks often handle sensitive information, such as personal data and operational details, which can be directed by hackers.
For example, recent incidents have shown how exposures in connected devices can lead to data breaks and interruptions. Safeguarding data security requires constant updates and monitoring to guard against new threats. Companies must invest in progressive encryption methods, regular security audits and complete threat detection systems.
With the rising number of IoT devices expected to reach over 6.4 billion by 2025, according to industry estimations, addressing these security challenges is crucial for preserving trust and reliability in IoT networks.
The IoT network management market has shown steady growth from 2020 to 2025, ambitious by increasing adoption across various industries. The demand for IoT network management solutions has been increasing due to the need for real-time monitoring and effective eminence control. Developments in technology and stricter regulations have advance boosted the industry.
Looking forward from 2025 to 2035, the industry is likely to continue its skyward trend. The incorporation of artificial intelligence and machine learning will increase data analysis and predictive abilities, contributing to this development.
Additionally, augmented investment in industrial automation and the growth of regulatory frameworks are probable to drive further demand for IoT network management solutions. This continuing growth reflects a strong commitment to improving network efficiency and security across different sectors.
Tier 1 vendors have acquired substantial share of 50% to 55% in IoT in network management industry. Tier 1 vendor such as Cisco Systems, IBM, Microsoft, and Hewlett Packard Enterprise are known for extensive product portfolios, global reach and strong brand recognition. These vendors are leading the industry in innovation and have a presence across multiple regions and contributing a major portion of the market's total sales.
Tier 2 vendors hold a moderate market share around 15% to 20%. Vendors such as Oracle, SAP, Siemens, and Honeywell offer specialized IoT network management solutions and have a solid market presence. They focus on specific applications or industries, providing competitive alternatives to the dominant players.
Tier 3 vendors represent smaller market players with niche offerings or regional focus. Tier 3 typically serves specific markets or regions and have lower market concentration compared to Tier 1 and Tier 2 and it hold around 25% to 30%. Vendors such as Arista Networks, PTC, GE Digital, Qualcomm and others are contributing to the market for addressing unique needs and providing cost-effective solutions for targeted applications.
The section highlights the CAGRs of countries experiencing growth in the IoT Network Management market, along with the latest advancements contributing to overall market development. Based on current estimates China, Japan, India, United States and Germany are expected to see steady growth during the forecast period.
| Countries | CAGR from 2025 to 2035 |
|---|---|
| India | 18.2% |
| China | 17.3% |
| Germany | 16.8% |
| Japan | 14.8% |
| United States | 16.3% |
United States is undergoing fast growth in the IoT network management industry propelled by the extensive adoption of IoT across industries such as manufacturing and healthcare. In manufacturing, IoT is being used to recover operational efficiency, monitor equipment in real-time and reduce downtime, which has LED to an improved demand for advanced network management solutions.
Healthcare is also a major provider, as IoT devices are being used to monitor patients slightly, manage medical equipment and modernize hospital operations. The incorporation of IoT in these sectors has generated a need for robust network management to handle the vast amounts of data generated, safeguard security and continue seamless connectivity.
Companies like Cisco and IBM are leading the way by providing innovative IoT network management solutions personalized to these industries. As more USA industries embrace IoT the demand for operative network management is predictable to continue growing further increasing the industry growth.
China’s wide smart city projects and developments in industrial automation is powering the IoT in network management growth. The country’s government has been widely investing in smart city initiatives which is guiding to improve urban infrastructure, traffic management and public services over IoT technology.
This has LED to an enlarged demand for IoT network management solutions that can grip the huge data generated by connected devices in these smart cities. Also, China's focus on industrial automation is more boosting the industry. Factories and production lines are increasingly adopting IoT technologies to improve efficiency, monitor equipment in real-time and decrease operational costs.
Prominent companies in the country like Huawei and Alibaba are playing a vital role in this development and positioning advanced IoT network management platforms. With these continuing developments, China's IoT network management industry is set to undergo its rapid expansion in the coming years.
Germany's strong position on Industry 4.0 and smart manufacturing has significantly driven the growth in IoT network management. Industry 4.0 edges emphasis on incorporating advanced technologies like IoT, AI, and automation into manufacturing processes to make smart factories.
These smart factories trust on IoT networks for seamless communication between machines real-time monitoring and data analysis, making well-organized network management most important. Major companies, such as Siemens and Bosch are at the forefront of this renovation which are investing heavily in IoT solutions.
For example, Siemens has been emerging IoT platforms like MindSphere to enhance industrial automation and connectivity. As Germany endures to lead in smart manufacturing, the demand for robust IoT network management solutions will only increase. This development reflects Germany's commitment to preserving its position as a global spearhead in industrial innovation and efficiency, further solidifying its role in the global IoT network management industry.
The below section provides the category wise insights in the market with recent developments and future projections.
The platform segment dominates the industry due to important role in managing and integrating diverse IoT devices and systems. IoT platforms help as the support of IoT networks which allows seamless communication, data exchange and device management across various industries. They offer integrated control and monitoring which is vital for handling the complexity of large-scale IoT deployments.
Companies like Cisco and IBM have established advanced IoT platforms that deliver robust tools for data analytics, security, and device management, making them extremely attractive to businesses. These platforms streamline the deployment and operation of IoT networks, permitting companies to scale their IoT initiatives more efficiently.
With the rising number of connected devices and the growing need for efficient management solutions, the demand for IoT platforms remains to rise solidifying their leading position in the industry.
| Segment | Platform (Solution) |
|---|---|
| Value Share (2025) | 53.6% |
The manufacturing industry plays important role due to its necessity on advanced technologies to recover efficiency and productivity. IoT solutions are important for handling difficult manufacturing processes permitting real-time monitoring, predictive maintenance and automation. By integrating IoT technologies, manufacturers can recover operations, decrease downtime and improve product quality.
For example, IoT sensors can track technology performance and alert operators to prospective issues before they cause disruptions. This proficiency is vital in industries where even minor delays can lead to substantial losses.
The rising adoption of Industry 4.0 concepts, which emphasize smart factories and interconnected systems, has additionally fueled the demand for IoT network management in manufacturing. As a result, the sector remains a foremost contributor to the overall industry, sparkly its critical need for vigorous and effective network management solutions.
| Segment | Manufacturing (Industry) |
|---|---|
| Value Share (2025) | 28.7% |
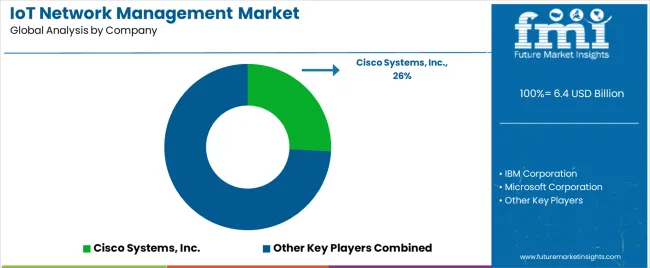
The IoT network management industry is highly competitive with major players endeavoring to enhance technology to boost competence and precision across industries. Key vendors are investing in new solutions to improve data analysis, expand their range of applications, and ensure better quality control.
This initiative for innovation is determining the industry and addressing the growing needs of various sectors, comprising manufacturing, logistics, and smart cities. By focusing on cutting-edge technologies and acclimatizing to developing industry requirements companies aim to lead the industry and meet the various demands of their customers effectively.
Industry Update
In terms of solution, the segment is divided into platform and services.
In terms of enterprise size, the industry is segregated into large enterprises and small and Mid-Sized Enterprises (SMEs).
In terms of industry, the industry is segregated into manufacturing, it & telecom, BFSI, healthcare, transport & logistics, energy & utilities, retail and others.
A regional analysis has been carried out in key countries of North America, Latin America, Asia Pacific, Middle East and Africa (MEA) and Europe.
The global iot network management market is estimated to be valued at USD 6.4 billion in 2025.
The market size for the iot network management market is projected to reach USD 52.0 billion by 2035.
The iot network management market is expected to grow at a 23.3% CAGR between 2025 and 2035.
The key product types in iot network management market are platform and services.
In terms of enterprise size, large enterprises segment to command 60.0% share in the iot network management market in 2025.


Our Research Products

The "Full Research Suite" delivers actionable market intel, deep dives on markets or technologies, so clients act faster, cut risk, and unlock growth.

The Leaderboard benchmarks and ranks top vendors, classifying them as Established Leaders, Leading Challengers, or Disruptors & Challengers.

Locates where complements amplify value and substitutes erode it, forecasting net impact by horizon

We deliver granular, decision-grade intel: market sizing, 5-year forecasts, pricing, adoption, usage, revenue, and operational KPIs—plus competitor tracking, regulation, and value chains—across 60 countries broadly.

Spot the shifts before they hit your P&L. We track inflection points, adoption curves, pricing moves, and ecosystem plays to show where demand is heading, why it is changing, and what to do next across high-growth markets and disruptive tech

Real-time reads of user behavior. We track shifting priorities, perceptions of today’s and next-gen services, and provider experience, then pace how fast tech moves from trial to adoption, blending buyer, consumer, and channel inputs with social signals (#WhySwitch, #UX).

Partner with our analyst team to build a custom report designed around your business priorities. From analysing market trends to assessing competitors or crafting bespoke datasets, we tailor insights to your needs.
Supplier Intelligence
Discovery & Profiling
Capacity & Footprint
Performance & Risk
Compliance & Governance
Commercial Readiness
Who Supplies Whom
Scorecards & Shortlists
Playbooks & Docs
Category Intelligence
Definition & Scope
Demand & Use Cases
Cost Drivers
Market Structure
Supply Chain Map
Trade & Policy
Operating Norms
Deliverables
Buyer Intelligence
Account Basics
Spend & Scope
Procurement Model
Vendor Requirements
Terms & Policies
Entry Strategy
Pain Points & Triggers
Outputs
Pricing Analysis
Benchmarks
Trends
Should-Cost
Indexation
Landed Cost
Commercial Terms
Deliverables
Brand Analysis
Positioning & Value Prop
Share & Presence
Customer Evidence
Go-to-Market
Digital & Reputation
Compliance & Trust
KPIs & Gaps
Outputs
Full Research Suite comprises of:
Market outlook & trends analysis
Interviews & case studies
Strategic recommendations
Vendor profiles & capabilities analysis
5-year forecasts
8 regions and 60+ country-level data splits
Market segment data splits
12 months of continuous data updates
DELIVERED AS:
PDF EXCEL ONLINE
Network Management System Market Insights - Growth & Forecast through 2034
Network Management Solutions Market
IoT Device Management Market Size and Share Forecast Outlook 2025 to 2035
IoT Device Management Platform Market Size and Share Forecast Outlook 2025 to 2035
IoT Connectivity Management Platform Market Size and Share Forecast Outlook 2025 to 2035
Active Network Management Market Analysis by Component, End Users, and Region Through 2025 to 2035
Radiotherapy Motion Management Market
Unified Network Management Market Size and Share Forecast Outlook 2025 to 2035
Network Security Policy Management Market Size and Share Forecast Outlook 2025 to 2035
Network Simulator Software Market Size and Share Forecast Outlook 2025 to 2035
IoT Spend by Logistics Market Size and Share Forecast Outlook 2025 to 2035
Network Connectivity Tester Market Size and Share Forecast Outlook 2025 to 2035
IoT Chip Market Size and Share Forecast Outlook 2025 to 2035
IoT Application Enablement Market Size and Share Forecast Outlook 2025 to 2035
IoT In Aviation Market Size and Share Forecast Outlook 2025 to 2035
IoT Processor Market Size and Share Forecast Outlook 2025 to 2035
IoT in Manufacturing Market Size and Share Forecast Outlook 2025 to 2035
IoT For Cold Chain Monitoring Market Size and Share Forecast Outlook 2025 to 2035
Network Analyzers Market Size and Share Forecast Outlook 2025 to 2035
Network as a Service (NaaS) Market Size and Share Forecast Outlook 2025 to 2035

Thank you!
You will receive an email from our Business Development Manager. Please be sure to check your SPAM/JUNK folder too.
Chat With
MaRIA