IoT Spend by Logistics Industry Market
Market Insights on IoT Spend by Logistics Industry covering sales outlook, demand forecast & up-to-date key trends
IoT Spend by Logistics Market by Component, Organization Size, Application & Region - Forecast 2022 - 2032
IoT Spend by Logistics Industry Market Outlook (2022-2032)
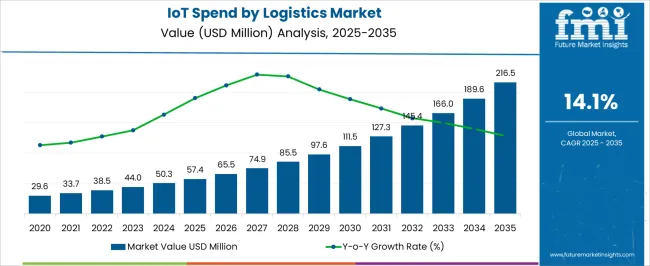
[330 Pages Report] The global e-commerce logistics market size was valued at US$ 35.2 Billion in 2021 and is projected to grow at a compound annual growth rate of 11.2% reaching US$ 114.7 Billion by 2032, up from US$ 39.6 Billion in 2022. From 2021 to 2022, the market registered a Y-o-Y growth of 12.5%.
Attributes |
Details |
IoT Spend by Logistics Market CAGR (2022-2032) |
11.2% |
IoT Spend by Logistics Market Size (2022) |
US$ 39.6 Billion |
IoT Spend by Logistics Market Size (2032) |
US$ 114.7 Billion |
With the explosion of digital technology, logistics businesses have improved performance and impact of IoT strategies across a range of applications. In the wake of technological advancement, and a host of new challenges, such as the sweeping COVID-19 outbreak and high customer demands, the logistics industry has undergone rapid change in the market.
Logistics will undergo an immeasurable revolution over the next decade as a result of the Internet of Things. This minimizes the price of device components, enhances the performance of wireless networks, and expands the capability to receive data through the network, thus creating new benefits for businesses.
“Smart cities, e-commerce businesses, the introduction of the internet and high adoption of sensors across verticals will further fuel the growth of the market in the future"
Companies in the logistics sector are experiencing unprecedented change due to digitization and changing customer expectations. As Consumers and businesses resorted to online channels for purchasing during the COVID-19 pandemic, lockdowns, and other government restrictions led logistics companies to invest heavily in the internet of things.
In addition to enhancing efficiency and collaboration, new technologies are also reshaping how business is conducted in ways that have only just begun to emerge. Startups and customers and suppliers from within the sector are also changing the industry.
Technology like IoT sensors will become increasingly vital to ensuring supply chain transparency and efficiency as demand increases. Increasing fleet efficiency and decreasing operation costs can be achieved through full visibility, which makes cargo moving safer and more efficient.
The recent slump in oil prices has improved profitability for logistics businesses, though the logistics sector remains susceptible to an increase in oil prices if the Organization of Petroleum Exporting Countries decides to restrict production in the future.
Let us know your requirement to get
100% FREE customization
What Are The Factors Driving The Growth Of The Iot Spend In The Logistics Market?
In order to help the market's growth, IoT-enabled connected devices are being adopted to track deliveries. Due to the increase in the number of online businesses on the market, delivery logistic companies have seen a rise in their demand. Increased internet penetration along with lower costs of sensors and controllers encourage the market to grow.
The market also experiences growth due to the advancement in information, communication, and technology adoption in SMEs and large-scale organizations.
IoT in logistics is experiencing rapid growth owing to the spread of wireless technology such as smartphones and wearable devices in the industry, which has propelled the market growth. Due to the advent of advanced technological solutions such as drones, robots, and autonomous vehicles, the demand for advanced wireless communication solutions has increased.
Furthermore, modern IoT services include high-speed data sharing and highly reliable and secure infrastructure on top of the new 5G wireless network technology. A huge number of interconnected devices and the need for fast communication also drive the need for IoT in transportation.
A growing amount of investments in digitization, technological advancements, and the use of contactless delivery methods are propelling the market for IoT spending by the logistics industry.
Is IoT Spending a Challenge for Logistics Businesses?
The Internet of Things is a revolutionary technology, and its applications and consequences remain unclear to date. With increasing security breaches in the market and a growing amount of data collection, logistics companies will further be hindered in their IoT spending growth. Such obstacles are creating considerable challenges for the IoT spend by the logistics market.
In the new marketplace, small businesses face a growing number of technical complexities and that is likely going to pose additional challenges. IoT systems are getting more expensive to install and maintain, which is further diminishing the market for logistics companies.
Significant logistics market players are nevertheless looking to create feasible solutions for customers by collaborating with IoT leading companies. As the sector evolves, new challenges will emerge as a result of the latest international market trends. Supply chain partners are frequent targets of cybercrime due to the critical nature of the products they move and their access to distributed systems.
The availability of warehousing space and declining inventory costs are stifling growth in this market, even though pollution levels are increasing. Additionally, consumer distrust of e-commerce services, as well as concerns over online safety, hinder the growth of the logistics market. Continual technological advancements and high implementation costs of these solutions will further hamper the market growth for IoT spend by logistic businesses.
Find your sweet spots for generating winning opportunities in this market.
Talk to AnalystComparative View of IoT Spend by Logistics Industry Market
IoT Spend by Logistics Industry Market:
Attributes |
IoT Spend by Logistics Industry Market |
CAGR (2022-2032) |
11.2% |
Market Value (2025) |
US$ 114.7 Billion |
Growth Factor |
An increased number of connected devices enabling the Internet of Things and a growing market for high-tech vehicles to grow the market. |
Opportunity |
Increasing supply capacities to meet customer needs both locally and globally will result in massive business opportunities for companies in the coming years, along with promising industrialization prospects in developing economies. |
Key Trends |
Aimed at capturing the IoT global market, digitization in the cargo logistics industry is one of the key trends being observed in the market |
IoT in Retail Market:
Attributes |
IoT in Retail Market |
CAGR (2022-2032) |
21.2% |
Market Value (2025) |
US$ 38.7 Billion |
Growth Factor |
IoT hardware such as RFID chips, sensors and chipsets will become more affordable, which will drive market growth for retail businesses in the market |
Opportunity |
With the use of IoT as a component of both retail management and warehouse technology, shrinkage and inventory tracking will be reduced and warehouse automation will provide multiple benefits. |
Key Trends |
The use of smart shelves will further assist retailers in increasing their revenue growth |
Connected Logistics Market:
Attributes |
Connected Logistics Market |
CAGR (2022-2032) |
31% |
Market Value (2025) |
US$ 42.1 Billion |
Growth Factor |
By using connected logistics, businesses can plan large orders in advance, this is a further growing market for connected logistics market |
Opportunity |
A competitive edge is constantly sought by companies doing international business. Incorporating IoT into their daily operation can certainly help these organizations gain the market dominance they strive for |
Key Trends |
The use of RFID chips and IoT devices in carriers, shipping containers and individual products can provide organizations with a great deal of information during shipping and transportation. All stakeholders have access to the precise locations and conditions of the shipments by using the data generated by these devices. |
Global IoT developments continue to improve, and the logistics market is expected to experience significant growth during the forecast period. As a result of cloud computing, platform solutions are becoming more accessible, which makes it more feasible to use creative business models such as virtual freight forwarding.
As well as being customizable and scalable, it can also provide standardization and harmonization of business processes throughout the organization.
By utilizing robotics and automation in delivery and warehousing, the amount of human labor will be reduced, and the delivery costs will be reduced, which will provide greater exposure to the market. Moreover, IoT in logistics will continue to grow in popularity among global businesses due to technological advancements, government initiatives, and business management solutions.
As a result of the use of supply chains, companies will see significant savings on infrastructure costs and will be able to take advantage of the easier adoption of autonomous solutions in the near future. New business models have been developed through platform technology, often by start-ups seeking to enter the logistics market. New entrants might end up being industry suppliers and customers.
Companies that offer CEP services will focus on customer expectations as networks become more fully shared. Increasingly, data analytics and other data-driven tools are being utilized to increase logistical efficiency. As part of their overall business strategy, many logistics companies are using IoT as a way to accelerate growth in the market.
What Are The Potential Benefits Of Iot Solutions For The Logistics Market On Hardware Component Markets?
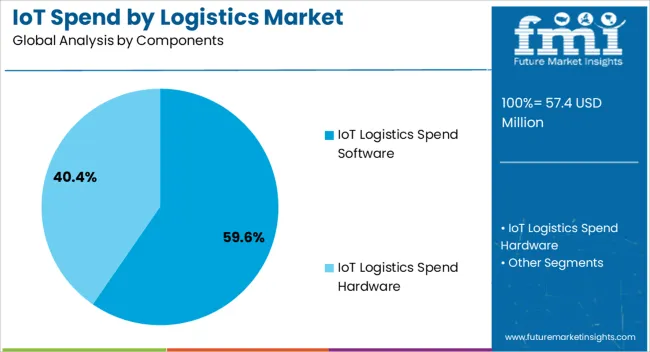
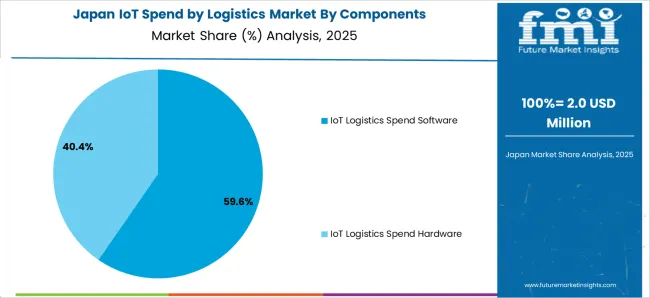
Based on the component the market is segmented into software and hardware. According to the forecast, the hardware component market will reach a value of US$ 41.3 Billion within the forecast period, with a compound annual growth rate of 11% during the forecast period.
Growing demand for tracking systems for speed and packet delivery has generated market demand for hardware components, such as sensors and trackers, in the IoT spent logistics market.
Hardware devices such as these provide real-time information from various devices and sensors that are subsequently incorporated into decision-making. As one of the cornerstones of modern supply chain management, industrial IoT has the potential to improve the efficiency of operations and streamline the overall supply chain.
Sensors are the most important hardware components used along with machines in various industries verticals and are projected to dominate the industrial internet of things (IoT) market segment in 2022. Moreover, the demand for sensor integration with industrial machinery equipment to make it IoT-compliant is increasing rapidly and will continue to do so.

An unified Market Research Subscription Platform, built for today’s disparate research needs.
Which Organization Size is Stimulating IoT Spend in Logistics?
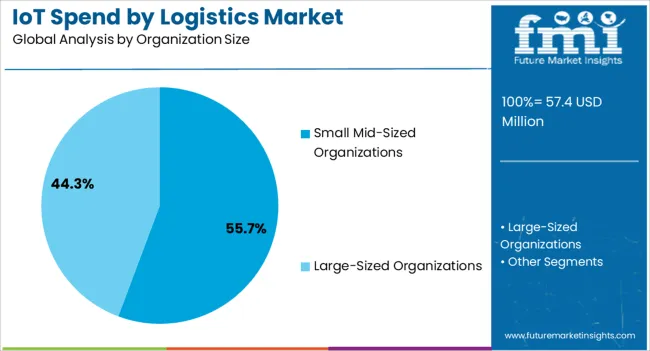
Depending on the size of the organization, the market for IoT spend within the logistics industry is segmented into SMEs and large organizations. It is estimated that during the forecast period, large-sized organizations will stimulate market value growth of 11.1% CAGR.
A growing expansion of logistics businesses and high investments in well-equipped devices have significantly boosted market demand for IoT spend by large organizations. Due to the greater affordability of IoT solutions for large organizations as compared with small and medium-sized enterprises (SMEs), IoT penetration is much higher in logistics applications.
With the increasing popularity and demand of e-commerce and the adoption of more efficient robotic devices, investments in autonomous vehicles are also expected to further boost market demand in large organizations with a large customer base.
Growing investments in the market and a large customer base will subsequently promote market growth for IoT spend by logistics in the market. The formation of new partnerships, collaborations, and investments in various small and medium-sized businesses in the market is essential to boosting market demand for large-sized markets.
IoT Spend by Logistics Industry Regional Outlook
What factors affect the growth of IoT spending in the logistics industry across different regions?
Asia-Pacific is expected to grow at the fastest rate during the forecast period as the market for cloud-based IoT technologies grows. Over the forecast period, APAC is expected to grow at the fastest pace in the IoT in the logistics market. In developing economies, such as India and China, consumer behavior may be changing due to urbanization and rising income levels.
India is expected to grow at a market value of US$ 7.7 Billion with a CAGR of 13% during the forecast period. Furthermore, China accounts for 12.7% of revenue growth in the region. The proliferation of retail and logistics companies in many developing nations, along with the advancement of technology, has created a demand for IoT spend the logistics industry.
The Japanese economy is expected to grow at a CAGR of 12.2% over the forecast period. With the increasing demand for cost-efficient and energy-efficient solutions in the market having an impact on reducing operational expenses, the market in this region is expected to continue to grow.
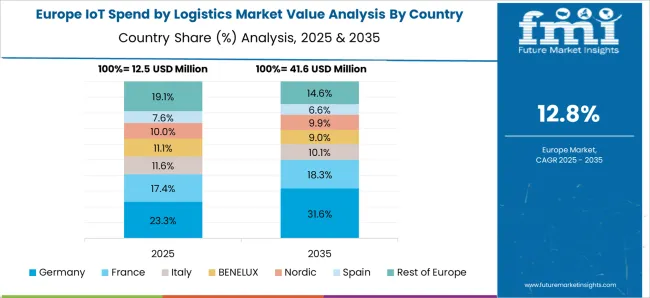
During the forecast period, the IoT spend logistics industry market in the U.K is expected to grow at a compound annual growth rate of 12.1%. The ever-growing need for expansion of warehouses as well as the global presence of logistics firms in the region will drive the market for IoT in the logistics industry. IoT, which is widely used in logistics businesses currently, is gaining market traction due to increasing investments for the advancement of IoT technologies.
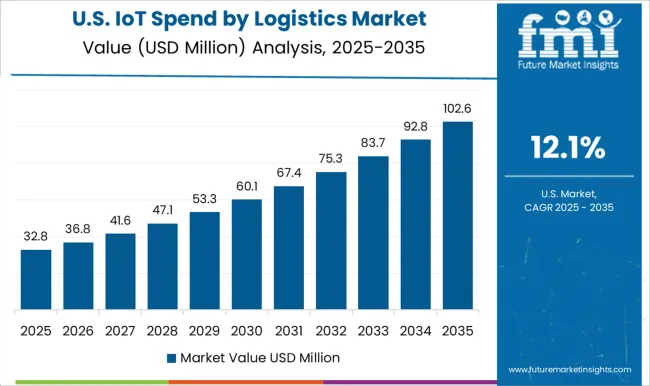
Over the forecast period, North America is expected to account for the largest revenue share due to numerous economically and technologically developed countries, including the U.S. and Canada. By 2032, the U.S. industry is forecast to contribute 11.1% of the total revenue share, mainly as a result of a rise in IoT solutions, the use of the internet, and the large number of companies operating in this industry.
A significant part of the growth of the domain in the region has been due to the rapid digital transformation taking place in the region. Recent years have seen a tremendous amount of digital transformation in the region, which has been a major factor in the market's growth.
Due to the high penetration of the internet, and in particular the 5G network, and to the growth of e-commerce, new companies are entering the logistics industry's IoT landscape.
What Is The Level Of Competition For Iot Spend By Logistics Industry In The Market?
In order to increase revenue and market share, manufacturers can increase production and respond to consumer demands by forming strategic partnerships. End-users will benefit from new technologies when new products and technologies are introduced. A strategic partnership can increase the capacity of the organization.
Recent Developments in the IoT Spend by Logistics Industry Market
- In May 2021, Amazon expanded its logistics integration, intending to reshape the future of the industry. According to the company, it plans to invest an additional 80% of its capital in logistics-related operations, including investments for its fleets of vans, pilots, and trucks, as well as for its warehouses, with the aim of becoming its own end-to-end logistics operator, which could turn out to be an enormous coup for both private courier companies and national mail services across a number of countries.
- In February 2022, a demonstration of ultra-low latency and time-synchronized networking for an autonomous mobile robot (AMR), and positioning an assisted guided vehicle (AGV) is being provided at Bosch Salzgitter, Germany as part of Qualcomm Technologies and Bosch Rexroth's full-fledged collaboration on 5G research and development.
- In March 2022, Through, a collaborative effort between industry and university researchers, Cisco and Queensland University of Technology are partnering up to drive development in the retail and logistics sectors. A research program in the retail, supply chain, consumer behavior and engagement, data privacy, and cyber security will be developed with $900,000 over three years by a newly established Chair in Trusted Retail and Logistics Innovation. In July, Innovation Central Brisbane will be fully operational on campus at Queensland University of Technology (QUT).
- In April 2022, Amazon.com Inc. will invest $1 Billion into companies developing technologies for logistics, supply chain management, and safety as the retailer looks for ways to enhance its core business. Amazon planned to launch the Amazon Industrial Innovation Fund, a venture investment program that aims to support the development of technology that increases e-commerce delivery speeds and improves the experience of warehouse and logistics workers. Additionally, Amazon did not indicate a timeline for the program or how many companies it intended to invest in.
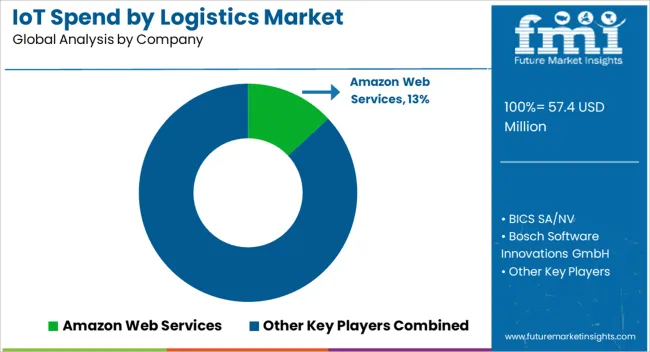
- Bosch and Amazon Web Services (AWS) plan to collaborate in the transportation and logistics sector in April 2022 to improve efficiency and sustainability. Through Amazon Web Services, logistics companies and freight forwarders around the world will have instant access to digital services. From monitoring goods flows to processing orders, the company will support topics ranging from fleet utilization to fleet utilization of commercial vehicles. The two companies have signed a strategic partnership to that end.
Key Players
- Amazon Web Services
- BICS SA/NV
- Bosch Software Innovations GmbH
- Cisco Systems Inc.
- Honeywell International
- Intel Corporation
- IBM Corporation
- Kaa IoT Technologies, LLC.
- NEC Corporation
- Novire Technologies
- Octonion SA
- Oracle Corporation
- PTC Inc.
- Rockwell Automation, Inc.
- SAP SE
Key Segments Covered in the IoT Spend by Logistics Industry Report
IoT Spend by Logistics Industry by Components:
- IoT Logistics Spend Software
- Traffic and Fleet Management
- Resource and Energy Monitoring
- Safety and Security
- Others (Operations Management, Data Analysis)
- IoT Logistics Spend Hardware
- RFID Tags
- Beacon
- Screen/Display
- Others (Camera, Networking Hardware)
IoT Spend by Logistics Industry by Organization Size:
- IoT Logistics Spend for Small-Mid-sized Organizations
- IoT Logistics Spend for Large-sized Organizations
IoT Spend by Logistics Industry by Application:
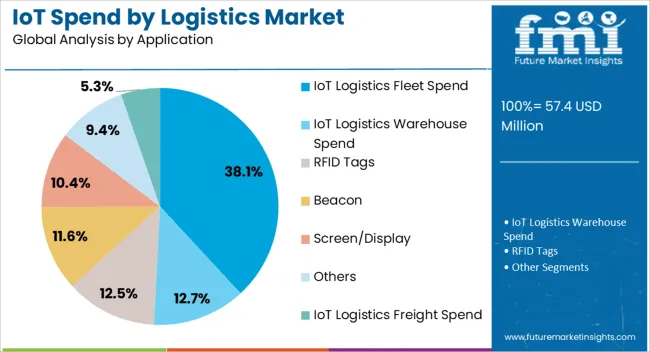
- IoT Logistics Fleet Spend
- RFID Tags
- Beacon
- Screen/Display
- Others (Camera, Networking Hardware)
- IoT Logistics Warehouse Spend
- RFID Tags
- Beacon
- Screen/Display
- Others (Camera, Networking Hardware)
- IoT Logistics Freight Spend
- RFID Tags
- Beacon
- Screen/Display
- Others (Camera, Networking Hardware)
- IoT Logistics Yard/Dock Spend
- RFID Tags
- Beacon
- Screen/Display
- Others (Camera, Networking Hardware)
IoT Spend by Logistics Industry by Region:
- North America IoT Spend by Logistics Industry Market
- Europe IoT Spend by Logistics Industry Market
- Asia Pacific IoT Spend by Logistics Industry Market
- Middle East and Africa IoT Spend by Logistics Industry Market
- South America IoT Spend by Logistics Industry Market
Frequently Asked Questions
The IoT spend by logistics industry market is expected to grow at a CAGR of 11.2% over the forecast period
The global market for IoT spend by logistics industry was valued at US$ 35.2 Billion as of 2021
Large organizations are projected to have the highest market with a CAGR of 11.1% during the forecast period
India leads the global IoT spend by logistics industry market with a CAGR of 13% during the forecast period
The market for IoT spend by logistics industry is expected to grow by nearly US$ 114.7 Billion by 2032
The hardware component is expected to drive the market for IoT spend by logistics industry over the next five years
IoT spend by the logistics industry experienced an absolute dollar opportunity worth US$ 75.1 Billion from 2016-2021
1. Preface
1.1. Market Scope
1.2. Market Segmentation
1.3. Key Research Objectives
2. Assumptions and Research Methodology
2.1. Market Taxonomy - Segment Definitions
2.2. Research Methodology
2.2.1. List of Primary and Secondary Sources
2.3. Key Assumptions for Data Modelling
3. Executive Summary : Global Internet of Things (IoT) Spend by Logistics Industry Analysis
4. Market Overview
4.1. Introduction
4.2. Global Market – Macro Economic Factors Overview
4.2.1. World GDP Indicator – For Top 20 Economies
4.2.2. Global ICT Spending (US$ Mn), 2012, 2018, 2026
4.2.3. Key Regional Socio-Political-Technological Developments and Their Impact Considerations
4.3. Technology/Product Roadmap
4.4. Market Factor Analysis
4.4.1. Porter’s Five Forces Analysis
4.4.2. PESTEL Analysis
4.4.3. Eco System Analysis
4.4.4. Market Dynamics (Growth Influencers)
4.4.4.1. Drivers
4.4.4.1.1. Supply Side
4.4.4.1.2. Demand Side
4.4.4.2. Restraints
4.4.4.3. Opportunities
4.4.4.4. Impact Analysis of Drivers & Restraints
4.5. Regulations and Policies – By Region
4.6. Global Internet of Things (IoT) Spend by Logistics Industry Analysis and Forecast, 2016 - 2032
4.6.1. Market Revenue Analysis (US$ Mn)
4.6.1.1. Historic Growth Trends, 2016-2026
4.6.1.2. Forecast Trends, 2016-2032
4.6.2. Absolute Incremental Opportunity Analysis (2016-2032)
4.7. Global Internet of Things (IoT) Spend by Logistics Industry Analysis Attractiveness Analysis
4.7.1. By Software
4.7.2. By Hardware
4.7.3. By Organization Size
4.7.4. By Application
4.7.5. By Region
4.8. Market Outlook
4.9. Global Internet of Things (IoT) Spend by Logistics Industry Analysis Competition Analysis, By Manufacturers
4.9.1. Global Internet of Things (IoT) Spend by Logistics Industry Analysis Production Revenue Share Analysis, By Manufacturers (2022-2032)
4.10. Pricing Analysis
4.11. Competitive Scenario and Trends
4.11.1. Internet of Things (IoT) Spend by Logistics Industry Concentration Rate
4.11.1.1. List of New Entrants
4.11.2. Mergers & Acquisitions, Expansions
5. Global Internet of Things (IoT) Spend by Logistics Industry Analysis and Forecast, By Software
5.1. Overview and Definitions
5.2. Key Segment Analysis
5.3. Internet of Things (IoT) Spend by Logistics Industry Size (US$ Mn ) Forecast, By Software, 2016 - 2032
5.3.1. Traffic and Fleet Management
5.3.2. Resource and Energy Monitoring
5.3.3. Safety and Security
5.3.4. Others (Operations Management, Data Analysis)
6. Global Internet of Things (IoT) Spend by Logistics Industry Analysis and Forecast, By Hardware
6.1. Overview and Definitions
6.2. Key Segment Analysis
6.3. Internet of Things (IoT) Spend by Logistics Industry Size (US$ Mn ) Forecast, By Hardware, 2016 - 2032
6.3.1. RFID Tags
6.3.2. Beacon
6.3.3. Screen/Display
6.3.4. Others (Camera, Networking Hardware)
7. Global Internet of Things (IoT) Spend by Logistics Industry Analysis and Forecast, By Organization Size
7.1. Overview and Definitions
7.2. Key Segment Analysis
7.3. Internet of Things (IoT) Spend by Logistics Industry Size (US$ Mn ) Forecast, By Organization Size, 2016 - 2032
7.3.1. Small-Mid-sized Organization
7.3.2. Large sized Organization
8. Global Internet of Things (IoT) Spend by Logistics Industry Analysis and Forecast, By Application
8.1. Overview and Definitions
8.2. Key Segment Analysis
8.3. Internet of Things (IoT) Spend by Logistics Industry Size (US$ Mn ) Forecast, By Application, 2016 - 2032
8.3.1. Fleet
8.3.2. Warehouse
8.3.3. Freight
8.3.4. Yard/Dock
9. Global Internet of Things (IoT) Spend by Logistics Industry Analysis and Forecast, By Application By Hardware
9.1. Internet of Things (IoT) Spend by Logistics Industry Size (US$ Mn ) Forecast, By Application By Hardware, 2016 - 2032
9.1.1. Fleet
9.1.1.1. RFID Tags
9.1.1.2. Beacon
9.1.1.3. Screen/Display
9.1.1.4. Others (Camera, Networking Hardware)
9.1.2. Warehouse
9.1.2.1. RFID Tags
9.1.2.2. Beacon
9.1.2.3. Screen/Display
9.1.2.4. Others (Camera, Networking Hardware)
9.1.3. Freight
9.1.3.1. RFID Tags
9.1.3.2. Beacon
9.1.3.3. Screen/Display
9.1.3.4. Others (Camera, Networking Hardware)
9.1.4. Yard/Dock
9.1.4.1. RFID Tags
9.1.4.2. Beacon
9.1.4.3. Screen/Display
9.1.4.4. Others (Camera, Networking Hardware)
10. Global Internet of Things (IoT) Spend by Logistics Industry Analysis and Forecast, by Region
10.1. Overview
10.2. Key Segment Analysis
10.3. Internet of Things (IoT) Spend by Logistics Industry Size (US$ Mn ) Forecast, by Region, 2016 - 2032
10.3.1. North America
10.3.2. Europe
10.3.3. Asia Pacific
10.3.4. Middle East & Africa
10.3.5. South America
11. North America Internet of Things (IoT) Spend by Logistics Industry Analysis and Forecast
11.1. Key Findings
11.2. Market Dynamics
11.2.1. Impact Analysis of Drivers & Restraints
11.3. Internet of Things (IoT) Spend by Logistics Industry Size (US$ Mn ) Forecast, By Software, 2016 - 2032
11.3.1. Traffic and Fleet Management
11.3.2. Resource and Energy Monitoring
11.3.3. Safety and Security
11.3.4. Others (Operations Management, Data Analysis)
11.4. Internet of Things (IoT) Spend by Logistics Industry Size (US$ Mn ) Forecast, By Hardware, 2016 - 2032
11.4.1. RFID Tags
11.4.2. Beacon
11.4.3. Screen/Display
11.4.4. Others (Camera, Networking Hardware)
11.5. Internet of Things (IoT) Spend by Logistics Industry Size (US$ Mn ) Forecast, By Organization Size, 2016 - 2032
11.5.1. Small-Mid-sized Organization
11.5.2. Large sized Organization
11.6. Internet of Things (IoT) Spend by Logistics Industry Size (US$ Mn ) Forecast, By Application 2016 - 2032
11.6.1. Fleet
11.6.2. Warehouse
11.6.3. Freight
11.6.4. Yard/Dock
11.7. Internet of Things (IoT) Spend by Logistics Industry Size (US$ Mn ) Forecast, By Application By Hardware, 2016 - 2032
11.7.1. Fleet
11.7.1.1. RFID Tags
11.7.1.2. Beacon
11.7.1.3. Screen/Display
11.7.1.4. Others (Camera, Networking Hardware)
11.7.2. Warehouse
11.7.2.1. RFID Tags
11.7.2.2. Beacon
11.7.2.3. Screen/Display
11.7.2.4. Others (Camera, Networking Hardware)
11.7.3. Freight
11.7.3.1. RFID Tags
11.7.3.2. Beacon
11.7.3.3. Screen/Display
11.7.3.4. Others (Camera, Networking Hardware)
11.7.4. Yard/Dock
11.7.4.1. RFID Tags
11.7.4.2. Beacon
11.7.4.3. Screen/Display
11.7.4.4. Others (Camera, Networking Hardware)
11.8. Internet of Things (IoT) Spend by Logistics Industry Size (US$ Mn ) Forecast, By Country and Region, 2016 - 2032
11.8.1. The U.S.
11.8.2. Canada
11.8.3. Rest of North America
11.9. Market Attractiveness Analysis
11.9.1. By Software
11.9.2. By Hardware
11.9.3. By Organization Size
11.9.4. By Application
11.9.5. By Country
12. Europe Internet of Things (IoT) Spend by Logistics Industry Analysis and Forecast
12.1. Key Findings
12.2. Market Dynamics
12.2.1. Impact Analysis of Drivers & Restraints
12.3. Internet of Things (IoT) Spend by Logistics Industry Size (US$ Mn ) Forecast, By Software, 2016 - 2032
12.3.1. Traffic and Fleet Management
12.3.2. Resource and Energy Monitoring
12.3.3. Safety and Security
12.3.4. Others (Operations Management, Data Analysis)
12.4. Internet of Things (IoT) Spend by Logistics Industry Size (US$ Mn ) Forecast, By Hardware, 2016 - 2032
12.4.1. RFID Tags
12.4.2. Beacon
12.4.3. Screen/Display
12.4.4. Others (Camera, Networking Hardware)
12.5. Internet of Things (IoT) Spend by Logistics Industry Size (US$ Mn ) Forecast, By Organization Size, 2016 - 2032
12.5.1. Small-Mid-sized Organization
12.5.2. Large sized Organization
12.6. Internet of Things (IoT) Spend by Logistics Industry Size (US$ Mn ) Forecast, By Application 2016 - 2032
12.6.1. Fleet
12.6.2. Warehouse
12.6.3. Freight
12.6.4. Yard/Dock
12.7. Internet of Things (IoT) Spend by Logistics Industry Size (US$ Mn ) Forecast, By Application By Hardware, 2016 - 2032
12.7.1. Fleet
12.7.1.1. RFID Tags
12.7.1.2. Beacon
12.7.1.3. Screen/Display
12.7.1.4. Others (Camera, Networking Hardware)
12.7.2. Warehouse
12.7.2.1. RFID Tags
12.7.2.2. Beacon
12.7.2.3. Screen/Display
12.7.2.4. Others (Camera, Networking Hardware)
12.7.3. Freight
12.7.3.1. RFID Tags
12.7.3.2. Beacon
12.7.3.3. Screen/Display
12.7.3.4. Others (Camera, Networking Hardware)
12.7.4. Yard/Dock
12.7.4.1. RFID Tags
12.7.4.2. Beacon
12.7.4.3. Screen/Display
12.7.4.4. Others (Camera, Networking Hardware)
12.8. Internet of Things (IoT) Spend by Logistics Industry Size (US$ Mn ) Forecast, By Country and Region, 2016 - 2032
12.8.1. Germany
12.8.2. France
12.8.3. UK
12.8.4. Rest of Europe
12.9. Market Attractiveness Analysis
12.9.1. By Software
12.9.2. By Hardware
12.9.3. By Organization Size
12.9.4. By Application
12.9.5. By Country
13. Asia Pacific Internet of Things (IoT) Spend by Logistics Industry Analysis and Forecast
13.1. Key Findings
13.2. Market Dynamics
13.2.1. Impact Analysis of Drivers & Restraints
13.3. Internet of Things (IoT) Spend by Logistics Industry Size (US$ Mn ) Forecast, By Software, 2016 - 2032
13.3.1. Traffic and Fleet Management
13.3.2. Resource and Energy Monitoring
13.3.3. Safety and Security
13.3.4. Others (Operations Management, Data Analysis)
13.4. Internet of Things (IoT) Spend by Logistics Industry Size (US$ Mn ) Forecast, By Hardware, 2016 - 2032
13.4.1. RFID Tags
13.4.2. Beacon
13.4.3. Screen/Display
13.4.4. Others (Camera, Networking Hardware)
13.5. Internet of Things (IoT) Spend by Logistics Industry Size (US$ Mn ) Forecast, By Organization Size, 2016 - 2032
13.5.1. Small-Mid-sized Organization
13.5.2. Large sized Organization
13.6. Internet of Things (IoT) Spend by Logistics Industry Size (US$ Mn ) Forecast, By Application 2016 - 2032
13.6.1. Fleet
13.6.2. Warehouse
13.6.3. Freight
13.6.4. Yard/Dock
13.7. Internet of Things (IoT) Spend by Logistics Industry Size (US$ Mn ) Forecast, By Application By Hardware, 2016 - 2032
13.7.1. Fleet
13.7.1.1. RFID Tags
13.7.1.2. Beacon
13.7.1.3. Screen/Display
13.7.1.4. Others (Camera, Networking Hardware)
13.7.2. Warehouse
13.7.2.1. RFID Tags
13.7.2.2. Beacon
13.7.2.3. Screen/Display
13.7.2.4. Others (Camera, Networking Hardware)
13.7.3. Freight
13.7.3.1. RFID Tags
13.7.3.2. Beacon
13.7.3.3. Screen/Display
13.7.3.4. Others (Camera, Networking Hardware)
13.7.4. Yard/Dock
13.7.4.1. RFID Tags
13.7.4.2. Beacon
13.7.4.3. Screen/Display
13.7.4.4. Others (Camera, Networking Hardware)
13.8. Internet of Things (IoT) Spend by Logistics Industry Size (US$ Mn ) Forecast, By Country and Region, 2016 - 2032
13.8.1. China
13.8.2. Japan
13.8.3. India
13.8.4. Rest of Asia Pacific
13.9. Market Attractiveness Analysis
13.9.1. By Software
13.9.2. By Hardware
13.9.3. By Organization Size
13.9.4. By Application
13.9.5. By Country
14. Middle East & Africa (MEA) Internet of Things (IoT) Spend by Logistics Industry Analysis and Forecast
14.1. Key Findings
14.2. Market Dynamics
14.2.1. Impact Analysis of Drivers & Restraints
14.3. Internet of Things (IoT) Spend by Logistics Industry Size (US$ Mn ) Forecast, By Software, 2016 - 2032
14.3.1. Traffic and Fleet Management
14.3.2. Resource and Energy Monitoring
14.3.3. Safety and Security
14.3.4. Others (Operations Management, Data Analysis)
14.4. Internet of Things (IoT) Spend by Logistics Industry Size (US$ Mn ) Forecast, By Hardware, 2016 - 2032
14.4.1. RFID Tags
14.4.2. Beacon
14.4.3. Screen/Display
14.4.4. Others (Camera, Networking Hardware)
14.5. Internet of Things (IoT) Spend by Logistics Industry Size (US$ Mn ) Forecast, By Organization Size, 2016 - 2032
14.5.1. Small-Mid-sized Organization
14.5.2. Large sized Organization
14.6. Internet of Things (IoT) Spend by Logistics Industry Size (US$ Mn ) Forecast, By Application 2016 - 2032
14.6.1. Fleet
14.6.2. Warehouse
14.6.3. Freight
14.6.4. Yard/Dock
14.7. Internet of Things (IoT) Spend by Logistics Industry Size (US$ Mn ) Forecast, By Application By Hardware, 2016 - 2032
14.7.1. Fleet
14.7.1.1. RFID Tags
14.7.1.2. Beacon
14.7.1.3. Screen/Display
14.7.1.4. Others (Camera, Networking Hardware)
14.7.2. Warehouse
14.7.2.1. RFID Tags
14.7.2.2. Beacon
14.7.2.3. Screen/Display
14.7.2.4. Others (Camera, Networking Hardware)
14.7.3. Freight
14.7.3.1. RFID Tags
14.7.3.2. Beacon
14.7.3.3. Screen/Display
14.7.3.4. Others (Camera, Networking Hardware)
14.7.4. Yard/Dock
14.7.4.1. RFID Tags
14.7.4.2. Beacon
14.7.4.3. Screen/Display
14.7.4.4. Others (Camera, Networking Hardware)
14.8. Internet of Things (IoT) Spend by Logistics Industry Size (US$ Mn ) Forecast, By Country and Region, 2016 - 2032
14.8.1. GCC
14.8.2. South Africa
14.8.3. Rest of MEA
14.9. Market Attractiveness Analysis
14.9.1. By Software
14.9.2. By Hardware
14.9.3. By Organization Size
14.9.4. By Application
14.9.5. By Country
15. South America Internet of Things (IoT) Spend by Logistics Industry Analysis and Forecast
15.1. Key Findings
15.2. Market Dynamics
15.2.1. Impact Analysis of Drivers & Restraints
15.3. Internet of Things (IoT) Spend by Logistics Industry Size (US$ Mn ) Forecast, By Software, 2016 - 2032
15.3.1. Traffic and Fleet Management
15.3.2. Resource and Energy Monitoring
15.3.3. Safety and Security
15.3.4. Others (Operations Management, Data Analysis)
15.4. Internet of Things (IoT) Spend by Logistics Industry Size (US$ Mn ) Forecast, By Hardware, 2016 - 2032
15.4.1. RFID Tags
15.4.2. Beacon
15.4.3. Screen/Display
15.4.4. Others (Camera, Networking Hardware)
15.5. Internet of Things (IoT) Spend by Logistics Industry Size (US$ Mn ) Forecast, By Organization Size, 2016 - 2032
15.5.1. Small-Mid-sized Organization
15.5.2. Large sized Organization
15.6. Internet of Things (IoT) Spend by Logistics Industry Size (US$ Mn ) Forecast, By Application 2016 - 2032
15.6.1. Fleet
15.6.2. Warehouse
15.6.3. Freight
15.6.4. Yard/Dock
15.7. Internet of Things (IoT) Spend by Logistics Industry Size (US$ Mn ) Forecast, By Application By Hardware, 2016 - 2032
15.7.1. Fleet
15.7.1.1. RFID Tags
15.7.1.2. Beacon
15.7.1.3. Screen/Display
15.7.1.4. Others (Camera, Networking Hardware)
15.7.2. Warehouse
15.7.2.1. RFID Tags
15.7.2.2. Beacon
15.7.2.3. Screen/Display
15.7.2.4. Others (Camera, Networking Hardware)
15.7.3. Freight
15.7.3.1. RFID Tags
15.7.3.2. Beacon
15.7.3.3. Screen/Display
15.7.3.4. Others (Camera, Networking Hardware)
15.7.4. Yard/Dock
15.7.4.1. RFID Tags
15.7.4.2. Beacon
15.7.4.3. Screen/Display
15.7.4.4. Others (Camera, Networking Hardware)
15.8. Internet of Things (IoT) Spend by Logistics Industry Size (US$ Mn ) Forecast, By Country and Region, 2016 - 2032
15.8.1. Brazil
15.8.2. Rest of South America
15.9. Market Attractiveness Analysis
15.9.1. By Software
15.9.2. By Hardware
15.9.3. By Organization Size
15.9.4. By Application
15.9.5. By Country
16. Company Profiles
16.1. Amazon Web Services
16.1.1. Company Overview
16.1.2. Company Revenue
16.1.3. Geographical Presence
16.1.4. Key Developments
16.2. BICS SA/NV
16.2.1. Company Overview
16.2.2. Company Revenue
16.2.3. Geographical Presence
16.2.4. Key Developments
16.3. Bosch Software Innovations GmbH
16.3.1. Company Overview
16.3.2. Company Revenue
16.3.3. Geographical Presence
16.3.4. Key Developments
16.4. Cisco Systems Inc.
16.4.1. Company Overview
16.4.2. Company Revenue
16.4.3. Geographical Presence
16.4.4. Key Developments
16.5. Honeywell International
16.5.1. Company Overview
16.5.2. Company Revenue
16.5.3. Geographical Presence
16.5.4. Key Developments
16.6. Intel Corporation
16.6.1. Company Overview
16.6.2. Company Revenue
16.6.3. Geographical Presence
16.6.4. Key Developments
16.7. International Business Machine (IBM) Corporation
16.7.1. Company Overview
16.7.2. Company Revenue
16.7.3. Geographical Presence
16.7.4. Key Developments
16.8. Kaa IoT Technologies, LLC.
16.8.1. Company Overview
16.8.2. Company Revenue
16.8.3. Geographical Presence
16.8.4. Key Developments
16.9. NEC Corporation
16.9.1. Company Overview
16.9.2. Company Revenue
16.9.3. Geographical Presence
16.9.4. Key Developments
16.10. Novire Technologies
16.10.1. Company Overview
16.10.2. Company Revenue
16.10.3. Geographical Presence
16.10.4. Key Developments
16.11. Octonion SA
16.11.1. Company Overview
16.11.2. Company Revenue
16.11.3. Geographical Presence
16.11.4. Key Developments
16.12. Oracle Corporation
16.12.1. Company Overview
16.12.2. Company Revenue
16.12.3. Geographical Presence
16.12.4. Key Developments
16.13. PTC Inc.
16.13.1. Company Overview
16.13.2. Company Revenue
16.13.3. Geographical Presence
16.13.4. Key Developments
16.14. Rockwell Automation, Inc.
16.14.1. Company Overview
16.14.2. Company Revenue
16.14.3. Geographical Presence
16.14.4. Key Developments
16.15. SAP SE
16.15.1. Company Overview
16.15.2. Company Revenue
16.15.3. Geographical Presence
16.15.4. Key Developments
17. Key Takeaways
Let us know your requirement to get
100% FREE customization
Table 01: Merger & Acquisitions
Table 02: List of New Entrants
Table 03: Global IoT Spend by Logistics Industry Size (US$ Mn) and Forecast, by Software, 2016 - 2032
Table 04: Global IoT Spend by Logistics Industry Size (US$ Mn) and Forecast, by Hardware, 2016 - 2032
Table 05: Global IoT Spend by Logistics Industry Size (US$ Mn) and Forecast, by Organization Size, 2016 - 2032
Table 06: Global IoT Spend by Logistics Industry Size (US$ Mn) and Forecast, by Application, 2016 - 2032
Table 07: Global IoT Spend by Logistics Industry Size (US$ Mn) and Forecast, by Hardware Application, 2016 - 2032
Table 08: Global IoT Spend by Logistics Industry Size (US$ Mn) and Forecast, by Region, 2016 - 2032
Table 09: North America IoT Spend by Logistics Industry Size (US$ Mn) and Forecast, by Software, 2016 - 2032
Table 10: North America IoT Spend by Logistics Industry Size (US$ Mn) and Forecast, by Hardware, 2016 - 2032
Table 11: North America IoT Spend by Logistics Industry Size (US$ Mn) and Forecast, by Organization Size, 2016 - 2032
Table 12: North America IoT Spend by Logistics Industry Size (US$ Mn) and Forecast, by Application, 2016 - 2032
Table 13: North America IoT Spend by Logistics Industry Size (US$ Mn) and Forecast, by Hardware Application, 2016 - 2032
Table 14: North America IoT Spend by Logistics Industry Size (US$ Mn) and Forecast, by Country, 2016 - 2032
Table 15: Europe IoT Spend by Logistics Industry Size (US$ Mn) and Forecast, by Software, 2016 - 2032
Table 16: Europe IoT Spend by Logistics Industry Size (US$ Mn) and Forecast, by Hardware, 2016 - 2032
Table 17: Europe IoT Spend by Logistics Industry Size (US$ Mn) and Forecast, by Organization Size, 2016 - 2032
Table 18: Europe IoT Spend by Logistics Industry Size (US$ Mn) and Forecast, by Application, 2016 - 2032
Table 19: Europe IoT Spend by Logistics Industry Size (US$ Mn) and Forecast, by Hardware Application, 2016 - 2032
Table 20: Europe IoT Spend by Logistics Industry Size (US$ Mn) and Forecast, by Country, 2016 - 2032
Table 21: Asia Pacific IoT Spend by Logistics Industry Size (US$ Mn) and Forecast, by Software, 2016 - 2032
Table 22: Asia Pacific IoT Spend by Logistics Industry Size (US$ Mn) and Forecast, by Hardware, 2016 - 2032
Table 23: Asia Pacific IoT Spend by Logistics Industry Size (US$ Mn) and Forecast, by Organization Size, 2016 - 2032
Table 24: Asia Pacific IoT Spend by Logistics Industry Size (US$ Mn) and Forecast, by Application, 2016 - 2032
Table 25: Asia Pacific IoT Spend by Logistics Industry Size (US$ Mn) and Forecast, by Hardware Application, 2016 - 2032
Table 26: Asia Pacific IoT Spend by Logistics Industry Size (US$ Mn) and Forecast, by Country, 2016 - 2032
Table 27: MEA IoT Spend by Logistics Industry Size (US$ Mn) and Forecast, by Software, 2016 – 2032
Table 28: MEA IoT Spend by Logistics Industry Size (US$ Mn) and Forecast, by Hardware, 2016 – 2032
Table 29: MEA IoT Spend by Logistics Industry Size (US$ Mn) and Forecast, by Organization Size, 2016 – 2032
Table 30: MEA IoT Spend by Logistics Industry Size (US$ Mn) and Forecast, by Application, 2016 – 2032
Table 31: MEA IoT Spend by Logistics Industry Size (US$ Mn) and Forecast, by Hardware Application, 2016 – 2032
Table 32: MEA IoT Spend by Logistics Industry Size (US$ Mn) and Forecast, by Country, 2016 – 2032
Table 33: South America IoT Spend by Logistics Industry Size (US$ Mn) and Forecast, by Software, 2016 – 2032
Table 34: South America IoT Spend by Logistics Industry Size (US$ Mn) and Forecast, by Hardware, 2016 – 2032
Table 35: South America IoT Spend by Logistics Industry Size (US$ Mn) and Forecast, by Organization Size, 2016 – 2032
Table 36: South America IoT Spend by Logistics Industry Size (US$ Mn) and Forecast, by Application, 2016 – 2032
Table 37: South America IoT Spend by Logistics Industry Size (US$ Mn) and Forecast, by Hardware Application, 2016 – 2032
Table 38: South America IoT Spend by Logistics Industry Size (US$ Mn) and Forecast, by Country, 2016 – 2032
Find your sweet spots for generating winning opportunities in this market.
Talk to AnalystFigure 01: Global IoT Spend by Logistics Industry Size (US$ Mn) and Forecast, 2016–2032
Figure 02: GLOBAL CAGR BREAKDOWN
Figure 03: REGIONAL OUTLINE
Figure 04: World GDP Indicator (2016)
Figure 05: Global ICT Spending (US$ Bn)
Figure 06: Porter’s Analysis
Figure 07: PESTLE Analysis
Figure 08: Ecosystem Analysis
Figure 09: Historic growth trends, 2016-2026 (US$ Mn)
Figure 10: Forecast trends, 2018-2026 (US$ Mn)
Figure 11: Global IoT Spend by Logistics Industry, Absolute Incremental Opportunity Analysis, 2016-2032
Figure 12: Global IoT Spend by Logistics Industry Attractiveness Analysis, by Software
Figure 13: Global IoT Spend by Logistics Industry Attractiveness Analysis, by Hardware
Figure 14: Global IoT Spend by Logistics Industry Attractiveness Analysis, by Organization Size
Figure 15: Global IoT Spend by Logistics Industry Attractiveness Analysis, by Application
Figure 16: Global IoT Spend by Logistics Industry Attractiveness Analysis, by Region
Figure 17: Revenue Share Analysis, 2022-2032
Figure 18: Revenue Share Analysis, 2022-2032
Figure 19: Pricing Analysis
Figure 20: Global IoT Spend by Logistics Industry Share Analysis, by Software(2021)
Figure 21: Global IoT Spend by Logistics Industry Share Analysis, by Software(2021)
Figure 22: Global IoT Spend by Logistics Industry Share Analysis, by Hardware (2021)
Figure 23: Global IoT Spend by Logistics Industry Share Analysis, by Hardware (2021)
Figure 24: Global IoT Spend by Logistics Industry Share Analysis, by Organization Size (2021)
Figure 25: Global IoT Spend by Logistics Industry Share Analysis, by Organization Size (2021)
Figure 26: Global IoT Spend by Logistics Industry Share Analysis, by Application (2021)
Figure 27: Global IoT Spend by Logistics Industry Share Analysis, by Application (2021)
Figure 28: Global IoT Spend by Logistics Industry Share Analysis, by Region (2021)
Figure 29: Global IoT Spend by Logistics Industry Share Analysis, by Region (2021)
Figure 30: North America Impact Analysis
Figure 31: North America IoT Spend by Logistics Industry Share Analysis, by Software(2021)
Figure 32: North America IoT Spend by Logistics Industry Share Analysis, by Software(2021)
Figure 33: North America IoT Spend by Logistics Industry Share Analysis, by Hardware (2021)
Figure 34: North America IoT Spend by Logistics Industry Share Analysis, by Hardware (2021)
Figure 35: North America IoT Spend by Logistics Industry Share Analysis, by Organization Size (2021)
Figure 36: North America IoT Spend by Logistics Industry Share Analysis, by Organization Size (2021)
Figure 37: North America IoT Spend by Logistics Industry Share Analysis, by Application (2021)
Figure 38: North America IoT Spend by Logistics Industry Share Analysis, by Application (2021)
Figure 39: North America IoT Spend by Logistics Industry Share Analysis, by Country (2021)
Figure 40: North America IoT Spend by Logistics Industry Share Analysis, by Country (2021)
Figure 41: North America IoT Spend by Logistics Industry Attractiveness Analysis, by Software
Figure 42: North America IoT Spend by Logistics Industry Attractiveness Analysis, by Hardware
Figure 43: North America IoT Spend by Logistics Industry Attractiveness Analysis, by Organization Size
Figure 44: North America IoT Spend by Logistics Industry Attractiveness Analysis, by Application
Figure 45: North America IoT Spend by Logistics Industry Attractiveness Analysis, by Country
Figure 46: Europe Impact Analysis
Figure 47: Europe IoT Spend by Logistics Industry Share Analysis, by Software(2021)
Figure 48: Europe IoT Spend by Logistics Industry Share Analysis, by Software(2021)
Figure 49: Europe IoT Spend by Logistics Industry Share Analysis, by Hardware (2021)
Figure 50: Europe IoT Spend by Logistics Industry Share Analysis, by Hardware (2021)
Figure 51: Europe IoT Spend by Logistics Industry Share Analysis, by Organization Size (2021)
Figure 52: Europe IoT Spend by Logistics Industry Share Analysis, by Organization Size (2021)
Figure 53: Europe IoT Spend by Logistics Industry Share Analysis, by Application (2021)
Figure 54: Europe IoT Spend by Logistics Industry Share Analysis, by Application (2021)
Figure 55: Europe IoT Spend by Logistics Industry Share Analysis, by Country (2021)
Figure 56: Europe IoT Spend by Logistics Industry Share Analysis, by Country (2021)
Figure 57: Europe IoT Spend by Logistics Industry Attractiveness Analysis, by Software
Figure 58: Europe IoT Spend by Logistics Industry Attractiveness Analysis, by Hardware
Figure 59: Europe IoT Spend by Logistics Industry Attractiveness Analysis, by Organization Size
Figure 60: Europe IoT Spend by Logistics Industry Attractiveness Analysis, by Application
Figure 61: Europe IoT Spend by Logistics Industry Attractiveness Analysis, by Country
Figure 62: Asia Pacific Impact Analysis
Figure 63: Asia Pacific IoT Spend by Logistics Industry Share Analysis, by Software(2021)
Figure 64: Asia Pacific IoT Spend by Logistics Industry Share Analysis, by Software(2021)
Figure 65: Asia Pacific IoT Spend by Logistics Industry Share Analysis, by Hardware (2021)
Figure 66: Asia Pacific IoT Spend by Logistics Industry Share Analysis, by Hardware (2021)
Figure 67: Asia Pacific IoT Spend by Logistics Industry Share Analysis, by Organization Size (2021)
Figure 68: Asia Pacific IoT Spend by Logistics Industry Share Analysis, by Organization Size (2021)
Figure 69: Asia Pacific IoT Spend by Logistics Industry Share Analysis, by Application (2021)
Figure 70: Asia Pacific IoT Spend by Logistics Industry Share Analysis, by Application (2021)
Figure 71: Asia Pacific IoT Spend by Logistics Industry Share Analysis, by Country (2021)
Figure 72: Asia Pacific IoT Spend by Logistics Industry Share Analysis, by Country (2021)
Figure 73: Asia Pacific IoT Spend by Logistics Industry Attractiveness Analysis, by Software
Figure 74: Asia Pacific IoT Spend by Logistics Industry Attractiveness Analysis, by Hardware
Figure 75: Asia Pacific IoT Spend by Logistics Industry Attractiveness Analysis, by Organization Size
Figure 76: Asia Pacific IoT Spend by Logistics Industry Attractiveness Analysis, by Application
Figure 77: Asia Pacific IoT Spend by Logistics Industry Attractiveness Analysis, by Region
Figure 78: MEA Impact Analysis
Figure 79: MEA IoT Spend by Logistics Industry Share Analysis, by Software(2021)
Figure 80: MEA IoT Spend by Logistics Industry Share Analysis, by Software(2021)
Figure 81: MEA IoT Spend by Logistics Industry Share Analysis, by Hardware (2021)
Figure 82: MEA IoT Spend by Logistics Industry Share Analysis, by Hardware (2021)
Figure 83: MEA IoT Spend by Logistics Industry Share Analysis, by Organization Size (2021)
Figure 84: MEA IoT Spend by Logistics Industry Share Analysis, by Organization Size (2021)
Figure 85: MEA IoT Spend by Logistics Industry Share Analysis, by Application (2021)
Figure 86: MEA IoT Spend by Logistics Industry Share Analysis, by Application (2021)
Figure 87: MEA IoT Spend by Logistics Industry Share Analysis, by Country (2021)
Figure 88: MEA IoT Spend by Logistics Industry Share Analysis, by Country (2021)
Figure 89: Asia Pacific IoT Spend by Logistics Industry Attractiveness Analysis, By Software
Figure 90: Asia Pacific IoT Spend by Logistics Industry Attractiveness Analysis, By Hardware
Figure 91: Asia Pacific IoT Spend by Logistics Industry Attractiveness Analysis, By Organization Size
Figure 92: Asia Pacific IoT Spend by Logistics Industry Attractiveness Analysis, By Application
Figure 93: Asia Pacific IoT Spend by Logistics Industry Attractiveness Analysis, By Region
Figure 94: South America Impact Analysis
Figure 95: South America IoT Spend by Logistics Industry Share Analysis, by Software(2021)
Figure 96: South America IoT Spend by Logistics Industry Share Analysis, by Software(2021)
Figure 97: South America IoT Spend by Logistics Industry Share Analysis, by Hardware (2021)
Figure 98: South America IoT Spend by Logistics Industry Share Analysis, by Hardware (2021)
Figure 99: South America IoT Spend by Logistics Industry Share Analysis, by Organization Size (2021)
Figure 100: South America IoT Spend by Logistics Industry Share Analysis, by Organization Size (2021)
Figure 101: South America IoT Spend by Logistics Industry Share Analysis, by Application (2021)
Figure 102: South America IoT Spend by Logistics Industry Share Analysis, by Application (2021)
Figure 103: South America IoT Spend by Logistics Industry Share Analysis, by Country (2021)
Figure 104: South America IoT Spend by Logistics Industry Share Analysis, by Country (2021)
Figure 105: South America IoT Spend by Logistics Industry Attractiveness Analysis, By Software
Figure 106: South America IoT Spend by Logistics Industry Attractiveness Analysis, By Hardware
Figure 107: South America IoT Spend by Logistics Industry Attractiveness Analysis, By Organization Size
Figure 108: South America IoT Spend by Logistics Industry Attractiveness Analysis, By Application
Figure 109: South America IoT Spend by Logistics Industry Attractiveness Analysis, By Country
Need specific information?
Request CustomizationExplore Technology Insights
View Reports