Reports

- Global Locations -

Headquarters

Future Market Insights, Inc.

Christiana Corporate, 200
Continental Drive, Suite 401,
Newark, Delaware - 19713,
United States

T: +1-845-579-5705

Americas

Future Market Insights, Inc.

616 Corporate Way, Suite 2-9018,
Valley Cottage, NY 10989, United States

T: +1-347-918-3531

MEA

Future Market Insights

1602-6 Jumeirah Bay X2 Tower, Plot No: JLT-PH2-X2A,
Jumeirah Lakes Towers, Dubai,
United Arab Emirates

Europe

Future Market Insights

3rd Floor, 207 Regent Street,
W1B 3HH London
United Kingdom

T: + 44 (0) 20 8123 9659
D: +44 (0) 20 3287 4268

Asia Pacific

Future Market Insights

IndiaLand Global Tech Park, Unit UG-1, Behind Grand HighStreet, Phase 1, Hinjawadi, MH, Pune – 411057, India

IoT in Healthcare Market Outlook (2022 to 2032)

[297 Pages Report] The global IoT in healthcare market is projected to reach US$ 181.4 Billion in 2022, anticipated to grow at a CAGR of 18.0%, reaching US$ 952.3 Billion by 2032. The market is slated to document a Y-o-Y growth rate of 20.7% from 2021-2022, increasing from the previously registered value of US$ 150.3 Billion.

The Internet of Things is a major component in the digital transformation of the healthcare business, and numerous stakeholders are ramping up their efforts in this arena, thus development in IoT healthcare applications is expected to increase.

Attributes Details
IoT in Healthcare Market CAGR (2022 to 2032) 18.0%
IoT in Healthcare Market Size (2022) US$ 181.4 Billion
IoT in Healthcare Market Size (2032) US$ 952.3 Billion

The increased use of healthcare information systems, the rise of big data in healthcare, enhanced device accuracy and connection, and the high penetration of connected devices in healthcare are driving the IoT industry. The Internet of Things (IoT) has the potential to transform traditional paper-based healthcare treatment by facilitating real-time patient data access and remote patient monitoring. The introduction of this digital healthcare technology addressed the looming demand for improved diagnostics and focused therapy solutions.

It not only allows physicians to monitor patients remotely, but it also serves as a fitness and wellness tracker for athletes and a dosage reminder for patients. The successful adoption of IoT in the remote monitoring of diabetic and asthma patients, combined with the widespread use of fitness and wellness gadgets, has resulted in a significant demand for the IoT healthcare industry.

Don't pay for what you don't need

Customize your report by selecting specific countries or regions and save 30%!

What is the Potential of the IoT in Healthcare Market?

The COVID-19 pandemic has increased demand for wearable gadgets that measure health and fitness information, and location, and can be coupled with devices such as computers and cell phones. Because of the concern of COVID-19, the growing rate of adoption of health and fitness will increase purchases of in-stock wearables for real-time health monitoring, further raising the demand for development in healthcare IoT technology.

Big data analytics is a rapidly growing area in IoT. Big data analytics need to incorporate the most current advancements in machine learning, logical methods, computational intelligence, and data mining. Many healthcare professionals, including payers and providers, are increasingly studying big data to get in-depth expertise. Even though these initiatives are still in their early phases, they are expected to contribute to addressing industry-related issues such as inconsistency in healthcare quality and rising healthcare costs.

Improvements in the quality of people's everyday health and living activities, as well as big data analytics to support and encourage such research efforts, are among the drivers driving market expansion, as IoT-based healthcare systems play an important part in the growth of medical information systems. Patient tracking, tracing, and monitoring are critical for improving the healthcare system.

Several governments throughout the world have launched digital health projects. These initiatives range from large investments in infrastructure and digital health promotion to organizing conferences, inviting shareholders and major market participants, restructuring the healthcare system, and implementing regulations mandating the use of HER (electronic health records) using advanced technology.

IoT in Healthcare Market

Key Challenges Influencing IoT in Healthcare Market Expansion

In healthcare, outdated infrastructure is a well-known concern. It has been demonstrated that numerous firms in the healthcare business are still encumbered by legacy healthcare IT infrastructure.

With the introduction of newer technologies, these companies require the appropriate workforce to apply them. With the increasing use of IoT, a big issue that IoT poses is data security and privacy, which increases the healthcare industry's exposure to cyber-attacks.

Sabyasachi Ghosh
Sabyasachi Ghosh

Principal Consultant

Talk to Analyst

Find your sweet spots for generating winning opportunities in this market.

Comparative View of IoT in Healthcare Market

IoT in Healthcare Market:

Attributes IoT in Healthcare Market
CAGR (2022 to 2032) 18.0%
Market Value (2032) US$ 952.3 Billion
Growth Factor The use of IoT in the healthcare business offers several advantages
Opportunity Reduced expenses are one of the most significant advantages of IoT in healthcare. Non-critical patients will be able to stay at home while different IoT devices monitor and transmit all necessary information to the health institution, resulting in fewer hospital stays and doctor visits.
Key Trends 5G will give the ultra-low latency speeds and mobility that the healthcare industry needs for IoT. As a result, AI-powered solutions will make sense of data lakes received from a variety of devices. Such AI algorithms will be used in Big Data methods to assess data in real-time and make vital health choices.

Medication Management in Healthcare Market:

Attributes Medication Management in Healthcare Market
CAGR (2022 to 2032) 9.1%
Market Value (2032) US$ 10 Billion
Growth Factor During the projected period, the Medication Management System Market is estimated to grow at a CAGR of 9.1%.
Opportunity The growth of the medication management system market is a rise in hospital spending to improve treatment service quality. According to the International Diabetes Federation, global diabetes treatment spending is predicted to increase from US$ 760 billion to US$ 845 billion between 2019 and 2045.
Key Trends Clinical Decision Support Systems (CDSS) are healthcare IT systems that are specifically designed to assist healthcare professionals and physicians with clinical decision support. CDS is made up of various tools that aid in clinical workflow decision-making.

Portable Diagnostic Devices in Healthcare Market:

Attributes Portable Diagnostic Devices in Healthcare Market
CAGR (2022 to 2032) 7.18%
Market Value (2032) US$ 140 Billion
Growth Factor ICT (information and communication technologies) are widely employed in the healthcare business and have resulted in considerable breakthroughs in ICT-based medical equipment. In the foreseeable future, such advances will considerably cut office visits.
Opportunity The growing need for medical diagnostic devices in rural or developing places where professional and expensive equipment is difficult to get is driving the use of portable diagnostic devices.
Key Trends Portable diagnostic devices are generally used by healthcare practitioners to perform tests on people suffering from epidemic illnesses such as Hepatitis C.

According to FMI market research, the IoT in the healthcare industry is expected to approach US$ 181.4 Billion by 2022. Other major technologies have an influence on this growth estimate. IoT is steadily gaining acceptance and expanding with new ultra-fast 5G mobile wireless, AI, and Big Data. Combining these sophisticated technologies with the Internet of Things will almost certainly transform the healthcare business. IoT in healthcare, for example, utilizing 5G wireless and AI, might totally revolutionize how patients are monitored and treated remotely.

In a nutshell, the Internet of Things (IoT) is a concept based on the concept of complete ubiquitous computing, which is the processing of information related to external activities or things. Ubiquitous computing entails allowing electronic devices equipped with microprocessors and sensors to communicate with one another. Except that all of those electrical gadgets have Internet connectivity, IoT is a pervasive network.

The Internet of Things (IoT) in the healthcare business is an excellent illustration of this pervasive computing. In a hospital, for example, hundreds of intelligent electronic devices can be installed to monitor patients' health conditions 24 hours a day, communicate with one another, make choices, and upload data to a healthcare cloud platform.

Category-Wise Analysis of IoT in Healthcare Market

Which Component is likely to document the Highest Growth?

Portable Diagnostic Hardware Devices to Experience Maximum Uptick in Coming Years

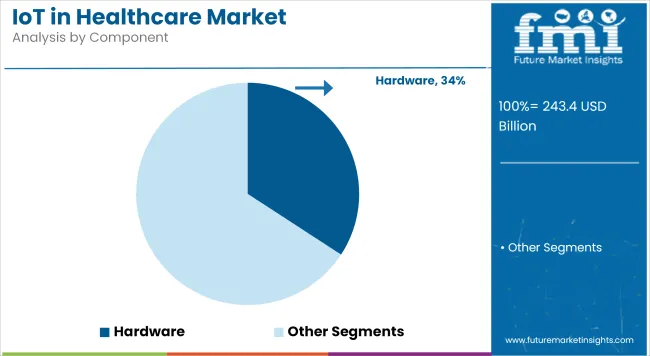
According to FMI, portable hardware diagnostic devices are expected to account for maximum sales, driven by advancements in technology in portable diagnostic devices. For example, EKO Devices received FDA approval for Eko Duo, which can be used as an effective ECG monitoring tool, in 2017. As per the report, a CAGR of 15.1% has been projected from 2022 to 2032.

Other factors such as rising chronic condition incidence, rising geriatric population presence of a large target patient population, rising diagnosis rate, rising patient awareness about portable diagnostic devices, and improvements in treatment rates and healthcare infrastructure are also expected to propel market growth.

Who is likely to emerge as the Primary IoT in Healthcare End-User?

Demand across Hospitals to register Maximum Expansion

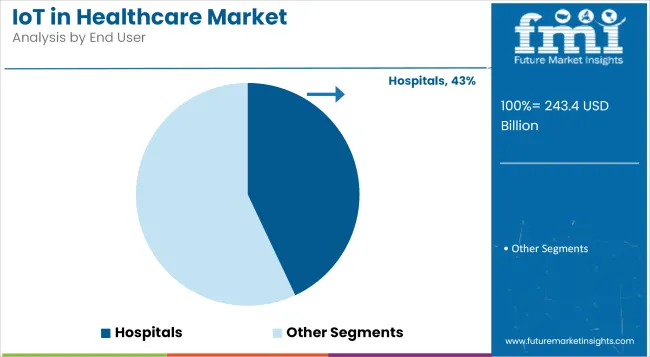
According to FMI, hospitals will emerge as the primary end users of IoT in healthcare, expected to register a CAGR of 18.2% during the 2022 to 20322 forecast period. Growth is attributed to the fact that hospitals are the primary point of contact for all major healthcare innovations.

Given the increasing hospitalization rates for numerous chronic and infectious diseases, stakeholders are investing in highly advanced diagnostic, therapeutic, and workflow-optimizing solutions. These help various departments achieve greater economies of scale, as well as help them improve positive patient outcomes.

Get the data you need at a Fraction of the cost

Personalize your report by choosing insights you need
and save 40%!

IoT in Healthcare Regional Outlook

How do the Various Regions Influence the Growth of the IoT in the Healthcare Market?

Ongoing Investments to Beef up Healthcare to Drive APAC Market Growth

Asia Pacific is seeing tremendous expansion in the IoT in the healthcare market. Because the APAC region contains more than half of the world's population, any big technological shifts, such as those foreshadowed by IoT, are likely to determine the region's future.

Many Asian nations, including China, Japan, and India, are embracing information-intensive IoT technologies to meet rising healthcare service demand, and as a result, APAC is likely to provide significant prospects to use IoT in healthcare solutions.

According to data published by FMI, the aforementioned countries are expected to document CAGRs worth 19.5%, 19.2%, and 21.1% respectively. Furthermore, China, Japan, and India will likely document market values of US$ 98.2 Billion, US$ 73.1 Billion, and US$ 85.7 Billion respectively.

What are the Growth Prospects of the IoT in the Healthcare Market in the USA?

The healthcare Internet of Things (IoT) industry in North America led the worldwide market and is expected to continue in this manner over the projected period. This expansion may be attributed to reasons such as the increasing acceptance of healthcare IT solutions, the presence of significant players, and the availability of advanced infrastructure in the USA.

Rising measures to reduce medical costs, resulting in a transition from a fee-for-service to a value-based approach, have also boosted the industry significantly. According to the report, demand for IoT in healthcare solutions in the USA is poised to surge at an 18.9% CAGR until 2032. An absolute opportunity worth US$ 171.4 Billion is projected for the USA market, along with a market value of US$ 208.1 Billion in 2032.

How Competitive is the IoT in Healthcare Market?

The Internet of Things (IoT) in healthcare is somewhat competitive, with numerous prominent competitors. Certain strategic efforts, such as mergers, new product launches, acquisitions, and collaborations, are being implemented by corporations to assist them increase their market position.

IoT in Healthcare Market Developments

  • Medtronic worked with IBM Watson in January 2019 to provide IQcast, a new feature of its current product Sugar.IQ, for iOS mobile devices in the USA. The software would provide patients with a hypoglycemic episode to monitor their low glucose level by anticipating the occurrence 1 to 4 hours in advance.
  • In April 2019, Royal Philips and Spencer Health Solutions expanded their relationship to provide chronically sick patients in selected European Union (EU) nations with in-home medication adherence and the Philips telehealth platform.

Key Players

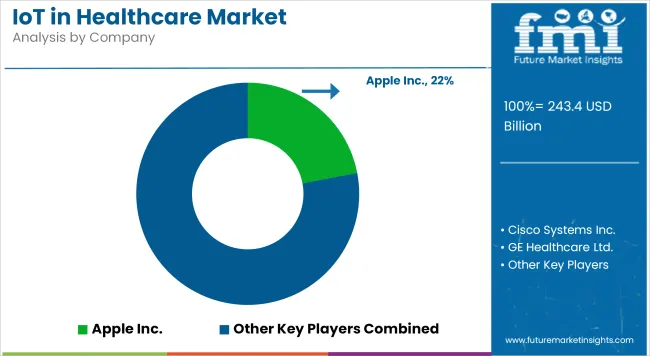
  • Apple Inc.
  • Cisco Systems Inc.
  • GE Healthcare Ltd.
  • Google (Alphabet)
  • International Business Machines Corporation
  • Medtronic PLC
  • Microsoft Corporation
  • Proteus Digital Health
  • Koninklijke Philips N.V.
  • QUALCOMM Incorporated
  • Abbot Laboratories

Key Segments Covered in the IoT in Healthcare Industry Report

By Component:

  • Hardware
    • Portable Diagnostic Devices
    • Non-Portable Diagnostic Devices
  • Software
  • Services

By Application:

  • Telemedicine
  • Medication Management
  • Clinical Operations
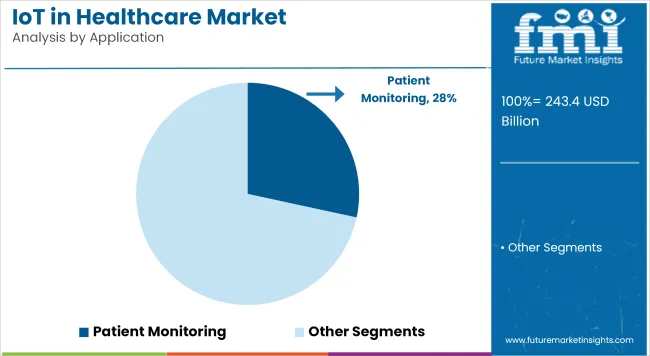
  • Patient Monitoring
  • Connected Imaging
  • Healthcare Applications

By Technology:

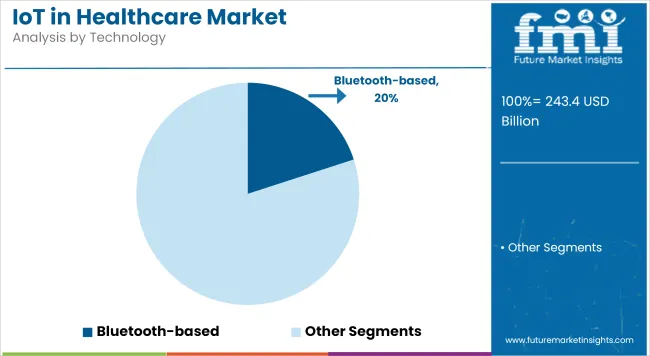
  • Bluetooth-based
  • Wi-Fi-based
  • NFC-based
  • Zigbee-based
  • RFID-based
  • Other Technologies (Cellular, Satellite, Zwave, EnOcean)

By End User:

  • Hospitals
  • Pharmaceuticals
  • Clinics & Laboratories

By Region:

  • North America
  • Europe
  • Asia Pacific
  • Middle East and Africa
  • South America

Frequently Asked Questions

What is the growth outlook for the IoT in healthcare market?

The IoT in healthcare market is expected to grow at a stellar CAGR of 18.0% over the forecast period.

What was the size of the IoT in healthcare market size in 2021?

The global market for IoT in Healthcare was valued at US$ 150.1 Billion in 2021.

Which component has the highest market value in the IoT in healthcare market?

Hardware IoT in healthcare is expected to showcase a CAGR of 15.1% during the forecast period

Which country dominates the global IoT in healthcare market?

India is expected to be the main hub for IoT in healthcare, experiencing a CAGR of 21.1%

What will be the market size of IoT in healthcare by 2032?

The market for IoT in healthcare is expected to grow to nearly US$ 952.3 Billion by 2032

What is the projected dollar growth of IoT in healthcare from 2022 to 2032?

The absolute dollar growth of IoT in healthcare is estimated at US$ 770.9 Billion

Table of Content

1. Preface | IoT in Healthcare Market

    1.1. Market Definition and Scope

    1.2. Market Segmentation

    1.3. Key Research Objectives

    1.4. Research Highlights

2. Assumptions and Research Methodology

3. Executive Summary: Global Market

4. Market Overview

    4.1. Introduction

    4.2. Market Dynamics

        4.2.1. Drivers

        4.2.2. Restraints

        4.2.3. Opportunities

    4.3. Key Market Indicator

    4.4. Global IoT in Healthcare Market Analysis and Forecasts, 2015 to 2032

        4.4.1. Market Revenue Projections (US$ Billion)

    4.5. Porter’s Five Force Analysis

    4.6. Value Chain Analysis

    4.7. Market Outlook

5. Global Market Analysis and Forecasts, By Component

    5.1. Definitions

    5.2. Market Analysis Forecast (US$ Billion), By Component, 2015 to 2032

        5.2.1. Hardware

            5.2.1.1. Portable Diagnostic Devices

                5.2.1.1.1. On-body Wearable

                5.2.1.1.2. Others

            5.2.1.2. Non-Portable Diagnostic Devices

        5.2.2. Software

        5.2.3. Service

    5.3. Component Comparison Matrix

    5.4. Market Attractiveness By Component

6. Global Market Analysis and Forecasts, By Application

    6.1. Definitions

    6.2. Market Analysis Forecast (US$ Billion), By Application, 2015 to 2032

        6.2.1. Telemedicine

        6.2.2. Medication Management

        6.2.3. Clinical Operations

        6.2.4. Patient Monitoring

        6.2.5. Connected Imaging

        6.2.6. Others

    6.3. Application Comparison Matrix

    6.4. Market Attractiveness By Application

7. Global Market Analysis and Forecasts, By Technology

    7.1. Definitions

    7.2. Market Analysis Forecast (US$ Billion), By Technology, 2015 to 2032

        7.2.1. Bluetooth

        7.2.2. Wi-Fi

        7.2.3. NFC

        7.2.4. Zigbee

        7.2.5. RFID

        7.2.6. Others (Cellular, Satellite, Zwave, EnOcean)

    7.3. Application Comparison Matrix

    7.4. Market Attractiveness By Application

8. Global Market Analysis and Forecasts, By End-use

    8.1. Definitions

    8.2. Market Analysis Forecast (US$ Billion), By End-use, 2015 to 2032

        8.2.1. Hospitals

        8.2.2. Pharmaceuticals

        8.2.3. Clinics & Laboratories

    8.3. End-use Comparison Matrix

    8.4. Market Attractiveness By End-use

9. Global Market Analysis and Forecasts, By Region

    9.1. Key Findings

    9.2. Key Trends

    9.3. Market Analysis Forecast, By Region, 2015 to 2032 (sqm)

        9.3.1. North America

        9.3.2. Europe

        9.3.3. Asia Pacific

        9.3.4. Middle East and Africa

        9.3.5. South America

    9.4. Market Attractiveness By Region

10. North America Market Analysis and Forecast

    10.1. Key Findings

    10.2. Market Analysis Forecast (US$ Billion), By Component, 2015 to 2032

        10.2.1. Hardware

            10.2.1.1. Portable Diagnostic Devices

                10.2.1.1.1. On-body Wearable

                10.2.1.1.2. Others

            10.2.1.2. Non-Portable Diagnostic Devices

        10.2.2. Software

        10.2.3. Service

    10.3. Market Analysis Forecast (US$ Billion), By Application, 2015 to 2032

        10.3.1. Telemedicine

        10.3.2. Medication Management

        10.3.3. Clinical Operations

        10.3.4. Patient Monitoring

        10.3.5. Connected Imaging

        10.3.6. Others

    10.4. Market Analysis Forecast (US$ Billion), By Technology, 2015 to 2032

        10.4.1. Bluetooth

        10.4.2. Wi-Fi

        10.4.3. NFC

        10.4.4. Zigbee

        10.4.5. RFID

        10.4.6. Others (Cellular, Satellite, Zwave, EnOcean)

    10.5. Market Analysis Forecast (US$ Billion), By End-use, 2015 to 2032

        10.5.1. Hospitals

        10.5.2. Pharmaceuticals

        10.5.3. Clinics & Laboratories

    10.6. Market Analysis Forecast (US$ Billion), By Country, 2015 to 2032

        10.6.1. The USA

        10.6.2. Canada

        10.6.3. Rest of North America

    10.7. Market Attractiveness Analysis

        10.7.1. By Component

        10.7.2. By Application

        10.7.3. By Technology

        10.7.4. By End-use

        10.7.5. By Country

11. Europe Market Analysis and Forecast

    11.1. Key Findings

    11.2. Market Analysis Forecast (US$ Billion), By Component, 2015 to 2032

        11.2.1. Hardware

            11.2.1.1. Portable Diagnostic Devices

                11.2.1.1.1. On-body Wearable

                11.2.1.1.2. Others

            11.2.1.2. Non-Portable Diagnostic Devices

        11.2.2. Software

        11.2.3. Service

    11.3. Market Analysis Forecast (US$ Billion), By Application, 2015 to 2032

        11.3.1. Telemedicine

        11.3.2. Medication Management

        11.3.3. Clinical Operations

        11.3.4. Patient Monitoring

        11.3.5. Connected Imaging

        11.3.6. Others

    11.4. Market Analysis Forecast (US$ Billion), By Technology, 2015 to 2032

        11.4.1. Bluetooth

        11.4.2. Wi-Fi

        11.4.3. NFC

        11.4.4. Zigbee

        11.4.5. RFID

        11.4.6. Others (Cellular, Satellite, Zwave, EnOcean)

    11.5. Market Analysis Forecast (US$ Billion), By End-use, 2015 to 2032

        11.5.1. Hospitals

        11.5.2. Pharmaceuticals

        11.5.3. Clinics & Laboratories

    11.6. Market Analysis Forecast (US$ Billion), By Country, 2015 to 2032

        11.6.1. Germany

        11.6.2. France

        11.6.3. UK

        11.6.4. Rest of Europe

    11.7. Market Attractiveness Analysis

        11.7.1. By Component

        11.7.2. By Application

        11.7.3. By Technology

        11.7.4. By End-use

        11.7.5. By Country

12. Asia-Pacific Market Analysis and Forecast

    12.1. Key Findings

    12.2. Market Analysis Forecast (US$ Billion), By Component, 2015 to 2032

        12.2.1. Hardware

            12.2.1.1. Portable Diagnostic Devices

                12.2.1.1.1. On-body Wearable

                12.2.1.1.2. Others

            12.2.1.2. Non-Portable Diagnostic Devices

        12.2.2. Software

        12.2.3. Service

    12.3. Market Analysis Forecast (US$ Billion), By Application, 2015 to 2032

        12.3.1. Telemedicine

        12.3.2. Medication Management

        12.3.3. Clinical Operations

        12.3.4. Patient Monitoring

        12.3.5. Connected Imaging

        12.3.6. Others

    12.4. Market Analysis Forecast (US$ Billion), By Technology, 2015 to 2032

        12.4.1. Bluetooth

        12.4.2. Wi-Fi

        12.4.3. NFC

        12.4.4. Zigbee

        12.4.5. RFID

        12.4.6. Others (Cellular, Satellite, Zwave, EnOcean)

    12.5. Market Analysis Forecast (US$ Billion), By End-use, 2015 to 2032

        12.5.1. Hospitals

        12.5.2. Pharmaceuticals

        12.5.3. Clinics & Laboratories

    12.6. Market Analysis Forecast (US$ Billion), By Country, 2015 to 2032

        12.6.1. China

        12.6.2. India

        12.6.3. Japan

        12.6.4. Rest of Asia Pacific

    12.7. Market Attractiveness Analysis

        12.7.1. By Component

        12.7.2. By Application

        12.7.3. By Technology

        12.7.4. By End-use

        12.7.5. By Country

13. Middle East & Africa (MEA) Market Analysis and Forecast

    13.1. Key Findings

    13.2. Market Analysis Forecast (US$ Billion), By Component, 2015 to 2032

        13.2.1. Hardware

            13.2.1.1. Portable Diagnostic Devices

                13.2.1.1.1. On-body Wearable

                13.2.1.1.2. Others

            13.2.1.2. Non-Portable Diagnostic Devices

        13.2.2. Software

        13.2.3. Service

    13.3. Market Analysis Forecast (US$ Billion), By Application, 2015 to 2032

        13.3.1. Telemedicine

        13.3.2. Medication Management

        13.3.3. Clinical Operations

        13.3.4. Patient Monitoring

        13.3.5. Connected Imaging

        13.3.6. Others

    13.4. Market Analysis Forecast (US$ Billion), By Technology, 2015 to 2032

        13.4.1. Bluetooth

        13.4.2. Wi-Fi

        13.4.3. NFC

        13.4.4. Zigbee

        13.4.5. RFID

        13.4.6. Others (Cellular, Satellite, Zwave, EnOcean)

    13.5. Market Analysis Forecast (US$ Billion), By End-use, 2015 to 2032

        13.5.1. Hospitals

        13.5.2. Pharmaceuticals

        13.5.3. Clinics & Laboratories

    13.6. Market Analysis Forecast (US$ Billion), By Country, 2015 to 2032

        13.6.1. UAE

        13.6.2. Saudi Arabia

        13.6.3. South Africa

        13.6.4. Rest of Middle East & Africa

    13.7. Market Attractiveness Analysis

        13.7.1. By Component

        13.7.2. By Application

        13.7.3. By Technology

        13.7.4. By End-use

        13.7.5. By Country

14. South America Market Analysis and Forecast

    14.1. Key Findings

    14.2. Market Analysis Forecast (US$ Billion), By Component, 2015 to 2032

        14.2.1. Hardware

            14.2.1.1. Portable Diagnostic Devices

                14.2.1.1.1. On-body Wearable

                14.2.1.1.2. Others

            14.2.1.2. Non-Portable Diagnostic Devices

        14.2.2. Software

        14.2.3. Service

    14.3. Market Analysis Forecast (US$ Billion), By Application, 2015 to 2032

        14.3.1. Telemedicine

        14.3.2. Medication Management

        14.3.3. Clinical Operations

        14.3.4. Patient Monitoring

        14.3.5. Connected Imaging

        14.3.6. Others

    14.4. Market Analysis Forecast (US$ Billion), By Technology, 2015 to 2032

        14.4.1. Bluetooth

        14.4.2. Wi-Fi

        14.4.3. NFC

        14.4.4. Zigbee

        14.4.5. RFID

        14.4.6. Others (Cellular, Satellite, Zwave, EnOcean)

    14.5. Market Analysis Forecast (US$ Billion), By End-use, 2015 to 2032

        14.5.1. Hospitals

        14.5.2. Pharmaceuticals

        14.5.3. Clinics & Laboratories

    14.6. Market Analysis Forecast (US$ Billion), By Country, 2015 to 2032

        14.6.1. Brazil

        14.6.2. Rest of South America

    14.7. Market Attractiveness Analysis

        14.7.1. By Component

        14.7.2. By Application

        14.7.3. By Technology

        14.7.4. By End-use

        14.7.5. By Country

15. Competition Landscape

    15.1. Market Player - Competition Matrix

    15.2. Market Share Analysis By Company (2021)

    15.3. Company Profiles (Details - Overview, Financials, SWOT, Strategy)

        15.3.1. AdhereTech Inc.

            15.3.1.1. Company Overview

            15.3.1.2. Company Description

            15.3.1.3. Financial Overview

            15.3.1.4. SWOT Analysis

            15.3.1.5. Strategy Overview

        15.3.2. Cerner Corporation

            15.3.2.1. Company Overview

            15.3.2.2. Company Description

            15.3.2.3. Financial Overview

            15.3.2.4. SWOT Analysis

            15.3.2.5. Strategy Overview

        15.3.3. Cisco Inc.

            15.3.3.1. Company Overview

            15.3.3.2. Company Description

            15.3.3.3. Financial Overview

            15.3.3.4. SWOT Analysis

            15.3.3.5. Strategy Overview

        15.3.4. Ericsson AB

            15.3.4.1. Company Overview

            15.3.4.2. Company Description

            15.3.4.3. Financial Overview

            15.3.4.4. SWOT Analysis

            15.3.4.5. Strategy Overview

        15.3.5. General Electric Company (GE Healthcare)

            15.3.5.1. Company Overview

            15.3.5.2. Company Description

            15.3.5.3. Financial Overview

            15.3.5.4. SWOT Analysis

            15.3.5.5. Strategy Overview

        15.3.6. Honeywell International Inc.

            15.3.6.1. Company Overview

            15.3.6.2. Company Description

            15.3.6.3. Financial Overview

            15.3.6.4. SWOT Analysis

            15.3.6.5. Strategy Overview

        15.3.7. IBM Corporation

            15.3.7.1. Company Overview

            15.3.7.2. Company Description

            15.3.7.3. Financial Overview

            15.3.7.4. SWOT Analysis

            15.3.7.5. Strategy Overview

        15.3.8. Koninklijke Philips N.V.

            15.3.8.1. Company Overview

            15.3.8.2. Company Description

            15.3.8.3. Financial Overview

            15.3.8.4. SWOT Analysis

            15.3.8.5. Strategy Overview

        15.3.9. Medtronic Inc.

            15.3.9.1. Company Overview

            15.3.9.2. Company Description

            15.3.9.3. Financial Overview

            15.3.9.4. SWOT Analysis

            15.3.9.5. Strategy Overview

        15.3.10. Microsoft corporation

            15.3.10.1. Company Overview

            15.3.10.2. Company Description

            15.3.10.3. Financial Overview

            15.3.10.4. SWOT Analysis

            15.3.10.5. Strategy Overview

        15.3.11. NXP Semiconductors

            15.3.11.1. Company Overview

            15.3.11.2. Company Description

            15.3.11.3. Financial Overview

            15.3.11.4. SWOT Analysis

            15.3.11.5. Strategy Overview

        15.3.12. Qualcomm Technologies, Inc.

            15.3.12.1. Company Overview

            15.3.12.2. Company Description

            15.3.12.3. Financial Overview

            15.3.12.4. SWOT Analysis

            15.3.12.5. Strategy Overview

        15.3.13. SAP SE

            15.3.13.1. Company Overview

            15.3.13.2. Company Description

            15.3.13.3. Financial Overview

            15.3.13.4. SWOT Analysis

            15.3.13.5. Strategy Overview

        15.3.14. STANLEY Healthcare

            15.3.14.1. Company Overview

            15.3.14.2. Company Description

            15.3.14.3. Financial Overview

            15.3.14.4. SWOT Analysis

            15.3.14.5. Strategy Overview

        15.3.15. Zebra Technologies

            15.3.15.1. Company Overview

            15.3.15.2. Company Description

            15.3.15.3. Financial Overview

            15.3.15.4. SWOT Analysis

            15.3.15.5. Strategy Overview

16. Key Takeaways

Don't pay for what you don't need

Customize your report by selecting specific countries or regions and save 30%!

List of Tables

Table 1: Global Market Size Forecast, By Component, 2015 to 2032 (US$ Billion)

Table 2: Global Market Size Forecast, By Hardware, 2015 to 2032 (US$ Billion)

Table 3: Global Market Size Forecast, By Portable Diagnostic Devices, 2015 to 2032 (Billion)

Table 4: Global Market Size Forecast, By Application, 2015 to 2032 (US$ Billion)

Table 5: Global Market Size Forecast, By End-use, 2015 to 2032 (US$ Billion)

Table 6: Global Market Size Forecast, By Technology, 2015 to 2032 (US$ Billion)

Table 7: Global Market Revenue Forecast, By Region, 2015 to 2032 (US$ Billion)

Table 8: North America Market Size Forecast, By Component, 2015 to 2032 (US$ Billion)

Table 9: North America Market Size Forecast, By Hardware, 2015 to 2032 (US$ Billion)

Table 10: North America Market Size Forecast, By Portable Diagnostic Devices, 2015 to 2032 (US$ Billion)

Table 11: North America Market Size Forecast, By Application, 2015 to 2032 (US$ Billion)

Table 12: North America Market Size Forecast, By End-use, 2015 to 2032 (US$ Billion)

Table 13: North America Market Size Forecast, By Technology, 2015 to 2032 (US$ Billion)

Table 14: North America Market Revenue Forecast, By Country, 2015 to 2032 (US$ Billion)

Table 15: Europe Market Size Forecast, By Component, 2015 to 2032 (US$ Billion)

Table 16: Europe Market Size Forecast, By Hardware, 2015 to 2032 (US$ Billion)

Table 17: Europe Market Size Forecast, By Portable Diagnostic Devices, 2015 to 2032 (US$ Billion)

Table 18: Europe Market Size Forecast, By Application, 2015 to 2032 (US$ Billion)

Table 19: Europe Market Size Forecast, By End-use, 2015 to 2032 (US$ Billion)

Table 20: Europe Market Size Forecast, By Technology, 2015 to 2032 (US$ Billion)

Table 21: Europe Market Revenue Forecast, By Country, 2015 to 2032 (US$ Billion)

Table 22: Asia Pacific Market Size Forecast, By Component, 2015 to 2032 (US$ Billion)

Table 23: Asia Pacific Market Size Forecast, By Hardware, 2015 to 2032 (US$ Billion)

Table 24: Asia Pacific Market Size Forecast, By Portable Diagnostic Devices, 2015 to 2032 (US$ Billion)

Table 25: Asia Pacific Market Size Forecast, By Application, 2015 to 2032 (US$ Billion)

Table 26: Asia Pacific Market Size Forecast, By End-use, 2015 to 2032 (US$ Billion)

Table 27: Asia Pacific Market Size Forecast, By Technology, 2015 to 2032 (US$ Billion)

Table 28: Asia Pacific Market Revenue Forecast, By Country, 2015 to 2032 (US$ Billion)

Table 29: Middle East & Africa Market Size Forecast, By Component, 2015 to 2032 (US$ Billion)

Table 30: Middle East & Africa Market Size Forecast, By Hardware, 2015 to 2032 (US$ Billion)

Table 31: Middle East & Africa Market Size Forecast, By Portable Diagnostic Devices, 2015 to 2032 (US$ Billion)

Table 32: Middle East & Africa Market Size Forecast, By Application, 2015 to 2032 (US$ Billion)

Table 33: Middle East & Africa Market Size Forecast, By End-use, 2015 to 2032 (US$ Billion)

Table 34: Middle East & Africa Market Size Forecast, By Technology, 2015 to 2032 (US$ Billion)

Table 35: Middle East & Africa Market Revenue Forecast, By Country, 2015 to 2032 (US$ Billion)

Table 36: South America Market Size Forecast, By Component, 2015 to 2032 (US$ Billion)

Table 37: South America Market Size Forecast, By Hardware, 2015 to 2032 (US$ Billion)

Table 38: South America Market Size Forecast, By Portable Diagnostic Devices, 2015 to 2032 (US$ Billion)

Table 39: South America Market Size Forecast, By Application, 2015 to 2032 (US$ Billion)

Table 40: South America Market Size Forecast, By End-use, 2015 to 2032 (US$ Billion)

Table 41: South America Market Size Forecast, By Technology, 2015 to 2032 (US$ Billion)

Table 42: South America Market Revenue Forecast, By Country, 2015 to 2032 (US$ Billion)
Sabyasachi Ghosh
Sabyasachi Ghosh

Principal Consultant

Talk to Analyst

Find your sweet spots for generating winning opportunities in this market.

List of Charts

Figure 1: Global Market

Figure 2: Global Market Revenue Share, by Region, 2021

Figure 3: Key Market Indicator 

Figure 4: Global Market Revenue Forecast, 2015 to 2032 (US$ Billion) 

Figure 5: Global Market Y-o-Y Growth (%), 2015 to 2032

Figure 6: Porter Five Forces Analysis

Figure 7: Value Chain Analysis

Figure 8: Market Revenue Share By Component (2021)

Figure 9: Market Revenue Share By Region (2021)

Figure 10: Market Revenue Share By Application (2021)

Figure 11: Market Revenue Share By Technology (2021)

Figure 12: Global Market Value Share Analysis, By Component, 2022 and 2032

Figure 13: Market Analysis, By Component, Hardware

Figure 14: Market Analysis, By Component, Software

Figure 15: Market Analysis, By Component, Service

Figure 16: Market Comparison Matrix, By Component

Figure 17: Market Attractiveness Analysis, By Component

Figure 18: Global Market Value Share Analysis, By Application, 2022 and 2032

Figure 19: Market Analysis, By Application, Telemedicine

Figure 20: Market Analysis, By Application, Medication Management

Figure 21: Market Analysis, By Application, Clinical Operations

Figure 22: Market Analysis, By Application, Patient Monitoring

Figure 23: Market Analysis, By Application, Connected Imaging

Figure 24: Market Analysis, By Application, Others

Figure 25: Market Comparison Matrix, By Application

Figure 26: Market Attractiveness Analysis, By Application

Figure 27: Global Market Value Share Analysis, By Technology, 2022 and 2032

Figure 28: Market Analysis, By Technology, Bluetooth

Figure 29: Market Analysis, By Technology, Wi-Fi

Figure 30: Market Analysis, By Technology, NFC

Figure 31: Market Analysis, By Technology, Zigbee

Figure 32: Market Analysis, By Technology, RFID

Figure 33: Market Analysis, By Technology, Others (Cellular, Satellite, Zwave, EnOcean)

Figure 34: Market Comparison Matrix, By Technology

Figure 35: Market Attractiveness Analysis, By Technology

Figure 36: Global Market Value Share Analysis, By End-use, 2022 and 2032

Figure 37: Market Analysis, By End-use, Hospitals

Figure 38: Market Analysis, By End-use, Pharmaceuticals

Figure 39: Market Analysis, By End-use, Clinics & Laboratories

Figure 40: Market Comparison Matrix, By End-use

Figure 41: Market Attractiveness Analysis, By End-use

Figure 42: Market Analysis, By Region, North America

Figure 43: Market Analysis, By Region, Europe

Figure 44: Market Analysis, By Region, Asia Pacific

Figure 45: Market Analysis, By Region, Middle East, and Africa

Figure 46: Market Analysis, By Region, South America

Figure 47: Market Attractiveness Analysis, By Region

Figure 48: North America Market Size (US$ Billion) and Y-o-Y Growth (%) Forecast, 2015 to 2032

Figure 49: North America Market Value Share Analysis, By Component, 2022 and 2032

Figure 50: North America Market Value Share Analysis, By Application, 2022 and 2032

Figure 51: North America Market Value Share Analysis, By Technology, 2022 and 2032

Figure 52: North America Market Value Share Analysis, By End-use, 2022 and 2032

Figure 53: North America Market Value Share Analysis, By Country, 2022 and 2032

Figure 54: North America Market Attractiveness Analysis, By Component

Figure 55: North America Market Attractiveness Analysis, By Application

Figure 56: North America Market Attractiveness Analysis, By Technology

Figure 57: North America Market Attractiveness Analysis, By End-use

Figure 58: North America Market Attractiveness Analysis, By Country

Figure 59: Europe Market Size (US$ Billion) and Y-o-Y Growth (%) Forecast, 2015 to 2032

Figure 60: Europe Market Value Share Analysis, By Component, 2022 and 2032

Figure 61: Europe Market Value Share Analysis, By Application, 2022 and 2032

Figure 62: Europe Market Value Share Analysis, By Technology, 2022 and 2032

Figure 63: Europe Market Value Share Analysis, By End-use, 2022 and 2032

Figure 64: Europe Market Value Share Analysis, By Country, 2022 and 2032

Figure 65: Europe Market Attractiveness Analysis, By Component

Figure 66: Europe Market Attractiveness Analysis, By Application

Figure 67: Europe Market Attractiveness Analysis, By Technology

Figure 68: Europe Market Attractiveness Analysis, By End-use

Figure 69: Europe Market Attractiveness Analysis, By Country

Figure 70: Asia Pacific Market Size (US$ Billion) and Y-o-Y Growth (%) Forecast, 2015 to 2032

Figure 71: Asia Pacific Market Value Share Analysis, By Component, 2022 and 2032

Figure 72: Asia Pacific Market Value Share Analysis, By Application, 2022 and 2032

Figure 73: Asia Pacific Market Value Share Analysis, By Technology, 2022 and 2032

Figure 74: Asia Pacific Market Value Share Analysis, By End-use, 2022 and 2032

Figure 75: Asia Pacific Market Value Share Analysis, By Country, 2022 and 2032

Figure 76: Asia Pacific Market Attractiveness Analysis, By Component

Figure 77: Asia Pacific Market Attractiveness Analysis, By Application

Figure 78: Asia Pacific Market Attractiveness Analysis, By Technology

Figure 79: Asia Pacific Market Attractiveness Analysis, By End-use

Figure 80: Asia Pacific Market Attractiveness Analysis, By Country

Figure 81: Middle East & Africa Market Size (US$ Billion) and Y-o-Y Growth (%) Forecast, 2015 to 2032

Figure 82: Middle East & Africa Market Value Share Analysis, By Component, 2022 and 2032

Figure 83: Middle East & Africa Market Value Share Analysis, By Application, 2022 and 2032

Figure 84: Middle East & Africa Market Value Share Analysis, By Technology, 2022 and 2032

Figure 85: Middle East & Africa Market Value Share Analysis, By End-use, 2022 and 2032

Figure 86: Middle East & Africa Market Value Share Analysis, By Country, 2022 and 2032

Figure 87: Middle East & Africa Market Attractiveness Analysis, By Component

Figure 88: Middle East & Africa Market Attractiveness Analysis, By Application

Figure 89: Middle East & Africa Market Attractiveness Analysis, By Technology

Figure 90: Middle East & Africa Market Attractiveness Analysis, By End-use

Figure 91: Middle East & Africa Market Attractiveness Analysis, By Country

Figure 92: South America Market Size (US$ Billion) and Y-o-Y Growth (%) Forecast, 2015 to 2032

Figure 93: South America Market Value Share Analysis, By Component, 2022 and 2032

Figure 94: South America Market Value Share Analysis, By Application, 2022 and 2032

Figure 95: South America Market Value Share Analysis, By Technology, 2022 and 2032

Figure 96: South America Market Value Share Analysis, By End-use, 2022 and 2032

Figure 97: South America Market Value Share Analysis, By Country, 2022 and 2032

Figure 98: South America Market Attractiveness Analysis, By Component

Figure 99: South America Market Attractiveness Analysis, By Application

Figure 100: South America Market Attractiveness Analysis, By Technology

Figure 101: South America Market Attractiveness Analysis, By End-use

Figure 102: South America Market Attractiveness Analysis, By Country

Figure 103: Market Share Analysis (2021)

Recommendations

Healthcare

In Vitro Fertilization Banking Services Market

Published : March 2023

Healthcare

Keyhole Orthopaedic Surgery Market

Published : July 2022

Healthcare

Wearable Healthcare Devices Market

Published : May 2022

Healthcare

Patient Transportation Market

Published : May 2022

Explore Healthcare Insights

View Reports