Healthcare and Laboratory Labels Market
Market Insights on Healthcare and Laboratory Labels covering sales outlook, demand forecast & up-to-date key trends
Healthcare and Laboratory Labels Market By End-user (Pharmaceuticals, Nutraceuticals, Medical Devices, Blood Banks, Hospital Services, Laboratories) & Region Forecast to 2022-2030
Healthcare and Laboratory Labels Outlook (2022-2030)
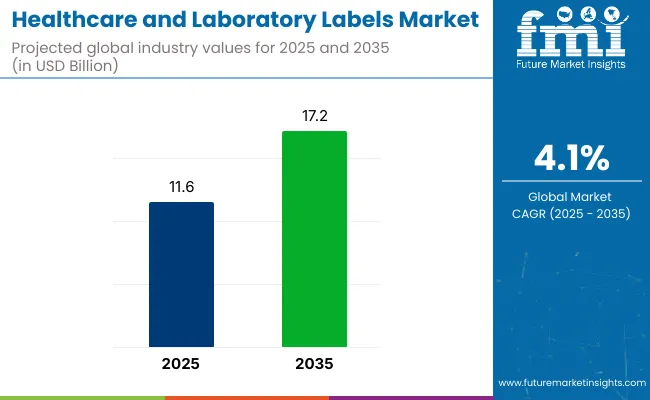
[179 Pages Report] The global healthcare and laboratory labels market stands at US$ 9.2 Bn as of the year 2022 and is expected to be worth US$ 13.5 Bn at a CAGR of 4.9% between 2022 and 2030.
Healthcare and Laboratory Market Size (2022) |
US$ 9.2 Bn |
Projected Market Value (2030) |
US$ 13.5 Bn |
Global Market Growth Rate (2022-2030) |
4.9% CAGR |
Collective Value Share: Top 5 Companies (2022E) |
12.6% |
Healthcare and laboratory labels market is projected to reach over US$ 13.5 Bn by 2030, with pharmaceutical industry being the end user at the growth forefront. Healthcare and laboratory labels market is projected to expand at CAGR of 4.9% during the forecast period (2020-2030).
The rising need for improved healthcare services has led to the development of new drugs and formulations and clinical research is forecast to play a prominent role in the growth of healthcare and laboratory labels market.
Let us know your requirement to get
100% FREE customization
Healthcare and Laboratory Labels Demand Analysis (2015 to 2021) Vs Market Outlook (2022 to 2030)
The UDI (Unique Device Identification), as the name suggests, is a system that is used to identify and mark medical devices within the healthcare supply chain. The US FDA, since the year 2013, mandated establishing a unique device identification system designed to adequately identify devices through distribution and use. Every UDI must be provided in a plain-text version and a form that uses automatic identification and data capture (AIDC) technology.
The UDI is also required to be directly marked on a device that is intended for more than one use, and needs to be reprocessed before each use. Dates on device labels and packages are to be presented in a standard format that is consistent with international practice and standards.
Besides, The IMDRF (International Medical Device Regulator Forum), and the European Commission are focusing on a globally harmonized and consistent approach that is expected to increase patient safety and help optimize patient care by proposing a harmonized legislation for Unique Device Identification (UDI), using global standards.
The unique device identification system offers a number of benefits that will be fully realized with the adoption and integration of UDIs into the health care delivery system. UDI application is expected to improve patient safety, facilitate medical device innovation.
In the forecast period, clinical mobility would be the solution to reduce the stress on the healthcare system and improve patient care. Use of technology in healthcare and laboratory labels is forecast to eliminate manual and error-prone procedures. This would enhance the accuracy of patient identification and overall visibility.
By using digital technology, the accuracy of patient identification and streamlined processes can be enhanced. Further, improving the quality of patient care and increasing overall visibility can be achieved by transmitting the data in real time to the clinical staff. This can reduce or even eliminate errors resulting in delivering critical time savings.
What catalyzes the demand for Healthcare and Laboratory Labels?
“Onus on Upsurge in Adoption of Medical Devices”
Medical device labeling supports patients or their caregivers in understanding the device; its operation and maintenance; the way it interacts with the body to accomplish its purpose and any safety or disposal issues. Medical device labeling is essential to assure safe and effective use of devices. It informs patients or their caregivers about proper use, risks, and benefits of the device in language they can understand.
Adequate directions for operating the devices are needed to make devices safe and effective. For instance, as more patients use complex medical devices at home, medical device labeling becomes necessary to better communicate with the person operating the device.
Medical device manufactures are incessantly looking for new devices owing to which they are heavily investing in research & development. The competition in medical industry is also pushing the manufacturers to heavily invest in research & development for new or updated devices. Spike in new discoveries and formulations is pushing the demand for medical device labels globally.
For instance, Brazil has a large growth potential in Latin America whereas Europe medical device market is highly contributed by Poland, Hungary and Russia.
Medical industry is increasingly adopting medical device labels owing to the fact that clinical trials or experiments can take place in multiple locations around the world. Due to this, one needs to print the information related to tracing the medical device along with storage & transportation, and handling in multiple languages.
Find your sweet spots for generating winning opportunities in this market.
Talk to AnalystWhat’s with the Millennials?
“Millennials prioritizing Healthcare Labelling”
Millennials come across as a generation that guides trends. Brands in the healthcare industry ought to prepare for millennial behaviors and attitudes regarding the way they consume and research before making purchase decisions. They like to interact with the brands that are open and maintain transparency by addressing environmental and socioeconomic issues.
Brands not aligning to these values are likely to be quickly replaced owing to the competition in the market.
For instance, health consciousness and desire for healthy lifestyle is driving the nutraceuticals market. Millennials making purchase decisions is now beyond the traditional drivers, that is taste, price or convenience. They are inclined towards brand authenticity and the perception of how the brands are impacting their life and world in a positive manner. Interest in clean labels is also a driver.
Thus, it becomes important for the manufacturers to label and promote their product in the right manner. This provides the brand owners lucrative opportunity to adopt something like app based labelling solutions, where one can easily find information about the product in detail.
How has Covid-19 impacted the healthcare and Laboratory Labels market?
“Covid-19 has facilitates a systematic approach”
COVID-19 has led to a sea change in consumers’ preferences and priorities as the focus now shifts towards the use of technology and contact-less healthcare. Digital integration in the healthcare and laboratory labels is anticipated to boost contact-less healthcare as it easily transmits data to the healthcare workers by minimizing the contact with the infected patient. Moreover, the data collected from the COVID-19 infected patient is very important for the ongoing and future research on the virus.
With limited healthcare professionals and increasing rates of infection of various ailments, it has become a difficult task to track, trace, and record data. Healthcare and laboratory labels are being widely used in the present scenario, right from admission to hospitals to swab testing.

A unified Market Research Subscription Platform, built for today's disparate research needs.
What are the Restraints to Healthcare and Laboratory Labels Market?
“Sternness in Government Regulations to halt the Momentum”
Healthcare and laboratory labelling has become difficult for manufacturers for many reasons such as regulations from government bodies to ensure compliance, increased competent authority surveillance, language requirements, and many more.
Medical device labelling has become one of the difficult issues for manufacturers, and the main reason of this is the insistence on national language by individual countries. For medical devices and diagnostics that are to be sold across the EU and non-EU countries, legal difficulties raise their head. There is limited space on labels and, large information needs to be included. Translations may be required to be technically accurate, but most of the time it is literal.
For some medical devices, the standard requires that markings must be placed directly on the device. In vitro diagnostic (IVD) companies are considering to use separate non-U.S. and U.S. labels. The U.S. labels would contain no symbols, and the non-U.S. labels for the rest of the world would contain symbols. Labelling is a critical component of device and provides comprehensive requirements for marking and labelling.
When these medical labels do not meet US FDA regulations then the devices are considered misbranded, falsely labelled or misleading, including promotion for unapproved uses. Thus, the medical device labels need to comply with all essential requirements failing which they would face penalties for non-compliance with the regulations.
Ever-changing end user requirements related to medical device labels’ materials, dimensions, printing etc. are also factors restraining the medical device labels manufacturers. Variable data printing, text font formats, state regulations might negatively affect the healthcare and laboratory labels market.
Category-wise Insights?
“Nutraceutical to rule the Roost”
Demand for healthcare and laboratory labels depends on the various end-users. The end users such as pharmaceuticals, nutraceuticals, medical devices, blood banks, hospital services and laboratories are likely to drive the demand for healthcare and laboratory labels.
Demographic shifts and societal changes are intensifying pressures on health systems and demanding new directions in the delivery of healthcare. Ageing populations in both emerging and developed nations are driving up the demand for healthcare.
Significant growth in the middle class population has led to accelerated urbanization and access to middle-class comforts. This is likely to promote sedentary lifestyle changes that will inevitably lead to greater incidence of obesity, diabetes and other costly health conditions, thereby needing more of healthcare and laboratory labels.
How about Country-wise Insights?
“The Asia-Pacific to witness healthy Turbulence”
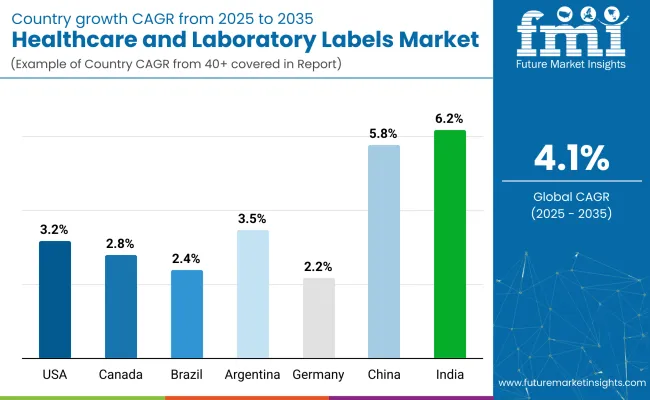
Europe and Asia Pacific account for maximum growth owing to increasing number of players in the region. Europe is led by the UK, Belgium, Denmark, Italy, Germany, and France. The demand for advanced pharmaceuticals and nutraceuticals to improve healthcare services is expected to drive development of new formulations and new drug in this region.
This is likely to drive clinical research market in NAFTA countries which is anticipated to fuel the demand of healthcare and laboratory labels in the years to come. In countries like India, China, Malaysia, and Thailand, rising population along with increase in medical tourism are holding the hopes high.
Competitive Landscape
The healthcare and laboratory labels market is a fragmented market. The key players operating in the market are focusing on expanding their reach globally, diversifying their product portfolio, and rapid product development to gain competitive edge.
- Pdc Healthcare has its V-Notch Secondary Labels with BD Vacutainer Plus Plastic Tubes. They make way for appropriate label placement every time.
Report Scope
Attribute |
Details |
Forecast Period |
2022-2030 |
Historical Data Available for |
2015-2021 |
Market Analysis |
US$ Mn/Bn for Value |
Key Regions Covered |
North America, Latin America, Europe, South Asia, East Asia, Oceania, and the Middle East & Africa |
Key Countries Covered |
U.S., Canada, Brazil, Mexico, Germany, U.K., France, Italy, Spain, Benelux, Russia, China, Japan, South Korea, India, Thailand, Indonesia, Malaysia, Singapore, China, Japan, South Korea, Australia, New Zealand, Turkey, Egypt, North Africa, South Africa, and GCC Countries |
Key Market Segments Covered |
End-user and Region |
Key Companies Profiled |
|
Pricing |
Available upon Request |
Key Segments Covered in healthcare and Laboratory Labels Industry Research
Market By End-user :
- Pharmaceuticals
- Nutraceuticals
- Medical Devices
- Blood Banks
- Hospital Services
- Laboratories
By Region :
- North America Healthcare and Laboratory Labels Market
- Latin America Healthcare and Laboratory Labels Market
- Europe Healthcare and Laboratory Labels Market
- East Asia Healthcare and Laboratory Labels Market
- South Asia Healthcare and Laboratory Labels Market
- Oceania Healthcare and Laboratory Labels Market
- Middle East & Africa (MEA) Healthcare and Laboratory Labels Market
Frequently Asked Questions
The global healthcare and laboratory labels market is worth US$ 9 Bn.
The market for healthcare and laboratory labels is expected to reach US$ 13.5 Bn by 2030, expanding at a CAGR of 4.9%.
For 2015-2021, healthcare and laboratory labels’ sales expanded at the rate of 4.6%.
Avery Dennison Corporation, CCL Industries Inc., 3M Company, Multi-Color Corporation,UPM Raflatac Corporation, Brady Corporation, Sato Holdings Corporation, Weber Packaging Solutions, Inc., Schreiner Group GmbH & Co. KG, Diagramm Halbach GmbH & Co. KG, The Aenova Group, Shamrock Labels, Medline Industries, Inc., PlatinumCode, United Ad Label, Adampak Pte Ltd., Advance Labelling Systems Limited, Majestic Labels CC, QLM Label Makers Pte Ltd., Chicago Tag & Label, Inc.
North America holds 30.1% of the market share.
Table of Content
1. Executive Summary
1.1. Global Market Outlook
1.2. Analysis and Recommendations
2. Market Overview
2.1. Market Coverage/Taxonomy
2.2. Market Definition
3. Key Market Trends
3.1. Product Innovation Trends
3.2. Business Trends
3.3. Region-wise Trends
4. Key Success Factors
4.1. Product Adoption Analysis
4.2. Promotional Strategies Adopted by Key Players
5. Impact of Covid-19 (Analysis and Forecast)
5.1. Current Statistics and Probable Future Impact
5.2. Current Economic Projection – GDP/GVA and Probable Impact
5.3. Comparison of SAARs and Market Recovery, for Key Countries
5.4. Comparison to 2008 Financial Crisis and Market Recovery, for Key Countries
5.5. Impact of COVID-19 on Healthcare and Laboratory Labels Market
5.6. Comparison of Previous and Current Forecast
5.7. Recovery Scenario – Short-term, Mid-term and Long-term Impact
6. Global Healthcare and Laboratory Labels Market Demand Analysis 2015–2021 and Forecast, 2022–2030
6.1. Historical Market Volume (Sq M.) Analysis, 2015–2021
6.2. Current and Future Market Volume (Sq M.) Projections, 2022–2030
6.3. Y-o-Y Growth Trend Analysis
7. Global Healthcare and Laboratory Labels Market - Pricing Analysis
7.1. Regional Pricing Analysis
7.2. Pricing Break-up
7.3. Global Average Pricing Analysis Benchmark
8. Global Healthcare and Laboratory Labels Market Demand (Value in US$ Mn) Analysis 2015–2021 and Forecast, 2022–2030
8.1. Historical Market Value (US$ Mn) Analysis, 2015–2021
8.2. Current and Future Market Value (US$ Mn) Projections, 2022–2030
8.2.1. Y-o-Y Growth Trend Analysis
8.2.2. Absolute $ Opportunity Analysis
9. Market Background
9.1. Global Economic Outlook
9.2. Global Packaging Industry Outlook
9.3. Comparative Analysis
9.4. Macro-Economic Factors
9.4.1. Global GDP Growth Outlook
9.4.2. Manufacture Value Added (MVA)
9.5. Forecast Factors - Relevance & Impact
9.5.1. Global Packaging Industry Growth
9.5.2. Per Capita Healthcare Expenditure
9.5.3. GDP Growth- Regional
9.6. Value Chain
9.6.1. Key Participants
9.6.1.1. Raw Material Suppliers
9.6.1.2. Healthcare and Laboratory Labels Manufacturers
9.6.1.3. Distributors
9.6.2. Profitability Margin
9.7. Market Dynamics
9.7.1. Drivers
9.7.2. Restraints
9.7.3. Opportunity Analysis
10. Global Healthcare and Laboratory Labels Market Analysis 2015–2021 and Forecast 2022–2030, By Material
10.1. Introduction
10.2. Historical Market Size (US$ Mn) and Volume (Sq M.) Analysis By Material, 2015–2021
10.3. Current and Future Market Size (US$ Mn) and Volume (Sq M.) Analysis and Forecast By Material, 2022–2030
10.3.1. Polyolefin
10.3.2. PET
10.3.3. PVC
10.3.4. Paper
10.3.5. Others
10.3.6. Market Attractiveness Analysis By Material
11. Global Healthcare and Laboratory Labels Market Analysis 2015–2021 and Forecast 2022–2030, By End-user
11.1. Introduction
11.2. Historical Market Size (US$ Mn) and Volume (Sq M.) Analysis By End-user, 2015–2021
11.3. Current and Future Market Size (US$ Mn) and Volume (Sq M.) Analysis and Forecast By End-user, 2022–2030
11.3.1. Pharmaceutical
11.3.2. Nutraceutical
11.3.3. Medical Devices
11.3.4. Blood Bank
11.3.5. Hospital Services
11.3.6. Laboratory Labels
11.4. Market Attractiveness Analysis By End-user
12. Global Healthcare and Laboratory Labels Market Analysis 2015–2021 and Forecast 2022–2030, by Region
12.1. Introduction
12.2. Historical Market Size (US$ Mn) and Volume (Sq M.) Analysis By Region, 2015–2021
12.3. Current Market Size (US$ Mn) and Volume (Sq M.) Analysis and Forecast By Region, 2022–2030
12.3.1. North America
12.3.2. Latin America
12.3.3. Europe
12.3.4. Middle East and Africa (MEA)
12.3.5. East Asia
12.3.6. South Asia
12.3.7. Oceania
12.4. Market Attractiveness Analysis By Region
13. North America Healthcare and Laboratory Labels Market Analysis 2015–2021 and Forecast 2022–2030
13.1. Introduction
13.2. Historical Market Size (US$ Mn) and Volume (Sq M.) Trend Analysis By Market Taxonomy, 2015–2021
13.3. Market Size (US$ Mn) and Volume (Sq M.) Forecast By Market Taxonomy, 2022–2030
13.3.1. By Country
13.3.1.1. U.S.
13.3.1.2. Canada
13.3.2. By End-user
13.3.3. By Material
13.4. Market Attractiveness Analysis
13.4.1. By Country
13.4.2. By End-user
13.4.3. By Material
14. Latin America Healthcare and Laboratory Labels Market Analysis 2015–2021 and Forecast 2022–2030
14.1. Introduction
14.2. Historical Market Size (US$ Mn) and Volume (Sq M.) Trend Analysis By Market Taxonomy, 2015–2021
14.3. Market Size (US$ Mn) and Volume (Sq M.) Forecast By Market Taxonomy, 2022–2030
14.3.1. By Country
14.3.1.1. Brazil
14.3.1.2. Mexico
14.3.1.3. Argentina
14.3.1.4. Rest of Latin America
14.3.2. By End-user
14.3.3. By Material
14.4. Market Attractiveness Analysis
14.4.1. By Country
14.4.2. By End-user
14.4.3. By Material
15. Europe Healthcare and Laboratory Labels Market Analysis 2015–2021 and Forecast 2022–2030
15.1. Introduction
15.2. Historical Market Size (US$ Mn) and Volume (Sq M.) Trend Analysis By Market Taxonomy, 2015–2021
15.3. Market Size (US$ Mn) and Volume (Sq M.) Forecast By Market Taxonomy, 2022–2030
15.3.1. By Country
15.3.1.1. Germany
15.3.1.2. Italy
15.3.1.3. France
15.3.1.4. U.K.
15.3.1.5. Spain
15.3.1.6. BENELUX
15.3.1.7. Russia
15.3.1.8. Rest of Europe
15.3.2. By End-user
15.3.3. By Material
15.4. Market Attractiveness Analysis
15.4.1. By Country
15.4.2. By End-user
15.4.3. By Material
16. South Asia Healthcare and Laboratory Labels Market Analysis 2015–2021 and Forecast 2022–2030
16.1. Introduction
16.2. Historical Market Size (US$ Mn) and Volume (Sq M.) Trend Analysis By Market Taxonomy, 2015–2021
16.3. Market Size (US$ Mn) and Volume (Sq M.) Forecast By Market Taxonomy, 2022–2030
16.3.1. By Country
16.3.1.1. India
16.3.1.2. Thailand
16.3.1.3. Indonesia
16.3.1.4. Malaysia
16.3.1.5. Rest of South Asia
16.3.2. By End-user
16.3.3. By Material
16.4. Market Attractiveness Analysis
16.4.1. By Country
16.4.2. By End-user
16.4.3. By Material
17. East Asia Healthcare and Laboratory Labels Market Analysis 2015–2021 and Forecast 2022–2030
17.1. Introduction
17.2. Historical Market Size (US$ Mn) and Volume (Sq M.) Trend Analysis By Market Taxonomy, 2015–2021
17.3. Market Size (US$ Mn) and Volume (Sq M.) Forecast By Market Taxonomy, 2022–2030
17.3.1. By Country
17.3.1.1. China
17.3.1.2. Japan
17.3.1.3. South Korea
17.3.2. By End-user
17.3.3. By Material
17.4. Market Attractiveness Analysis
17.4.1. By Country
17.4.2. By End-user
17.4.3. By Material
18. Oceania Healthcare and Laboratory Labels Market Analysis 2015–2021 and Forecast 2022–2030
18.1. Introduction
18.2. Historical Market Size (US$ Mn) and Volume (Sq M.) Trend Analysis By Market Taxonomy, 2015–2021
18.3. Market Size (US$ Mn) and Volume (Sq M.) Forecast By Market Taxonomy, 2022–2030
18.3.1. By Country
18.3.1.1. Australia
18.3.1.2. New Zealand
18.3.2. By End-user
18.3.3. By Material
18.4. Market Attractiveness Analysis
18.4.1. By Country
18.4.2. By End-user
18.4.3. By Material
19. Middle East and Africa Healthcare and Laboratory Labels Market Analysis 2015–2021 and Forecast 2022–2030
19.1. Introduction
19.2. Historical Market Size (US$ Mn) and Volume (Sq M.) Trend Analysis By Market Taxonomy, 2015–2021
19.3. Market Size (US$ Mn) and Volume (Sq M.) Forecast By Market Taxonomy, 2022–2030
19.3.1. By Country
19.3.1.1. GCC Countries
19.3.1.2. Turkey
19.3.1.3. Northern Africa
19.3.1.4. South Africa
19.3.1.5. Rest of Middle East and Africa
19.3.2. By End-user
19.3.3. By Material
19.4. Market Attractiveness Analysis
19.4.1. By Country
19.4.2. By End-user
19.4.3. By Material
20. Healthcare and Laboratory Labels Market Country wise Analysis 2022 and 2030
20.1. USA Healthcare and Laboratory Labels Market Analysis
20.1.1. Market Volume (Sq M.) and Value (US$ Mn) Analysis and Forecast by Market Taxonomy
20.1.1.1. By End-user
20.1.1.2. By Material
20.2. Canada Healthcare and Laboratory Labels Market Analysis
20.2.1. Market Volume (Sq M.) and Value (US$ Mn) Analysis and Forecast by Market Taxonomy
20.2.1.1. By End-user
20.2.1.2. By Material
20.3. Brazil Healthcare and Laboratory Labels Market Analysis
20.3.1. Market Volume (Sq M.) and Value (US$ Mn) Analysis and Forecast by Market Taxonomy
20.3.1.1. By End-user
20.3.1.2. By Material
20.4. Mexico Healthcare and Laboratory Labels Market Analysis
20.4.1. Market Volume (Sq M.) and Value (US$ Mn) Analysis and Forecast by Market Taxonomy
20.4.1.1. By End-user
20.4.1.2. By Material
20.5. Argentina Healthcare and Laboratory Labels Market Analysis
20.5.1. Market Volume (Sq M.) and Value (US$ Mn) Analysis and Forecast by Market Taxonomy
20.5.1.1. By End-user
20.5.1.2. By Material
20.6. Germany Healthcare and Laboratory Labels Market Analysis
20.6.1. Market Volume (Sq M.) and Value (US$ Mn) Analysis and Forecast by Market Taxonomy
20.6.1.1. By End-user
20.6.1.2. By Material
20.7. Italy Healthcare and Laboratory Labels Market Analysis
20.7.1. Market Volume (Sq M.) and Value (US$ Mn) Analysis and Forecast by Market Taxonomy
20.7.1.1. By End-user
20.7.1.2. By Material
20.8. France Healthcare and Laboratory Labels Market Analysis
20.8.1. Market Volume (Sq M.) and Value (US$ Mn) Analysis and Forecast by Market Taxonomy
20.8.1.1. By End-user
20.8.1.2. By Material
20.9. U.K. Healthcare and Laboratory Labels Market Analysis
20.9.1. Market Volume (Sq M.) and Value (US$ Mn) Analysis and Forecast by Market Taxonomy
20.9.1.1. By End-user
20.9.1.2. By Material
20.10. Spain Healthcare and Laboratory Labels Market Analysis
20.10.1. Market Volume (Sq M.) and Value (US$ Mn) Analysis and Forecast by Market Taxonomy
20.10.1.1. By End-user
20.10.1.2. By Material
20.11. Benelux Healthcare and Laboratory Labels Market Analysis
20.11.1. Market Volume (Sq M.) and Value (US$ Mn) Analysis and Forecast by Market Taxonomy
20.11.1.1. By End-user
20.11.1.2. By Material
20.12. Russia Healthcare and Laboratory Labels Market Analysis
20.12.1. Market Volume (Sq M.) and Value (US$ Mn) Analysis and Forecast by Market Taxonomy
20.12.1.1. By End-user
20.12.1.2. By Material
20.13. GCC Countries Healthcare and Laboratory Labels Market Analysis
20.13.1. Market Volume (Sq M.) and Value (US$ Mn) Analysis and Forecast by Market Taxonomy
20.13.1.1. By End-user
20.13.1.2. By Material
20.14. Turkey Healthcare and Laboratory Labels Market Analysis
20.14.1. Market Volume (Sq M.) and Value (US$ Mn) Analysis and Forecast by Market Taxonomy
20.14.1.1. By End-user
20.14.1.2. By Material
20.15. Northern Africa Healthcare and Laboratory Labels Market Analysis
20.15.1. Market Volume (Sq M.) and Value (US$ Mn) Analysis and Forecast by Market Taxonomy
20.15.1.1. By End-user
20.15.1.2. By Material
20.16. South Africa Healthcare and Laboratory Labels Market Analysis
20.16.1. Market Volume (Sq M.) and Value (US$ Mn) Analysis and Forecast by Market Taxonomy
20.16.1.1. By End-user
20.16.1.2. By Material
20.17. China Healthcare and Laboratory Labels Market Analysis
20.17.1. Market Volume (Sq M.) and Value (US$ Mn) Analysis and Forecast by Market Taxonomy
20.17.1.1. By End-user
20.17.1.2. By Material
20.18. Japan Healthcare and Laboratory Labels Market Analysis
20.18.1. Market Volume (Sq M.) and Value (US$ Mn) Analysis and Forecast by Market Taxonomy
20.18.1.1. By End-user
20.18.1.2. By Material
20.19. South Korea Healthcare and Laboratory Labels Market Analysis
20.19.1. Market Volume (Sq M.) and Value (US$ Mn) Analysis and Forecast by Market Taxonomy
20.19.1.1. By End-user
20.19.1.2. By Material
20.20. India Healthcare and Laboratory Labels Market Analysis
20.20.1. Market Volume (Sq M.) and Value (US$ Mn) Analysis and Forecast by Market Taxonomy
20.20.1.1. By End-user
20.20.1.2. By Material
20.21. Thailand Countries Healthcare and Laboratory Labels Market Analysis
20.21.1. Market Volume (Sq M.) and Value (US$ Mn) Analysis and Forecast by Market Taxonomy
20.21.1.1. By End-user
20.21.1.2. By Material
20.22. Indonesia Healthcare and Laboratory Labels Market Analysis
20.22.1. Market Volume (Sq M.) and Value (US$ Mn) Analysis and Forecast by Market Taxonomy
20.22.1.1. By End-user
20.22.1.2. By Material
20.23. Malaysia Healthcare and Laboratory Labels Market Analysis
20.23.1. Market Volume (Sq M.) and Value (US$ Mn) Analysis and Forecast by Market Taxonomy
20.23.1.1. By End-user
20.23.1.2. By Material
20.24. Australia Healthcare and Laboratory Labels Market Analysis
20.24.1. Market Volume (Sq M.) and Value (US$ Mn) Analysis and Forecast by Market Taxonomy
20.24.1.1. By End-user
20.24.1.2. By Material
21. Market Structure Analysis
21.1. Market Analysis by Tier of Healthcare and Laboratory Labels Companies
21.2. Market Concentration
21.3. Market Share Analysis of Top Players
21.4. Market Presence Analysis
21.4.1. By Regional footprint of Players
21.4.2. Product foot print by Players
21.4.3. Channel Foot Print by Players
22. Competition Analysis
22.1. Competition Dashboard
22.2. Competition Benchmarking
22.3. Competition Deep Dive (Key Players)
22.3.1. Avery Dennison Corporation
22.3.1.1. Overview
22.3.1.2. Product Portfolio
22.3.1.3. Profitability by Market Segments
22.3.1.4. Sales Footprint
22.3.1.5. Strategy Overview
22.3.1.5.1. Marketing Strategy
22.3.1.5.2. Product Strategy
22.3.1.5.3. Channel Strategy
22.3.2. CCL Industries
22.3.2.1. Overview
22.3.2.2. Product Portfolio
22.3.2.3. Profitability by Market Segments
22.3.2.4. Sales Footprint
22.3.2.5. Strategy Overview
22.3.2.5.1. Marketing Strategy
22.3.2.5.2. Product Strategy
22.3.2.5.3. Channel Strategy
22.3.3. 3M Company
22.3.3.1. Overview
22.3.3.2. Product Portfolio
22.3.3.3. Profitability by Market Segments
22.3.3.4. Sales Footprint
22.3.3.5. Strategy Overview
22.3.3.5.1. Marketing Strategy
22.3.3.5.2. Product Strategy
22.3.3.5.3. Channel Strategy
22.3.4. Multi-Color Corporation
22.3.4.1. Overview
22.3.4.2. Product Portfolio
22.3.4.3. Profitability by Market Segments
22.3.4.4. Sales Footprint
22.3.4.5. Strategy Overview
22.3.4.5.1. Marketing Strategy
22.3.4.5.2. Product Strategy
22.3.4.5.3. Channel Strategy
22.3.5. UPM Raflatac
22.3.5.1. Overview
22.3.5.2. Product Portfolio
22.3.5.3. Profitability by Market Segments
22.3.5.4. Sales Footprint
22.3.5.5. Strategy Overview
22.3.5.5.1. Marketing Strategy
22.3.5.5.2. Product Strategy
22.3.5.5.3. Channel Strategy
22.3.6. BRADY Corp
22.3.6.1. Overview
22.3.6.2. Product Portfolio
22.3.6.3. Profitability by Market Segments
22.3.6.4. Sales Footprint
22.3.6.5. Strategy Overview
22.3.6.5.1. Marketing Strategy
22.3.6.5.2. Product Strategy
22.3.6.5.3. Channel Strategy
22.3.7. Sato Holdings Corporation
22.3.7.1. Overview
22.3.7.2. Product Portfolio
22.3.7.3. Profitability by Market Segments
22.3.7.4. Sales Footprint
22.3.7.5. Strategy Overview
22.3.7.5.1. Marketing Strategy
22.3.7.5.2. Product Strategy
22.3.7.5.3. Channel Strategy
22.3.8. Weber Packaging Solutions, Inc.
22.3.8.1. Overview
22.3.8.2. Product Portfolio
22.3.8.3. Profitability by Market Segments
22.3.8.4. Sales Footprint
22.3.8.5. Strategy Overview
22.3.8.5.1. Marketing Strategy
22.3.8.5.2. Product Strategy
22.3.8.5.3. Channel Strategy
22.3.9. Schreiner Group GmbH & Co.
22.3.9.1. Overview
22.3.9.2. Product Portfolio
22.3.9.3. Profitability by Market Segments
22.3.9.4. Sales Footprint
22.3.9.5. Strategy Overview
22.3.9.5.1. Marketing Strategy
22.3.9.5.2. Product Strategy
22.3.9.5.3. Channel Strategy
22.3.10. Diagramm Halbach GmbH & Co. KG
22.3.10.1. Overview
22.3.10.2. Product Portfolio
22.3.10.3. Profitability by Market Segments
22.3.10.4. Sales Footprint
22.3.10.5. Strategy Overview
22.3.10.5.1. Marketing Strategy
22.3.10.5.2. Product Strategy
22.3.10.5.3. Channel Strategy
22.3.11. The Aenova Group
22.3.11.1. Overview
22.3.11.2. Product Portfolio
22.3.11.3. Profitability by Market Segments
22.3.11.4. Sales Footprint
22.3.11.5. Strategy Overview
22.3.11.5.1. Marketing Strategy
22.3.11.5.2. Product Strategy
22.3.11.5.3. Channel Strategy
22.3.12. Shamrock Labels
22.3.12.1. Overview
22.3.12.2. Product Portfolio
22.3.12.3. Profitability by Market Segments
22.3.12.4. Sales Footprint
22.3.12.5. Strategy Overview
22.3.12.5.1. Marketing Strategy
22.3.12.5.2. Product Strategy
22.3.12.5.3. Channel Strategy
22.3.13. Medline Industries, Inc.
22.3.13.1. Overview
22.3.13.2. Product Portfolio
22.3.13.3. Profitability by Market Segments
22.3.13.4. Sales Footprint
22.3.13.5. Strategy Overview
22.3.13.5.1. Marketing Strategy
22.3.13.5.2. Product Strategy
22.3.13.5.3. Channel Strategy
22.3.14. Chicago Tag & Label, Inc.
22.3.14.1. Overview
22.3.14.2. Product Portfolio
22.3.14.3. Profitability by Market Segments
22.3.14.4. Sales Footprint
22.3.14.5. Strategy Overview
22.3.14.5.1. Marketing Strategy
22.3.14.5.2. Product Strategy
22.3.14.5.3. Channel Strategy
22.3.15. Platinum Code
22.3.15.1. Overview
22.3.15.2. Product Portfolio
22.3.15.3. Profitability by Market Segments
22.3.15.4. Sales Footprint
22.3.15.5. Strategy Overview
22.3.15.5.1. Marketing Strategy
22.3.15.5.2. Product Strategy
22.3.15.5.3. Channel Strategy
22.3.16. United Ad label
22.3.16.1. Overview
22.3.16.2. Product Portfolio
22.3.16.3. Profitability by Market Segments
22.3.16.4. Sales Footprint
22.3.16.5. Strategy Overview
22.3.16.5.1. Marketing Strategy
22.3.16.5.2. Product Strategy
22.3.16.5.3. Channel Strategy
22.3.17. Adampak Private Limited
22.3.17.1. Overview
22.3.17.2. Product Portfolio
22.3.17.3. Profitability by Market Segments
22.3.17.4. Sales Footprint
22.3.17.5. Strategy Overview
22.3.17.5.1. Marketing Strategy
22.3.17.5.2. Product Strategy
22.3.17.5.3. Channel Strategy
22.3.18. Advance Labelling Systems Limited
22.3.18.1. Overview
22.3.18.2. Product Portfolio
22.3.18.3. Profitability by Market Segments
22.3.18.4. Sales Footprint
22.3.18.5. Strategy Overview
22.3.18.5.1. Marketing Strategy
22.3.18.5.2. Product Strategy
22.3.18.5.3. Channel Strategy
22.3.19. Majestic Labels CC
22.3.19.1. Overview
22.3.19.2. Product Portfolio
22.3.19.3. Profitability by Market Segments
22.3.19.4. Sales Footprint
22.3.19.5. Strategy Overview
22.3.19.5.1. Marketing Strategy
22.3.19.5.2. Product Strategy
22.3.19.5.3. Channel Strategy
22.3.20. QLM Label Makers Private Limited
22.3.20.1. Overview
22.3.20.2. Product Portfolio
22.3.20.3. Profitability by Market Segments
22.3.20.4. Sales Footprint
22.3.20.5. Strategy Overview
22.3.20.5.1. Marketing Strategy
22.3.20.5.2. Product Strategy
22.3.20.5.3. Channel Strategy
23. Assumptions and Acronyms Used
24. Research Methodology
Let us know your requirement to get
100% FREE customization
List of Tables
Table 01: Healthcare and Laboratory Label Market Volume by Material
Table 02: Healthcare and Laboratory Label Market Value by Material
Table 03: Healthcare and Laboratory Label Market Volume by End-user
Table 04: Healthcare and Laboratory Label Market Value by End-user
Table 05: Healthcare and Laboratory Label Market Volume by Region
Table 06: Healthcare and Laboratory Label Market Value by Region
Table 07: North America Healthcare and Laboratory Label Market Volume by Material
Table 08: North America Healthcare and Laboratory Label Market Value by Material
Table 09: North America Healthcare and Laboratory Label Market Volume by End-user
Table 10: North America Healthcare and Laboratory Label Market Value by End-user
Table 11: North America Healthcare and Laboratory Label Market Volume by Country
Table 12: North America Healthcare and Laboratory Label Market Value by Country
Table 13: Latin America Healthcare and Laboratory Label Market Volume by Material
Table 14: Latin America Healthcare and Laboratory Label Market Value by Material
Table 15: Latin America Healthcare and Laboratory Label Market Volume by End-user
Table 16: Latin America Healthcare and Laboratory Label Market Value by End-user
Table 17: Latin America Healthcare and Laboratory Label Market Volume by Country
Table 18: Latin America Healthcare and Laboratory Label Market Value by Country
Table 19: Europe Healthcare and Laboratory Label Market Volume by Material
Table 20: Europe Healthcare and Laboratory Label Market Value by Material
Table 21: Europe Healthcare and Laboratory Label Market Volume by End-user
Table 22: Europe Healthcare and Laboratory Label Market Value by End-user
Table 23: Europe Healthcare and Laboratory Label Market Volume by Country
Table 24: Europe Healthcare and Laboratory Label Market Value by Country
Table 25: South Asia Healthcare and Laboratory Label Market Volume by Material
Table 26: South Asia Healthcare and Laboratory Label Market Value by Material
Table 27: South Asia Healthcare and Laboratory Label Market Volume by End-user
Table 28 : South Asia Healthcare and Laboratory Label Market Value by End-user
Table 29: South Asia Healthcare and Laboratory Label Market Volume by Country
Table 30: South Asia Healthcare and Laboratory Label Market Value by Country
Table 31: East Asia Healthcare and Laboratory Label Market Volume by Material
Table 32: East Asia Healthcare and Laboratory Label Market Value by Material
Table 33: East Asia Healthcare and Laboratory Label Market Volume by End-user
Table 34: East Asia Healthcare and Laboratory Label Market Value by End-user
Table 35: East Asia Healthcare and Laboratory Label Market Volume by Country
Table 36: East Asia Healthcare and Laboratory Label Market Value by Country
Table 37: Oceania Healthcare and Laboratory Label Market Volume by Material
Table 38: Oceania Healthcare and Laboratory Label Market Value by Material
Table 39: Oceania Healthcare and Laboratory Label Market Volume by End-user
Table 40: Oceania Healthcare and Laboratory Label Market Value by End-user
Table 41: Oceania Healthcare and Laboratory Label Market Volume by Country
Table 42: Oceania Healthcare and Laboratory Label Market Value by Country
Table 43: MEA Healthcare and Laboratory Label Market Volume by Material
Table 44: MEA Healthcare and Laboratory Label Market Value by Material
Table 45: MEA Healthcare and Laboratory Label Market Volume by End-user
Table 46: MEA Healthcare and Laboratory Label Market Value by End-user
Table 47: MEA Healthcare and Laboratory Label Market Volume by Country
Table 48: MEA Healthcare and Laboratory Label Market Value by Country
Table No 49: United States Healthcare and Laboratory Labels Market Analysis by Material and End-user
Table No 50 : Canada Healthcare and Laboratory Labels Market Analysis by Material and End-user
Table No 51 : Brazil Healthcare and Laboratory Labels Market Analysis by Material and End-user
Table No 52 : Mexico Healthcare and Laboratory Labels Market Analysis by Material and End-user
Table No 53 : Argentina Healthcare and Laboratory Labels Market Analysis by Material and End-user
Table No 54 : Germany Healthcare and Laboratory Labels Market Analysis by Material and End-user
Table No 55 : Italy Healthcare and Laboratory Labels Market Analysis by Material and End-user
Table No 56 : France Healthcare and Laboratory Labels Market Analysis by Material and End-user
Table No 57 : UK Healthcare and Laboratory Labels Market Analysis by Material and End-user
Table No 58 : Spain Healthcare and Laboratory Labels Market Analysis by Material and End-user
Table No 59: Benelux Healthcare and Laboratory Labels Market Analysis by Material and End-user
Table No 60: Russia Healthcare and Laboratory Labels Market Analysis by Material and End-user
Table No 61: GCC Countries Healthcare and Laboratory Labels Market Analysis by Material and End-user
Table No 62: Turkey Healthcare and Laboratory Labels Market Analysis by Material and End-user
Table No 63: Northern Africa Healthcare and Laboratory Labels Market Analysis by Material and End-user
Table No 64: South Africa Healthcare and Laboratory Labels Market Analysis by Material and End-user
Table No 65: China Healthcare and Laboratory Labels Market Analysis by Material and End-user
Table No 66: Japan Healthcare and Laboratory Labels Market Analysis by Material and End-user
Table No 67: South Korea Healthcare and Laboratory Labels Market Analysis by Material and End-user
Table No 68: South Korea Healthcare and Laboratory Labels Market Analysis by Material and End-user
Table No 69: Thailand Healthcare and Laboratory Labels Market Analysis by Material and End-user
Table No 70: Indonesia Healthcare and Laboratory Labels Market Analysis by Material and End-user
Table No 71: Malaysia Healthcare and Laboratory Labels Market Analysis by Material and End-user
Table No 72: Australia Healthcare and Laboratory Labels Market Analysis by Material and End-user
Find your sweet spots for generating winning opportunities in this market.
Talk to AnalystList of Charts
Figure 01: Global Healthcare and Laboratory Labels Market Attractiveness Analysis by Material 2022(E) - 2030(F)
Figure 02: Global Healthcare and Laboratory Labels Market Value Share by Material 2022(E) & 2030(F)
Figure 03: Global Healthcare and Laboratory Labels Market Attractiveness Analysis by End-user 2022(E) - 2030(F)
Figure 04: Global Healthcare and Laboratory Labels Market Value Share by End-user 2022(E) & 2030(F)
Figure 05: Global Healthcare and Laboratory Labels Market Incremental Opportunity (US$ Mn)
Figure 06: Global Healthcare and Laboratory Labels Market Growth by Region
Figure 07: North America Healthcare and Laboratory Label Market Value(US$ Mn) and Volume (Mn Sq. M) analysis, 2015(A) – 2021(A)
Figure 08: North America Healthcare and Laboratory Label Market Value(US$ Mn) and Volume (Mn Sq. M) Forecast, 2022 (E) -2030 (F)
Figure 09: North America Healthcare and Laboratory Labels Market Share Analysis, by Country, 2022E & 2030F
Figure 10: North America Healthcare and Laboratory Labels Market Share Analysis, by Material, 2022E & 2030F
Figure 11: North America Healthcare and Laboratory Labels Market Share Analysis, by End-user, 2022E & 2030F
Figure 12: North America Healthcare and Laboratory Labels Market Attractiveness Analysis by Country 2022(E) - 2030(F)
Figure 13: North America Healthcare and Laboratory Labels Market Attractiveness Analysis by Material 2022(E) - 2030(F)
Figure 14: North America Healthcare and Laboratory Labels Market Attractiveness Analysis by End-user 2022(E) - 2030(F)
Figure 15: Latin America Healthcare and Laboratory Label Market Value(US$ Mn) and Volume (Mn Sq. M) analysis, 2015(A) – 2021(A)
Figure 16: Latin America Healthcare and Laboratory Label Market Value(US$ Mn) and Volume (Mn Sq. M) Forecast, 2022 (E) -2030 (F)
Figure 17: Latin America Healthcare and Laboratory Labels Market Share Analysis, by Country, 2022E & 2030F
Figure 18: Latin America Healthcare and Laboratory Labels Market Share Analysis, by Material, 2022E & 2030F
Figure 19: Latin America Healthcare and Laboratory Labels Market Share Analysis, by End-user, 2022E & 2030F
Figure 20: Latin America Healthcare and Laboratory Labels Market Attractiveness Analysis by Country 2022(E) - 2030(F)
Figure 21: Latin America Healthcare and Laboratory Labels Market Attractiveness Analysis by Material 2022(E) - 2030(F)
Figure 22: Latin America Healthcare and Laboratory Labels Market Attractiveness Analysis by End-user 2022(E) - 2030(F)
Figure 23: Europe Healthcare and Laboratory Label Market Value(US$ Mn) and Volume (Mn Sq. M) analysis, 2015(A) – 2021(A)
Figure 24: Europe Healthcare and Laboratory Label Market Value(US$ Mn) and Volume (Mn Sq. M) Forecast, 2022 (E) -2030 (F)
Figure 25: Europe Healthcare and Laboratory Labels Market Share Analysis, by Country, 2022E & 2030F
Figure 26: Europe Healthcare and Laboratory Labels Market Share Analysis, by Material, 2022E & 2030F
Figure 27: Europe Healthcare and Laboratory Labels Market Share Analysis, by End-user, 2022E & 2030F
Figure 28: Europe Healthcare and Laboratory Labels Market Attractiveness Analysis by Country 2022(E) - 2030(F)
Figure 29: Europe Healthcare and Laboratory Labels Market Attractiveness Analysis by Material 2022(E) - 2030(F)
Figure 30: Europe Healthcare and Laboratory Labels Market Attractiveness Analysis by End-user 2022(E) - 2030(F)
Figure 31: South Asia Healthcare and Laboratory Label Market Value(US$ Mn) and Volume (Mn Sq. M) analysis, 2015(A) – 2021(A)
Figure 32: South Asia Healthcare and Laboratory Label Market Value(US$ Mn) and Volume (Mn Sq. M) Forecast, 2022 (E) -2030 (F)
Figure 33: South Asia Healthcare and Laboratory Labels Market Share Analysis, by Country, 2022E & 2030F
Figure 34: South Asia Healthcare and Laboratory Labels Market Share Analysis, by Material, 2022E & 2030F
Figure 35: South Asia Healthcare and Laboratory Labels Market Share Analysis, by End-user, 2022E & 2030F
Figure 36: South Asia Healthcare and Laboratory Labels Market Attractiveness Analysis by Country 2022(E) - 2030(F)
Figure 37: South Asia Healthcare and Laboratory Labels Market Attractiveness Analysis by Material 2022(E) - 2030(F)
Figure 38: South Asia Healthcare and Laboratory Labels Market Attractiveness Analysis by End-user 2022(E) - 2030(F)
Figure 39: East Asia Healthcare and Laboratory Label Market Value(US$ Mn) and Volume (Mn Sq. M) analysis, 2015(A) – 2021(A)
Figure 40: East Asia Healthcare and Laboratory Label Market Value(US$ Mn) and Volume (Mn Sq. M) Forecast, 2022 (E) -2030 (F)
Figure 41: East Asia Healthcare and Laboratory Labels Market Share Analysis, by Country, 2022E & 2030F
Figure 42: East Asia Healthcare and Laboratory Labels Market Share Analysis, by Material, 2022E & 2030F
Figure 43: East Asia Healthcare and Laboratory Labels Market Share Analysis, by End-user, 2022E & 2030F
Figure 44: East Asia Healthcare and Laboratory Labels Market Attractiveness Analysis by Country 2022(E) - 2030(F)
Figure 45: East Asia Healthcare and Laboratory Labels Market Attractiveness Analysis by Material 2022(E) - 2030(F)
Figure 46: East Asia Healthcare and Laboratory Labels Market Attractiveness Analysis by End-user 2022(E) - 2030(F)
Figure 47: Oceania Healthcare and Laboratory Label Market Value(US$ Mn) and Volume (Mn Sq. M) analysis, 2015(A) – 2021(A)
Figure 48: Oceania Healthcare and Laboratory Label Market Value(US$ Mn) and Volume (Mn Sq. M) Forecast, 2022 (E) -2030 (F)
Figure 49: Oceania Healthcare and Laboratory Labels Market Share Analysis, by Country, 2022E & 2030F
Figure 50: Oceania Healthcare and Laboratory Labels Market Share Analysis, by Material, 2022E & 2030F
Figure 51: Oceania Healthcare and Laboratory Labels Market Share Analysis, by End-user, 2022E & 2030F
Figure 52: Oceania Healthcare and Laboratory Labels Market Attractiveness Analysis by Country 2022(E) - 2030(F)
Figure 53: Oceania Healthcare and Laboratory Labels Market Attractiveness Analysis by Material 2022(E) - 2030(F)
Figure 54: Oceania Healthcare and Laboratory Labels Market Attractiveness Analysis by End-user 2022(E) - 2030(F)
Figure 55: MEA Healthcare and Laboratory Label Market Value(US$ Mn) and Volume (Mn Sq. M) analysis, 2015(A) – 2021(A)
Figure 56: MEA Healthcare and Laboratory Label Market Value(US$ Mn) and Volume (Mn Sq. M) Forecast, 2022 (E) -2030 (F)
Figure 57: MEA Healthcare and Laboratory Labels Market Share Analysis, by Country, 2022E & 2030F
Figure 58: MEA Healthcare and Laboratory Labels Market Share Analysis, by Material, 2022E & 2030F
Figure 59: MEA Healthcare and Laboratory Labels Market Share Analysis, by End-user, 2022E & 2030F
Figure 60: MEA Healthcare and Laboratory Labels Market Attractiveness Analysis by Country 2022(E) - 2030(F)
Figure 61: MEA Healthcare and Laboratory Labels Market Attractiveness Analysis by Material 2022(E) - 2030(F)
Figure 62: MEA Healthcare and Laboratory Labels Market Attractiveness Analysis by End-user 2022(E) - 2030(F)
Need specific information?
Request CustomizationExplore Packaging Insights
View Reports