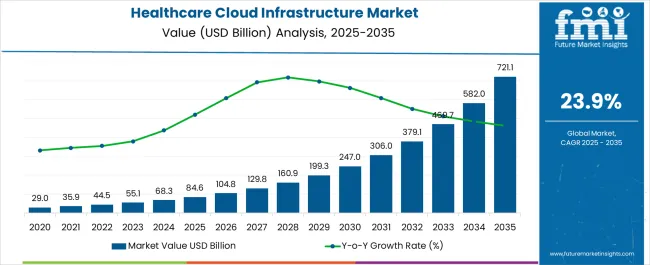
The healthcare cloud infrastructure market is estimated to be valued at USD 84.6 billion in 2025 and is projected to reach USD 721.1 billion by 2035, registering a compound annual growth rate (CAGR) of 23.9% over the forecast period.
Healthcare IT administrators evaluate cloud infrastructure specifications based on data security capabilities, compliance certification status, and integration compatibility when migrating electronic health records, implementing telemedicine solutions, and establishing clinical data analytics platforms.
Platform selection involves analyzing encryption standards, access control mechanisms, and disaster recovery features while considering HIPAA compliance requirements, interoperability standards, and performance scalability necessary for healthcare application hosting. Procurement decisions balance subscription costs against operational efficiency gains including reduced IT maintenance overhead, improved system reliability, and enhanced data backup capabilities that support clinical workflow optimization.
Infrastructure deployment requires specialized healthcare cloud platforms, redundant data storage systems, and network security architectures that ensure patient data protection while maintaining system availability for critical healthcare applications.
Operations coordination involves managing data migration schedules, application testing protocols, and user training programs while maintaining clinical workflow continuity and regulatory compliance throughout transition periods. Quality assurance procedures address security penetration testing, compliance auditing, and performance monitoring that validate infrastructure reliability while supporting healthcare organization accreditation requirements.
Cross-functional coordination involves healthcare IT specialists, clinical informatics teams, and compliance officers collaborating to optimize cloud implementations that balance system performance with regulatory requirements while addressing specific healthcare workflow needs and patient safety considerations.
Migration planning encompasses data classification, access privilege configuration, and integration testing while coordinating with clinical departments, administrative functions, and external healthcare partners. Training initiatives address security protocols, system navigation, and emergency procedures essential for maintaining patient care continuity throughout cloud infrastructure utilization.
Application diversification addresses electronic health record hosting, medical imaging storage, clinical research data management, and telehealth platform infrastructure that leverage cloud scalability for varying demand patterns and geographic distribution requirements.
Healthcare organizations coordinate with cloud service providers, system integrators, and compliance consultants to establish comprehensive infrastructure solutions that address specific clinical workflows while maintaining cost-effectiveness and regulatory compliance. Specialized implementations encompass genomic data analysis, pharmaceutical research platforms, and medical device monitoring systems that require high-performance computing resources and specialized security protocols.
Service provider relationships involve coordination between cloud infrastructure vendors, healthcare IT consultants, and medical software developers to establish integrated platforms that address customer-specific healthcare requirements while maintaining service level agreements and compliance standards.
Contract negotiations include data sovereignty provisions, disaster recovery guarantees, and compliance support services that protect healthcare organizations while ensuring operational continuity throughout infrastructure modernization programs. Partnership development encompasses collaboration with medical device manufacturers, pharmaceutical companies, and healthcare analytics providers to deliver comprehensive cloud ecosystems that optimize healthcare delivery efficiency.
| Metric | Value |
|---|---|
| Healthcare Cloud Infrastructure Market Estimated Value in (2025 E) | USD 84.6 billion |
| Healthcare Cloud Infrastructure Market Forecast Value in (2035 F) | USD 721.1 billion |
| Forecast CAGR (2025 to 2035) | 23.9% |
The healthcare cloud infrastructure market is expanding rapidly due to the growing digital transformation of healthcare systems, the rising need for scalable data storage, and increasing regulatory requirements for secure information management. The demand for cloud based infrastructure is being driven by the proliferation of electronic health records, telemedicine adoption, and the integration of advanced analytics and AI in clinical workflows.
Investments are being made in hybrid and multi cloud environments to balance scalability with compliance requirements. Data security, patient privacy, and interoperability have become central considerations, with providers and payers accelerating their transition to robust cloud platforms.
The outlook remains positive as healthcare systems prioritize cost efficiency, remote accessibility, and resilience, making cloud infrastructure a cornerstone of future healthcare delivery models.
The market is segmented by Component and End-Use and region. By Component, the market is divided into Hardware and Services. In terms of End-Use, the market is classified into Healthcare Payers and Healthcare Providers. Regionally, the market is classified into North America, Latin America, Western Europe, Eastern Europe, Balkan & Baltic Countries, Russia & Belarus, Central Asia, East Asia, South Asia & Pacific, and the Middle East & Africa.
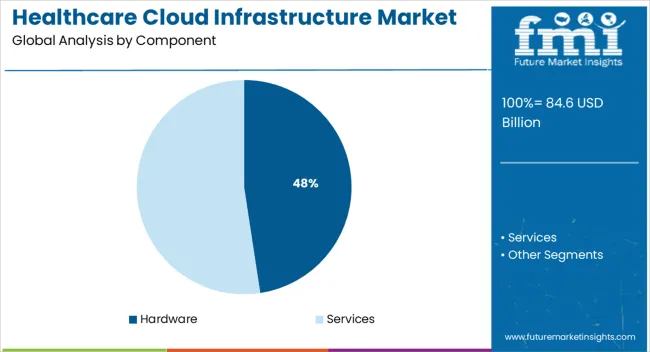
The hardware segment is expected to hold 47.60% of total revenue by 2025 within the component category, positioning it as a leading segment. This dominance is attributed to the increasing deployment of servers, storage devices, and networking equipment required to support high volume healthcare data workloads.
Hospitals and research institutions are investing heavily in infrastructure to manage imaging data, genomic sequencing, and electronic health records. The reliance on robust hardware is further reinforced by the need to ensure data redundancy, uninterrupted connectivity, and compliance with healthcare data standards.
As cloud adoption continues to rise, the demand for advanced hardware solutions remains significant, securing its share in the overall market.
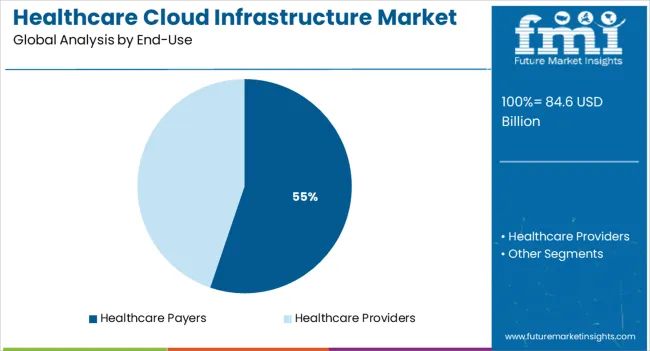
The healthcare payers segment is projected to contribute 55.20% of total market revenue by 2025, making it the dominant end use category. This growth is being driven by the increasing reliance of insurers and payers on cloud infrastructure to manage claims processing, patient records, and risk analytics.
Cloud solutions provide scalability and efficiency, enabling payers to streamline operations and improve customer engagement through digital portals and mobile platforms. The integration of predictive analytics and machine learning tools in payer systems has further strengthened the demand for advanced cloud capabilities.
Regulatory compliance and the need for secure, transparent handling of sensitive data have accelerated adoption in this segment, ensuring healthcare payers maintain their leadership in cloud infrastructure utilization.
As per the Healthcare Cloud Infrastructure Market research by Future Market Insights - a market research and competitive intelligence provider, historically, from 2020 to 2025, the market increased at around 20.6% CAGR, wherein, countries such as the USA, China, the United Kingdom, Japan, South Korea held a significant share in the global market.
The healthcare cloud infrastructure market is growing rapidly due to a significant surge in digitalization, artificial intelligence, and machine learning computing, rising cloud database infrastructure, and increasing capital expenditure. The efficient cloud database management system enhances the quality of treatment and care of individuals. Owing to this, the Healthcare Cloud Infrastructure market is projected to grow at a CAGR of 23.9% over the coming 10 years.
The adoption of data analytics, wearable devices, and the Internet of Things surges the demand for the healthcare cloud computing market. The Internet of Things in Healthcare Industry is expected to change the dynamics of the healthcare industry. Cloud infrastructure helps to collect information on individual and remote monitoring of patients in the healthcare industry.
Increased use of IoT solutions in healthcare is anticipated to spur market expansion over the forecast period. Market players including IBM, SAP SE, and Cisco Systems Inc. are leveraging IoT technologies and solutions to enhance healthcare products and services throughout their transactional activities.
Cloud computing allows access to the patient data to the manufacturer of the devices, services providers, doctors, and the patient as well. Cloud systems are integrated with healthcare organizations and represent a privacy and security safeguard for healthcare data by encrypting it with data hard forking and fine-grained access controls.
The significant increase in the adoption of electronic medical records and the increasing prevalence of digital outputs provide more potential for cloud solution providers. This use of data analysis is also beneficial in increasing the patient-centric service and improving recommendations for care based on insights from the collected information to provide better treatment options.
The market in the Asia Pacific is expected to showcase significant opportunities in the forthcoming years. In the recent past, Asia Pacific has emerged as one of the prominent hubs of data centers globally. This has created ample opportunity for cloud-based businesses operating in the region. While this implies a shift in the diversification of global locations, it also promises a significant opportunity for Healthcare Cloud Infrastructure Market.
The market in North America is expected to cross USD 84.6 Billion by 2025, growing at a CAGR of over 20% from 2025 to 2035. The healthcare IT expenditure in the regions has been skyrocketing. The number of remote patient monitoring in the USA increased from 68.3 Million in 2024 to 84.6 Million in 2025. By 2025, this number is expected to swell to 70.6 Million. Besides, telemedicine appointments in the region have also surged which has consequently triggered the demand for healthcare cloud infrastructure in the region.
In 2024, more than 30% of Americans used wearable medical devices and this number has been constantly on the surge and a significant proportion of them are connected. All these factors imply to a significant market for healthcare cloud infrastructure in the region.
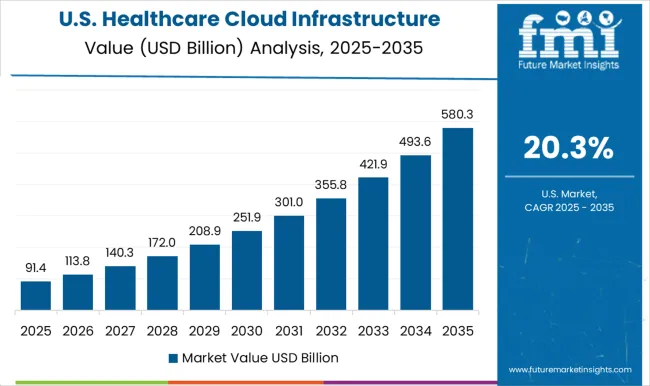
The market in North America is expected to reach a valuation of USD 721.1 Billion by 2035. To transform business due to digitalization, organizations are adopting advanced cloud-based solutions. The prominent IT players are based out of the USA itself. This helps to grow particular business segments in the USA region.
The key players operating in the market in the country are IBM, Oracle, Microsoft, Amazon, and Salesforce. Besides, companies are also entering into technological collaborations to expand and co-develop innovative products and solutions. For instance, in July 2024, Microsoft and Allscripts Healthcare Solutions, Inc. entered into a strategic partnership to develop cloud-based healthcare IT solutions.
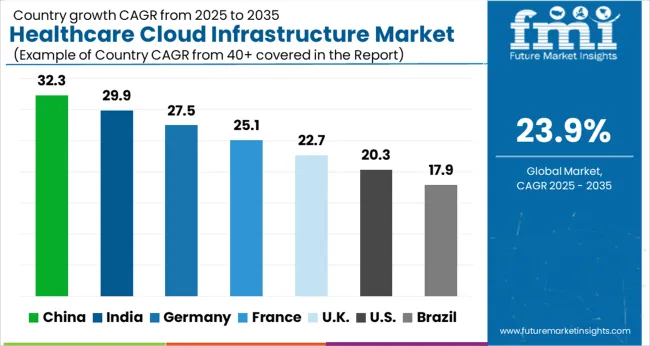
The market in the United Kingdom is expected to reach a valuation of USD 32.9 Billion by 2035. Growing with a CAGR of 28.6% in the forecast period, the market in the country is projected to garner an absolute dollar opportunity of around USD 30.2 Billion.
In Japan, the market is expected to grow at a CAGR of 23% from 2025 to 2035, reaching around USD 17.5 Billion by 2035. The market in the country is expected to gross an absolute dollar opportunity of USD 15.3 Billion during the forecast period.
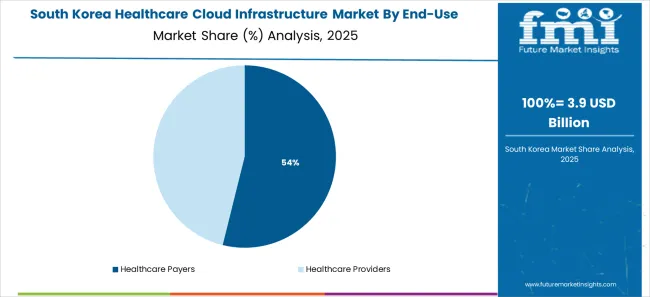
The market in South Korea is expected to reach a valuation of around USD 7.1 Billion by 2035, growing at a CAGR of 18% from 2025 to 2035. The market in the country is expected to witness an absolute dollar opportunity of around USD 5.8 Billion.
The Healthcare Cloud Infrastructure Services Market accounted for 19.8% CAGR from 2020 to 2025 and is expected to increase to 23.7% from 2025 to 2035.
The easy access and outsourcing of IT services can be availed for short- or long-term projects. The services are Software-as-a-service (SaaS), Infrastructure-as-a-service (IaaS), and Platform-as-a-service (PaaS). Almost all healthcare corporations due to digitalization and technological advancement are outsourcing SaaS as a service.
SaaS models cover a wide range of activities, from web-based to inventory control to database processing. However, Platform-as-a-Service (PaaS) will see significant growth due to an inventory of apps and customization of applications.
There are mainly two types of Healthcare Cloud Infrastructure. One is Healthcare Payers while the other is healthcare providers. Healthcare providers capture more market share than the payers and revenue through this end-user is projected to grow at 22.9% CAGR from 2025 to 2035.
The advantage of using this model in healthcare facilities is to secure offsite data storage management systems and eliminate the demand for in-house IT infrastructure. This has also reduced the cost and increased the scalability and flexibility of database management systems based out of cloud infrastructure.
While the healthcare payers are more focused on insurance companies and health plans. However, healthcare payers are also adopting IT infrastructure cloud computing services for the storage of data and management of high-risk patient data. Payers are adopting this model to minimize their capital expenditure.
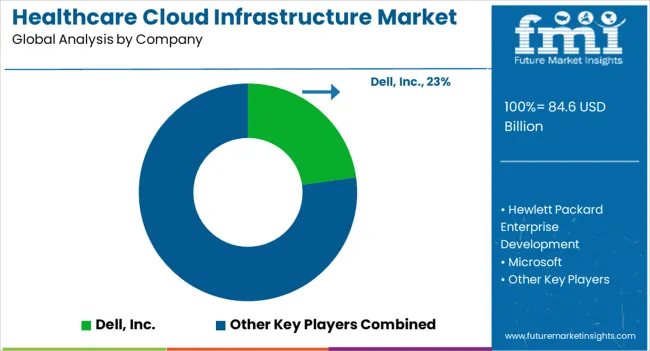
The healthcare cloud infrastructure market is growing rapidly as healthcare organizations increasingly adopt cloud technologies to streamline operations, improve patient care, and ensure data security and compliance. Key players in the market include Dell Inc., Hewlett Packard Enterprise Development LP, Microsoft Corporation, Oracle Corporation, IBM Corporation, Salesforce Inc., and Amazon Web Services Inc., each providing robust cloud solutions tailored for the healthcare sector. Microsoft Corporation and Amazon Web Services (AWS) are leaders, offering scalable, secure cloud platforms like Azure and AWS Cloud, which enable healthcare providers to manage vast amounts of patient data, support telemedicine, and enable artificial intelligence (AI) and machine learning for enhanced diagnostics. IBM Corporation provides cloud-based solutions with a focus on healthcare AI, data analytics, and electronic health records (EHR) integration.
Dell Inc. and Hewlett Packard Enterprise offer cloud infrastructure with a focus on hybrid solutions, enabling healthcare organizations to integrate on-premises systems with cloud environments. Oracle Corporation provides cloud platforms that ensure secure, compliant data management, essential for the healthcare industry. Salesforce Inc. is innovating with cloud-based CRM and healthcare-specific tools to enhance patient engagement and improve care coordination. These companies are driving the market through security, scalability, and compliance to meet the growing demand for digital transformation in healthcare, enabling better patient outcomes and operational efficiency.
| Items | Values |
|---|---|
| Quantitative Units (2025) | USD 84.6 billion |
| Component | Hardware (Server, Storage, Network), Services (Software-as-a-Service, Infrastructure-as-a-Service, Platform-as-a-Service) |
| End Use | Healthcare Payers and Healthcare Providers |
| Regions Covered | North America, Latin America, Western Europe, Eastern Europe, Balkan & Baltic Countries, Russia & Belarus, Central Asia, East Asia, South Asia and Pacific, Middle East and Africa |
| Key Countries Covered | United States, Canada, Mexico, Germany, France, United Kingdom, China, Japan, India, South Korea, Brazil, and 40+ countries |
| Key Companies Profiled |
Dell Inc., Hewlett Packard Enterprise Development LP, Microsoft Corporation, Oracle Corporation, IBM Corporation, Salesforce Inc., Amazon Web Services Inc. |
| Additional Attributes | Dollar sales by component, deployment, and region; rapid adoption of AI and IoT-enabled healthcare systems; integration of telemedicine and remote patient monitoring; emphasis on interoperability and data security; rising hybrid and multi-cloud investments; compliance with healthcare data privacy laws (HIPAA, GDPR); and growing infrastructure investments in Asia-Pacific and North America. |
The global healthcare cloud infrastructure market is estimated to be valued at USD 84.6 billion in 2025.
The market size for the healthcare cloud infrastructure market is projected to reach USD 721.1 billion by 2035.
The healthcare cloud infrastructure market is expected to grow at a 23.9% CAGR between 2025 and 2035.
The key product types in healthcare cloud infrastructure market are hardware, _server, _storage, _network, services, _software-as-a-service (saas), _infrastructure-as-a-service (iaas) and _platform-as-a-service (paas).
In terms of end-use, healthcare payers segment to command 55.2% share in the healthcare cloud infrastructure market in 2025.


Our Research Products

The "Full Research Suite" delivers actionable market intel, deep dives on markets or technologies, so clients act faster, cut risk, and unlock growth.

The Leaderboard benchmarks and ranks top vendors, classifying them as Established Leaders, Leading Challengers, or Disruptors & Challengers.

Locates where complements amplify value and substitutes erode it, forecasting net impact by horizon

We deliver granular, decision-grade intel: market sizing, 5-year forecasts, pricing, adoption, usage, revenue, and operational KPIs—plus competitor tracking, regulation, and value chains—across 60 countries broadly.

Spot the shifts before they hit your P&L. We track inflection points, adoption curves, pricing moves, and ecosystem plays to show where demand is heading, why it is changing, and what to do next across high-growth markets and disruptive tech

Real-time reads of user behavior. We track shifting priorities, perceptions of today’s and next-gen services, and provider experience, then pace how fast tech moves from trial to adoption, blending buyer, consumer, and channel inputs with social signals (#WhySwitch, #UX).

Partner with our analyst team to build a custom report designed around your business priorities. From analysing market trends to assessing competitors or crafting bespoke datasets, we tailor insights to your needs.
Supplier Intelligence
Discovery & Profiling
Capacity & Footprint
Performance & Risk
Compliance & Governance
Commercial Readiness
Who Supplies Whom
Scorecards & Shortlists
Playbooks & Docs
Category Intelligence
Definition & Scope
Demand & Use Cases
Cost Drivers
Market Structure
Supply Chain Map
Trade & Policy
Operating Norms
Deliverables
Buyer Intelligence
Account Basics
Spend & Scope
Procurement Model
Vendor Requirements
Terms & Policies
Entry Strategy
Pain Points & Triggers
Outputs
Pricing Analysis
Benchmarks
Trends
Should-Cost
Indexation
Landed Cost
Commercial Terms
Deliverables
Brand Analysis
Positioning & Value Prop
Share & Presence
Customer Evidence
Go-to-Market
Digital & Reputation
Compliance & Trust
KPIs & Gaps
Outputs
Full Research Suite comprises of:
Market outlook & trends analysis
Interviews & case studies
Strategic recommendations
Vendor profiles & capabilities analysis
5-year forecasts
8 regions and 60+ country-level data splits
Market segment data splits
12 months of continuous data updates
DELIVERED AS:
PDF EXCEL ONLINE
Cloud Infrastructure Entitlement Management Market Report – Trends & Forecast 2024-2034
Cloud Infrastructure-As-A-Service Market
Cloud IT Infrastructure Hardware Market Size and Share Forecast Outlook 2025 to 2035
Public Cloud Application Infrastructure Services Market Size and Share Forecast Outlook 2025 to 2035
Asia Pacific Cloud Infrastructure Testing Services Market
Infrastructure Projects Legal Services Market Size and Share Forecast Outlook 2025 to 2035
Cloud Data Encryption Solutions Market Size and Share Forecast Outlook 2025 to 2035
Healthcare Air Purifier Market Size and Share Forecast Outlook 2025 to 2035
Cloud Service Market Size and Share Forecast Outlook 2025 to 2035
Cloud Analytics Market Size and Share Forecast Outlook 2025 to 2035
Healthcare Regulatory Affairs Outsourcing Market Size and Share Forecast Outlook 2025 to 2035
Healthcare and Laboratory Label Industry Analysis in the United States Size and Share Forecast Outlook 2025 to 2035
Cloud ERP Industry Analysis in Latin America Forecast Outlook 2025 to 2035
Cloud Backup Service Industry Analysis in Latin America Size and Share Forecast Outlook 2025 to 2035
Cloud Compliance Market Size and Share Forecast Outlook 2025 to 2035
Healthcare Flooring Market Size and Share Forecast Outlook 2025 to 2035
Healthcare AI Computer Vision Market Size and Share Forecast Outlook 2025 to 2035
Cloud-Based ITSM Market Size and Share Forecast Outlook 2025 to 2035
Healthcare Business Intelligence Market Size and Share Forecast Outlook 2025 to 2035
Cloud POS Market Size and Share Forecast Outlook 2025 to 2035

Thank you!
You will receive an email from our Business Development Manager. Please be sure to check your SPAM/JUNK folder too.
Chat With
MaRIA