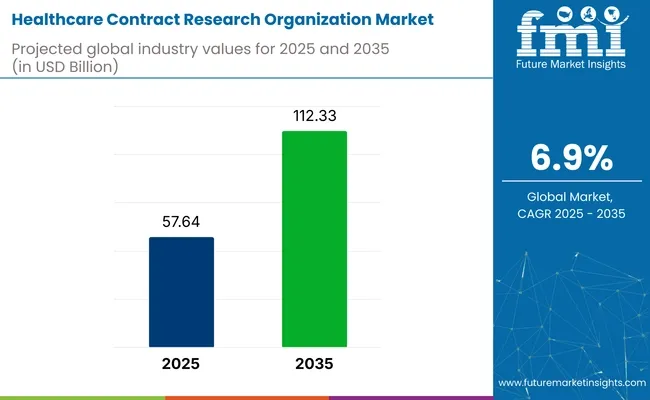
The healthcare contract research organization (CRO) market is expected to grow from USD 57.64 billion in 2025 to USD 112.33 billion by 2035, reflecting a CAGR of 6.9% during the forecast period. Pharmaceutical, biopharmaceutical, and medical device companies are increasingly outsourcing services to CROs to reduce operational costs, accelerate time-to-market, and meet regulatory demands.
| Attribute | Value |
|---|---|
| Market Size in 2025 | USD 57.64 billion |
| Market Size in 2035 | USD 112.33 billion |
| CAGR (2025 to 2035) | 6.9% |
The need for high-quality data management, risk-based monitoring, and global patient recruitment is pushing CROs to diversify their capabilities. Integration of AI, decentralized trials, and eClinical platforms is becoming standard. Leading providers such as IQVIA, Labcorp Drug Development, and Parexel are expanding clinical monitoring and regulatory consulting services to support multi-country trial protocols.
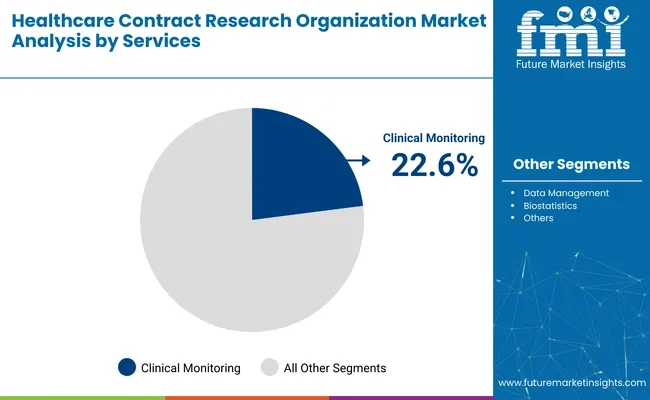
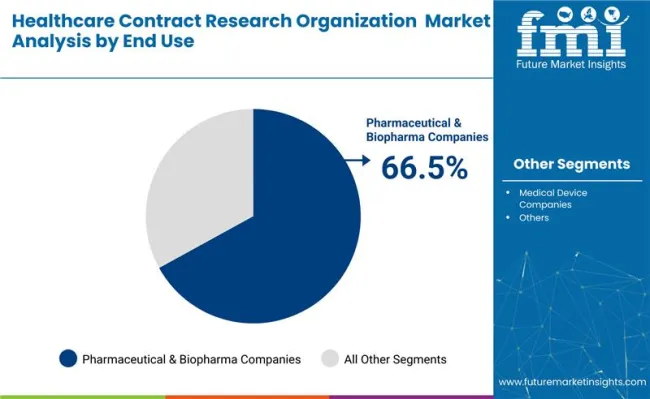
By service, clinical monitoring holds the largest share at 22.6%, driven by demand for protocol compliance and adverse event tracking. In terms of end use, pharmaceutical and biopharmaceutical companies dominate with a 66.5% share, as drug sponsors increasingly rely on external partners for late-phase trials and post-marketing surveillance.
Regions such as Asia-Pacific are witnessing rapid growth, particularly in India and China, due to a favorable regulatory environment, skilled workforce, and growing domestic drug development. North America remains a mature market, benefiting from large-scale innovation hubs and advanced data infrastructure. As drug pipelines grow in complexity, CROs are expected to play a central role in ensuring faster, safer, and globally compliant research execution.
The global healthcare contract research organization (CRO) market is increasingly shifting its focus toward emerging regions, with India becoming a prominent hub for clinical trials. Multinational CROs are expanding operations in cost-effective locations to optimize trial expenditures and access diverse patient populations.
India, in particular, offers favorable regulatory reforms, a skilled workforce, and a growing infrastructure to support complex trials. This has attracted key industry players looking to enhance trial efficiency without compromising on quality or timelines.
Speaking to this trend, Sanjay Vyas, head of Parexel’s India operations, stated, “Because the cost of failure in India is much less than in other parts of the world,” highlighting the country's strategic advantage in global research. As more pharmaceutical and biotech companies turn to CROs for end-to-end solutions, cost optimization and geographic expansion remain core drivers for market competitiveness and growth in the coming years.
The healthcare CRO market is witnessing strong investments in clinical monitoring services due to increasing trial complexity and decentralized models. Pharmaceutical and biopharma companies remain the largest end users, outsourcing a wide range of services to streamline R&D processes, accelerate drug development, and ensure regulatory compliance across multi-phase trials and global research programs.
Clinical monitoring is expected to account for 22.6% of the global CRO market in 2025. It remains essential for ensuring protocol adherence, safety reporting, and data integrity across multi-site and multinational trials. With trials becoming more complex and global in scope, sponsors increasingly rely on CROs to manage risk-based monitoring strategies, source document verification, and adverse event tracking.
Companies such as Parexel, Labcorp, and ICON plc are investing in hybrid monitoring models combining in-person site visits with remote digital monitoring tools. The shift toward decentralized and virtual trials is further accelerating the demand for flexible, technology-enabled clinical oversight services that can be rapidly deployed across geographies.
Pharmaceutical and biopharmaceutical companies are projected to contribute 66.5% of total market revenue in 2025, making them the largest end-user group. These firms are increasingly outsourcing clinical trials, regulatory affairs, and post-approval studies to improve cost-efficiency and reduce internal operational load.
The rise of complex biologics, biosimilars, and personalized therapies has amplified demand for specialized CRO support. Major sponsors such as Pfizer, Novartis, and Roche work closely with CROs like IQVIA, Syneos Health, and Medpace to accelerate trial timelines and ensure compliance with global regulations. Long-term strategic partnerships and preferred provider models are now common, especially for Phase III and IV trials.
The healthcare CRO market is expanding as sponsors seek flexible, cost-effective trial solutions. Outsourcing is enabling faster innovation, while increasing regulatory scrutiny, trial complexity, and data demands present ongoing challenges. Clinical CROs must balance speed, compliance, and scalability in a highly competitive, globalized research environment.
Rising complexity of clinical trials is driving outsourcing demand
As clinical trials become more complex, pharmaceutical and biotech firms are increasingly relying on CROs to navigate protocol design, patient recruitment, and regulatory approvals. Rising costs, expanding global trial footprints, and demand for real-world evidence are prompting sponsors to outsource key activities across trial phases.
Trials involving precision medicine, gene therapies, and rare diseases require highly specialized coordination, which CROs can provide efficiently. Companies like IQVIA, ICON, and Charles River are leveraging AI and decentralized trial platforms to optimize enrollment and compliance. Additionally, global harmonization of regulatory pathways has enabled CROs to scale services across borders. This dynamic is accelerating long-term strategic partnerships between CROs and drug sponsors worldwide.
Regulatory challenges and data quality risks are restraining growth
Despite rising demand, the CRO industry faces growing pressure from evolving regulatory requirements, particularly in cross-border trials. Ensuring consistent data quality, informed consent, and patient safety across multiple countries presents operational and legal complexity. Frequent regulatory updates from the FDA, EMA, and other agencies require CROs to invest heavily in compliance infrastructure.
Moreover, variability in data privacy laws-such as GDPR in Europe or HIPAA in the USA - adds to contract negotiation timelines and cost. Misalignment between sponsors and CROs on protocol execution can also lead to costly delays or failed studies. Smaller CROs, in particular, struggle with scalability and technology adoption, which limits their competitiveness in a market demanding global reach and digital agility.
Country-level growth is being driven by trial decentralization, biologics development, and regional regulatory support. While the USA leads in innovation and outsourcing budgets, China and India are witnessing rapid expansion due to talent availability, cost advantage, and increasing clinical trial volume across therapeutic areas.
The United States continues to dominate the healthcare CRO market, supported by its robust pharmaceutical ecosystem, advanced data infrastructure, and early adoption of decentralized clinical trials. The market in the USA is expected to grow at a CAGR of 5.9% from 2025 to 2035, driven by increasing outsourcing of late-phase trials and real-world evidence generation.
Major sponsors such as Pfizer, AbbVie, and Merck rely on CROs like IQVIA, Syneos Health, and Labcorp Drug Development to manage large-scale operations and regulatory complexities. The FDA’s ongoing support for digital trials and adaptive designs is creating new opportunities for USA based CROs to lead innovation in trial efficiency, patient diversity, and therapeutic precision.
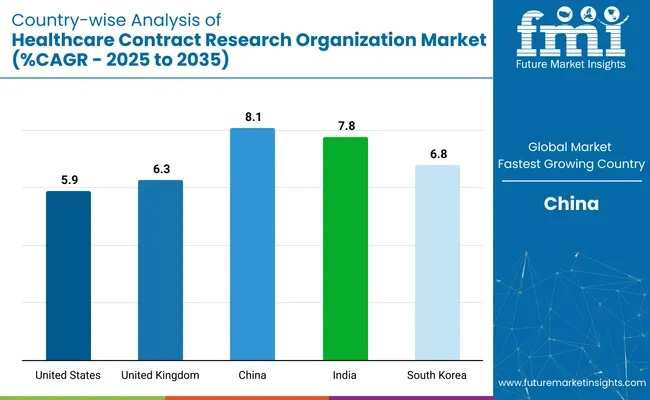
The United Kingdom is strengthening its CRO market through a focus on regulatory reform, digital trial infrastructure, and life sciences investment. Expected to expand at a CAGR of 6.3% between 2025 and 2035, the UK market benefits from MHRA flexibility and fast-track approvals for clinical research. Post-Brexit initiatives such as the UK Clinical Research Recovery Plan are streamlining trial timelines and supporting collaboration between the NHS, CROs, and global sponsors.
Companies like ICON and Parexel are expanding their UK presence to meet demand for oncology, CNS, and rare disease trials. The nation’s commitment to decentralized research models and remote patient monitoring is also fueling growth in home-based clinical trial support services.
China’s CRO market is experiencing strong momentum, projected to grow at a CAGR of 8.1% from 2025 to 2035-the fastest among key countries. This expansion is driven by government support for domestic drug development, streamlined regulatory pathways under NMPA reforms, and a vast patient pool for trial recruitment.
CROs like Wuxi AppTec, Tigermed, and JOINN Laboratories are rapidly scaling clinical operations and preclinical capabilities to meet the needs of both local and multinational sponsors. Increasing participation in global Phase III trials and biologics manufacturing is transforming China into a global CRO hub. Enhanced AI infrastructure, growing investigator networks, and clinical trial harmonization efforts further support its rise in global outsourcing.
India is becoming a key CRO destination due to low-cost trial execution, English-speaking medical talent, and favorable government policies. The market is expected to grow at a CAGR of 7.8% from 2025 to 2035, driven by trial decentralization, biosimilar development, and post-marketing surveillance services. CROs such as Syngene, GVK BIO, and Cliantha Research are expanding site networks and investing in regulatory tech platforms.
The Ayushman Bharat Digital Mission is enabling real-time clinical data collection, while CDSCO’s regulatory reforms are reducing start-up timelines. India’s strong clinical base in oncology, diabetes, and cardiovascular studies makes it a preferred partner for USA and EU-based pharma companies seeking long-term engagement.
South Korea is strengthening its CRO market through targeted investments in oncology, rare disease, and precision medicine trials. With a projected CAGR of 6.8% from 2025 to 2035, the country is investing in real-time data capture, AI-powered monitoring, and hospital-CRO collaboration networks. Seoul-based firms such as Lotte Biologics and DreamCIS are expanding trial support services across East Asia.
Strong regulatory alignment with the USA FDA and EMA is attracting international sponsors seeking efficient East Asian trial coordination. South Korea’s government is funding trial infrastructure in medical innovation zones, reinforcing its position as a digitally advanced, regionally influential CRO market for complex, fast-track clinical programs.
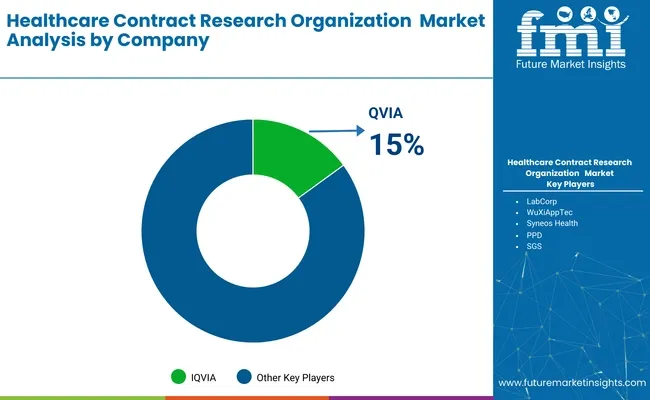
IQVIA - 15%
The CRO industry is dominated by global players with expansive trial infrastructure and full-service capabilities. Tier 1 firms such as IQVIA, Labcorp Drug Development, and ICON plc lead the market by offering end-to-end services across all trial phases, often under preferred provider models.
Tier 2 players like Parexel, Charles River, and Syneos Health specialize in therapeutic areas like oncology and CNS, with strong regulatory consulting and patient recruitment platforms. Tier 3 regional CROs including Wuxi AppTec, Medpace, and GVK BIO serve local markets with cost-effective clinical services. Entry barriers are high due to regulatory complexity, technology adoption, and client expectations for data quality, scalability, and cross-border execution.
Recent Industry News
In January 2025, ICON plc expanded its AI-powered clinical trial platform to enhance efficiency and patient recruitment. CEO Steve Cutler noted, “Our industry continues to rapidly evolve - sitting at the confluence of the AI revolution and a parallel revolution in biomedical science.” In March 2024, Parexel announced plans to strengthen its presence in India, aiming to add over 2,000 staff within five years to support early-stage clinical trials. Meanwhile, WuXiAppTec reported a 6.9% year-over-year revenue increase in Q4 2024 and committed to expanding its global capacity to meet rising client demand for regulatory and trial services.
| Report Attributes | Details |
|---|---|
| Current Total Market Size (2025) | USD 57.64 billion |
| Projected Market Size (2035) | USD 112.33 billion |
| CAGR (2025 to 2035) | 6.9% |
| Base Year for Estimation | 2024 |
| Historical Period | 2020 to 2024 |
| Projections Period | 2025 to 2035 |
| Quantitative Units | USD billion for value and million services for volume |
| Segments Analyzed - By Service | Data Management, Clinical Supply Management/Project Management, Medical Writing, Clinical Monitoring, Patient & Site Recruitment, Bio-Statistics, Regulatory & Medical Affairs, Investigator Payments, Technology, Laboratory, Quality Management, Others |
| Segments Analyzed - By Type | Pre-Clinical, Clinical, Phase I Trial Services, Phase II Trial Services, Phase III Trial Services, Phase IV Trial Services, Drug Discovery, Target Validation, Lead Identification, Lead Optimization |
| Segments Analyzed - By Application | Oncology, Cardiovascular, Autoimmune/Inflammation, Central Nervous System (CNS), Dermatology, Infectious Diseases, Diabetes, Pain, Others |
| Segments Analyzed - By End-Use | Pharmaceutical & Biopharmaceutical Companies, Medical Device Companies, Others |
| Regions Covered | North America, Latin America, Europe, Asia-Pacific, Middle East & Africa |
| Countries Covered | United States, Canada, Mexico, Brazil, Argentina, Germany, France, United Kingdom, Italy, Spain, Netherlands, China, India, Japan, South Korea, Australia, New Zealand, GCC Countries, South Africa |
| Key Players Influencing the Healthcare CRO Market | QVIA, LabCorp, Charles River Laboratories, WuXiAppTec , Syneos Health, Parexel International, PPD, ICON Plc, Medpace Holdings, SGS, PSI CRO AG, Axcent Advanced Analytics, BIO Agile Therapeutics, Firma Clinical Research, Acculab Life Sciences |
| Additional Attributes | Dollar sales by service type, application, and type, increasing demand for outsourced clinical trials, growth in drug discovery and development processes, regulatory challenges, rise in strategic partnerships between CROs and pharma companies, regional variations in clinical trial activity. |
Data Management, Clinical Supply Management/Project Management, Medical Writing, Clinical Monitoring, Patient & Site Recruitment, Biostatistics, Regulatory & Medical Affairs, Investigator Payments, Technology, Laboratory, Quality Management, Others.
Pre-clinical, Clinical, Phase I Trial Services, Phase II Trial Services, Phase III Trial Services, Phase IV Trial Services, Drug Discovery, Target Validation, Lead Identification, Lead Optimization.
Oncology, Cardiovascular, Autoimmune/Inflammation, Central Nervous System (CNS), Dermatology, Infectious Diseases, Diabetes, Pain, Others.
Pharmaceutical & Biopharmaceutical Companies, Medical Device Companies, Others.
North America, Latin America, Europe, Asia-Pacific, Middle East and Africa.
The market is projected to reach USD 112.33 billion by 2035.
The market is estimated at USD 57.64 billion in 2025.
Clinical monitoring leads the service segment with a 22.6% share in 2025.
Pharmaceutical and biopharmaceutical companies dominate with a 66.5% share in 2025.
China and India are the fastest-growing markets due to favorable regulations and cost advantages.


Our Research Products

The "Full Research Suite" delivers actionable market intel, deep dives on markets or technologies, so clients act faster, cut risk, and unlock growth.

The Leaderboard benchmarks and ranks top vendors, classifying them as Established Leaders, Leading Challengers, or Disruptors & Challengers.

Locates where complements amplify value and substitutes erode it, forecasting net impact by horizon

We deliver granular, decision-grade intel: market sizing, 5-year forecasts, pricing, adoption, usage, revenue, and operational KPIs—plus competitor tracking, regulation, and value chains—across 60 countries broadly.

Spot the shifts before they hit your P&L. We track inflection points, adoption curves, pricing moves, and ecosystem plays to show where demand is heading, why it is changing, and what to do next across high-growth markets and disruptive tech

Real-time reads of user behavior. We track shifting priorities, perceptions of today’s and next-gen services, and provider experience, then pace how fast tech moves from trial to adoption, blending buyer, consumer, and channel inputs with social signals (#WhySwitch, #UX).

Partner with our analyst team to build a custom report designed around your business priorities. From analysing market trends to assessing competitors or crafting bespoke datasets, we tailor insights to your needs.
Supplier Intelligence
Discovery & Profiling
Capacity & Footprint
Performance & Risk
Compliance & Governance
Commercial Readiness
Who Supplies Whom
Scorecards & Shortlists
Playbooks & Docs
Category Intelligence
Definition & Scope
Demand & Use Cases
Cost Drivers
Market Structure
Supply Chain Map
Trade & Policy
Operating Norms
Deliverables
Buyer Intelligence
Account Basics
Spend & Scope
Procurement Model
Vendor Requirements
Terms & Policies
Entry Strategy
Pain Points & Triggers
Outputs
Pricing Analysis
Benchmarks
Trends
Should-Cost
Indexation
Landed Cost
Commercial Terms
Deliverables
Brand Analysis
Positioning & Value Prop
Share & Presence
Customer Evidence
Go-to-Market
Digital & Reputation
Compliance & Trust
KPIs & Gaps
Outputs
Full Research Suite comprises of:
Market outlook & trends analysis
Interviews & case studies
Strategic recommendations
Vendor profiles & capabilities analysis
5-year forecasts
8 regions and 60+ country-level data splits
Market segment data splits
12 months of continuous data updates
DELIVERED AS:
PDF EXCEL ONLINE
Healthcare Air Purifier Market Size and Share Forecast Outlook 2025 to 2035
Healthcare Regulatory Affairs Outsourcing Market Size and Share Forecast Outlook 2025 to 2035
Healthcare and Laboratory Label Industry Analysis in the United States Size and Share Forecast Outlook 2025 to 2035
Healthcare Flooring Market Size and Share Forecast Outlook 2025 to 2035
Healthcare AI Computer Vision Market Size and Share Forecast Outlook 2025 to 2035
Healthcare Business Intelligence Market Size and Share Forecast Outlook 2025 to 2035
Healthcare Master Data Management Market Size and Share Forecast Outlook 2025 to 2035
Healthcare and Laboratory Label Industry Analysis in Japan Size and Share Forecast Outlook 2025 to 2035
Healthcare and Laboratory Label Industry Analysis in Western Europe Size and Share Forecast Outlook 2025 to 2035
Healthcare Contact Center Solution Market Size and Share Forecast Outlook 2025 to 2035
Healthcare Semiconductor Market Size and Share Forecast Outlook 2025 to 2035
Healthcare Cold Chain Logistics Market Size and Share Forecast Outlook 2025 to 2035
Healthcare Mobile Computers Market Size and Share Forecast Outlook 2025 to 2035
Healthcare Cloud Infrastructure Market Size and Share Forecast Outlook 2025 to 2035
Healthcare Companion Robots Market Size and Share Forecast Outlook 2025 to 2035
Healthcare Analytical Testing Services Market Size and Share Forecast Outlook 2025 to 2035
Healthcare Analytics Market Size and Share Forecast Outlook 2025 to 2035
Healthcare and laboratory labels market Size, Share & Forecast 2025 to 2035
Healthcare Chatbot Market - Growth Trends & Forecast 2025 to 2035
Healthcare Video Conferencing Solutions Market Analysis - Trends & Forecast 2025 to 2035

Thank you!
You will receive an email from our Business Development Manager. Please be sure to check your SPAM/JUNK folder too.
Chat With
MaRIA