Healthcare Companion Robots Market
Thanks to the Advent of Automation, Healthcare Companion Robots have made it Big in Streamlining Workflows. Peruse FMI’s Insights to know more
Healthcare Companion Robots Market by Type, Age-Group & Region - Forecast 2023 - 2033
Healthcare Companion Robots Market Snapshot (2023-2033)
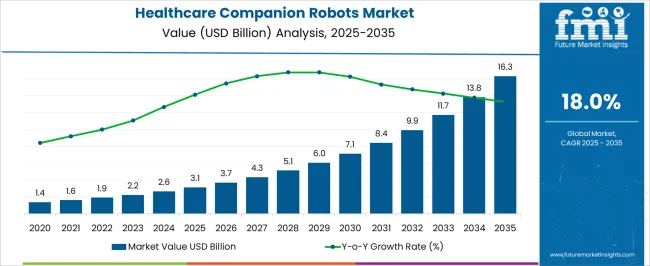
The global healthcare companion robots market will most likely garner a market value of US$ 2.24 Million in 2023 and is expected to accumulate a market value of US$ 11.73 Million by registering a CAGR of 18% in the forecast period 2023-2033. Growth of the healthcare companion robots market can be attributed to increasing disposable income, improving healthcare infrastructure along with rise in geriatric population. The market for healthcare companion robots registered a CAGR of 10% in the historical period 2018-2022.
Technological advancements are playing a key role in the wide adoption of healthcare companion robots for geriatric population, children and people with disability. This has led to the market gaining traction in the last few years. In addition, the COVID-19 pandemic too contributed in fueling the demand for the market.
Report Attribute |
Details |
Expected Market Value (2023) |
US$ 2.24 Billion |
Anticipated Forecast Value (2033) |
US$ 11.73 Billion |
Projected Growth Rate (2023-2033) |
18% CAGR |
Let us know your requirement to get
100% FREE customization
2018-2022 Healthcare Companion Robots Market Demand Analysis vs. Forecast 2023-2033
According to market research and competitive intelligence provider Future Market Insights- the market for healthcare companion robots reflected a value of 10% during the historical period, 2018 - 2022. dental virtual visits have enabled the reach of oral healthcare in underserved areas of developing countries.
The outbreak of COVID-19 positively impacted the market growth. The lockdown and social distancing imposed by government resulted in social isolation and feeling of loneliness. This raised the acceptance of companion robots as it helped to fill in the gaps and reduce the loneliness, especially in elderly population. Also, they were used to assist the therapies in order to improve the mental condition of people and help them to overcome the anxiety issues. Moreover, they are also used for monitoring the health remotely and managing medication. Thus, the market for healthcare companion robots is expected to register a CAGR of 18% in the forecast period 2023-2033.
Which are Some Prominent Drivers of Healthcare Companion Robots Market?
Companion robots reducing loneliness and offering support to patients of all age groups
Companion robot helps to enhance well-being and quality of life by its assistance features. It mainly provides cognitive support, mobility support and relaxation. Also, it helps in monitoring health and provides self-care support through interaction. The rising geriatric population across the globe and limited number of healthcare professionals to care for older population, particularly in countries like Japan is likely to raise the demand for companion robot. Furthermore, various initiatives undertaken by the government is supporting the market growth.
Technological advancement in the field of medical robotics is another factor driving the market growth. Various robotic products are developed to assist patients and improve the outcome. For instance, Service Robotics, a UK-based startup offers medical care robotics as a service (RaaS). The company developed a humanoid robot “GenieConnect”, an AI-based voice and video robot that provides engagement and stimuli to promote cognitive retention. Also, it helps in alleviating loneliness. In addition, it integrates with smart home devices and wearables to provide comprehensive and personalized care for users.
Robot Companions helping Dsabled and Geriatric Population to Function Independently
Furthermore, the rising rate of people suffering from disabilities is another factor driving the companion robots market. As per the World Health Organization, 1 in 7 people experience some kind of disability. Companion robot helps to improve the life of such people by assisting them. As per the International Robotics Federation, about 34,000 assistance robots were mainstreamed during the period between 2019 and 2021 so as to facilitate the people suffering from disabilities.
In addition, the development of innovative products by key players is impelling the market growth. For instance, in June 2021, Hanson Robotics launched a robot “Grace”. It is designed to interact with the elderly people and isolated COVID-19 patients. Similarly, Kaspar robot developed by the University of Hertfordshire is a humanoid robot which acts as a companion to improve the lives of children with autism and other communication difficulties. Such initiatives are expected to impel the market growth in forecast period.
Find your sweet spots for generating winning opportunities in this market.
Talk to AnalystWhat are the Challenges Faced by the Healthcare Companion Robots Market?
Expensive nature and unskilled geriatric population affecting growth of healthcare companion robots market
Although healthcare companion robots are becoming popular, the commercialization of the same is expensive. Moreover, certain people with disability have not shown keen interest in investing in healthcare companion robots as it adds to the stigma and intensifies the same.
The usability factor of healthcare companion robots is being questioned as the geriatric population finds it difficult to get accustomed to technology. Furthermore, robots with lesser functions are not finding buyers owing to the constant development of the healthcare companion robots market.
Regional Insights
Increasing Geriatric Population in Asia Pacific Favoring Growth of Healthcare Companion Robots Market?
Government Initiatives supporting use of Healthcare Robots in the Asia Pacific
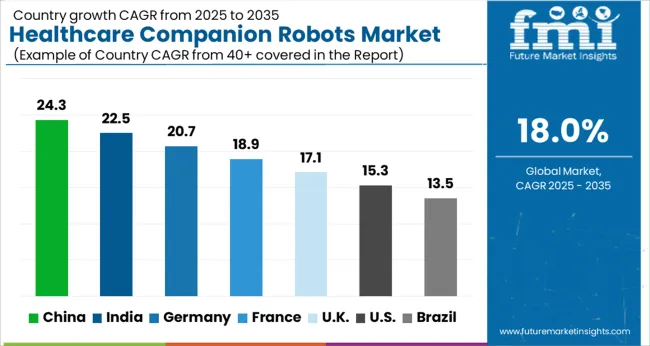
In 2023, Asia Pacific is expected to dominate the healthcare companion robots market with a share of 50%. The increasing geriatric population in the region and various initiatives undertaken by government for the development of companion robot to support elderly population are the major factors contributing to the dominance.
For instance, in September 2022, Myongji Hospital, a healthcare institution in South Korea is working on the development of an AI-driven care robot to assist patients with dementia. Also, the local governments in South Korea have provided companion robot to single persons and those who are living with mental health issues to support their well-being. In addition, the declining rate of healthcare providers in countries like Japan have raised the demand of robots in healthcare facilities.
Strong Presence of Key Companies Bolstering Growth of Healthcare Companion Robots in North America?
Development of innovative products creating lucrative opportunities for healthcare companion robots market in North America
North America is expected to witness the fastest growth rate owing to increasing demand of humanoid robots in healthcare facilities, presence of well-developed healthcare infrastructure and increasing investment by key companies to develop innovative products. Also, the initiatives undertaken by the government for the deployment of companion robots to support the lives of elderly population is expected to impel the market over a forecast period.
The proliferation of artificial intelligence (AI) and machine learning technologies will enable more advanced features in companion robots, thereby driving their demand. Growing awareness about the benefits of using companion robots is likely to fuel their uptake over the forecast period. Rapid advancements in robotics technology are anticipated to result in declining prices of companion robots, making them more affordable for a wider audience. Thus, North America is expected to possess 41% market share for healthcare companion robots market in 2023.

A unified Market Research Subscription Platform, built for today's disparate research needs.
Category-Wise Insights
Minimum Human Errors Increasing Use of Humanoid Robots for Healthcare Companion Market?
Children and geriatric population benefitting from using humanoid robots
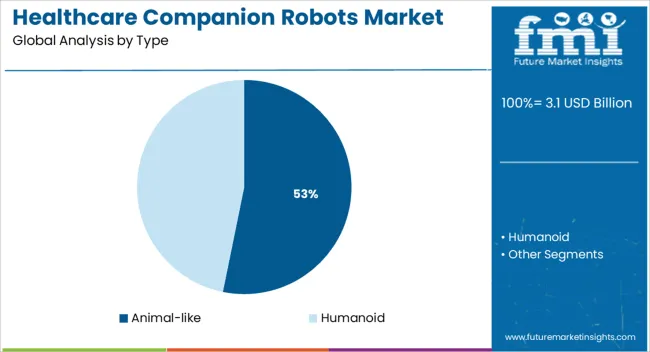
By type, the humanoid segment is expected to hold the largest share of nearly 75% in 2023 due to the benefits offered by these robots such as perfection and minimum human errors. These robots are used for implementation of techno-psychological distraction for children during a medical procedure as it helps to reduce the pain resulting from anxiety and stress.
Furthermore, rise in demand for robotics due to the increasing disabled and aging population to tackle problems that arise from their inabilities to relate effectively with their environment has contributed to the market share of humanoid robot. In addition, humanoid robots are also implemented in “Autism Special Education” where they can engage children with applications designed for special education.
Animal-like robots interacting positively with patients and improving well-being
The animal-like segment is anticipated to expand at the fastest rate over a forecast period. “Paro”, an animal-like robot companion is increasingly used in dementia care due to the positive effects that interaction with these robots can have on the well-being of these patients. Also, these pet/animal designed robots with animal aesthetics and behaviors have particular potential in aged care. They also help in alleviating loneliness in older adults, which is positively impacting the segment growth.
Healthcare Companion Robots Reducing Loneliness and Supporting Geriatric Population?
Companion robots reducing hospitalization for Geriatric Population
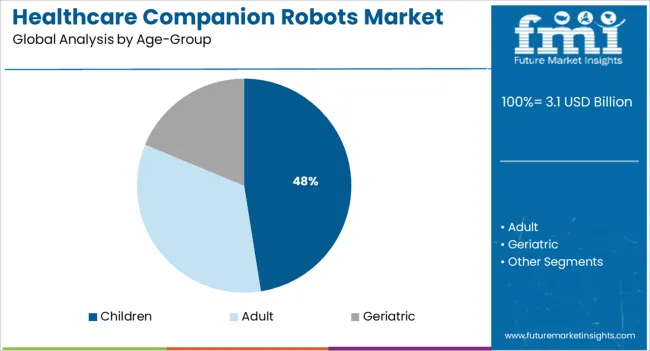
By age-group, the geriatric segment is expected to hold the largest share of 40% in 2023. The use of companion robots has shown a significant improvement in the lives of the elderly population. The integration of technologies has enabled home healthcare and it supports aging at home thereby reducing the risk of falls.
As per a study conducted and published by Bold in December 2021, the use of companion robots has reduced the falls and associated hospitalizations by 46%. Furthermore, the companion robots are in demand to assist people suffering from dementia and may help to reduce the depression and agitation.
Robot Companions supporting emotional and cognitive development of children
The children segment is anticipated to expand at a faster rate in a forecast period owing to rising demand of companion robots to support the emotional and cognitive development in children.
Also, these robots are increasingly used to assist a therapy for children diagnosed with disabilities such as autism. “Buddy the Robot” developed by Blue Frog Robotics, is one such robot which help to assist children with autism. In addition, various innovative product developed by key companies targeting children population is impelling the segment growth. For instance, in 2020, Embodied Inc. launched “Moxie”, with an intent to help children between age of 5 years to 10 years to develop social, cognitive and emotional skills.
Start-Ups for Healthcare Companion Robots Market
Key players in the healthcare companion robots are Cutii, Co-Robotics, Service Robotics, MJI Robotics, Experr Technologies
- US-based start-up Expper Technologies provides Robin, a robot for child care. It uses AI-based emotional intelligence to build peer-to-peer interactions with children and also has a memory network of key points of interaction with each child to continue the conversation.
- French start-up Cutii makes an eponymous mobile, autonomous, and voice-controlled robot for elderly care. It responds to verbal cues and offers a catalog of services and activities as well as supports manual control through a remote.
Market Competition
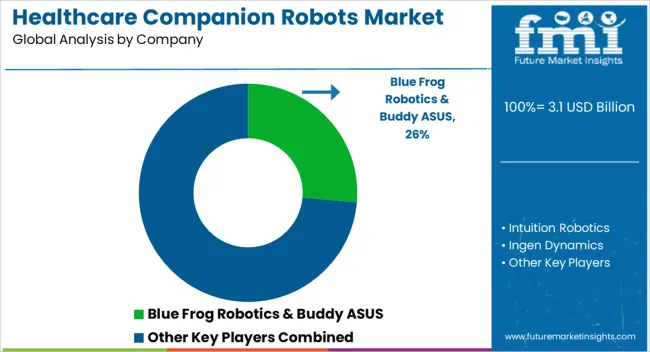
Various strategies such as product development, partnerships, etc. adopted by key players is driving the healthcare companion robots market. Some prominent players in the global healthcare companion robots market include Blue Frog Robotics & Buddy ASUS, Intuition Robotics, inGen Dynamics, PARO Robots U.S., Inc, No Isolation, Luvozo, Honda Robotics, Hanson Robotics, Ubtech, Emotix and Jibo
- In May 2018, Remi AI entered into a partnership with Ikkiworks with an intent to develop the AI language component of the world’s first companion robot for sick children.
- Intuition Robotics entered into a partnership with the New York State, which is home to nearly 4.3 million older adults to deliver companion robots to approximately 800 people in the state.
Report Scope
Report Attribute |
Details |
Market Value in 2023 |
US$ 2.24 Billion |
Market Value in 2033 |
US$ 11.73 Billion |
Growth Rate |
CAGR of 18% from 2023 to 2033 |
Base Year for Estimation |
2021 |
Historical Data |
2018-2022 |
Forecast Period |
2023-2033 |
Quantitative Units |
Revenue in USD Million and CAGR from 2023-2033 |
Report Coverage |
Revenue Forecast, Volume Forecast, Company Ranking, Competitive Landscape, Growth Factors, Trends and Pricing Analysis |
Segments Covered |
|
Regions Covered |
|
Key Countries Profiled |
|
Key Companies Profiled |
|
Customization |
Available Upon Request |
Key Segments Profiled in the Healthcare Companion Robots Industry Survey
Type:
- Animal-like
- Humanoid
Age-Group:
- Children
- Adult
- Geriatric
Region:
- North America
- Latin America
- Europe
- South Asia
- East Asia
- Oceania
- Middle East & Africa
Frequently Asked Questions
From 2018-2022, the healthcare companion robots market grew at a CAGR of 10%
The global healthcare companion robots market is expected to grow with a 18% CAGR during 2023-2033.
As of 2033, the healthcare companion robots market is expected to reach US$ 11.73 Billion
The geriatric segment is expected to hold the largest share of 40% in 2023.
The humanoid segment is expected to hold the largest share of nearly 75% in 2023
North America is expected to possess 41% market share for healthcare companion robots market in 2023.
In 2023, Asia Pacific is expected to dominate the healthcare companion robots market with a share of 50%.
Table of Content
1. Executive Summary
1.1. Global Market Outlook
1.2. Demand-side Trends
1.3. Supply-side Trends
1.4. Technology Roadmap Analysis
1.5. Analysis and Recommendations
2. Market Overview
2.1. Market Coverage / Taxonomy
2.2. Market Definition / Scope / Limitations
3. Market Background
3.1. Market Dynamics
3.1.1. Drivers
3.1.2. Restraints
3.1.3. Opportunity
3.1.4. Trends
3.2. Scenario Forecast
3.2.1. Demand in Optimistic Scenario
3.2.2. Demand in Likely Scenario
3.2.3. Demand in Conservative Scenario
3.3. Opportunity Map Analysis
3.4. Investment Feasibility Matrix
3.5. PESTLE and Porter’s Analysis
3.6. Regulatory Landscape
3.6.1. By Key Regions
3.6.2. By Key Countries
3.7. Regional Parent Market Outlook
4. Global Analysis 2018-2022 and Forecast, 2023-2033
4.1. Historical Market Size Value (US$ Mn) Analysis, 2018-2022
4.2. Current and Future Market Size Value (US$ Mn) Projections, 2023-2033
4.2.1. Y-o-Y Growth Trend Analysis
4.2.2. Absolute $ Opportunity Analysis
5. Global Analysis 2018-2022 and Forecast 2023-2033, By Type
5.1. Introduction / Key Findings
5.2. Historical Market Size Value (US$ Mn) Analysis By Type , 2018-2022
5.3. Current and Future Market Size Value (US$ Mn) Analysis and Forecast By Type , 2023-2033
5.3.1. Animal-like
5.3.2. Humanoid
5.4. Y-o-Y Growth Trend Analysis By Type , 2018-2022
5.5. Absolute $ Opportunity Analysis By Type , 2023-2033
6. Global Analysis 2018-2022 and Forecast 2023-2033, By Age-Group
6.1. Introduction / Key Findings
6.2. Historical Market Size Value (US$ Mn) Analysis By Age-Group, 2018-2022
6.3. Current and Future Market Size Value (US$ Mn) Analysis and Forecast By Age-Group, 2023-2033
6.3.1. Children
6.3.2. Adult
6.3.3. Geriatric
6.4. Y-o-Y Growth Trend Analysis By Age-Group, 2018-2022
6.5. Absolute $ Opportunity Analysis By Age-Group, 2023-2033
7. Global Analysis 2018-2022 and Forecast 2023-2033, By Region
7.1. Introduction
7.2. Historical Market Size Value (US$ Mn) Analysis By Region, 2018-2022
7.3. Current Market Size Value (US$ Mn) Analysis and Forecast By Region, 2023-2033
7.3.1. North America
7.3.2. Latin America
7.3.3. Europe
7.3.4. South Asia
7.3.5. East Asia
7.3.6. Oceania
7.3.7. MEA
7.4. Market Attractiveness Analysis By Region
8. North America Analysis 2018-2022 and Forecast 2023-2033, By Country
8.1. Historical Market Size Value (US$ Mn) Trend Analysis By Market Taxonomy, 2018-2022
8.2. Market Size Value (US$ Mn) Forecast By Market Taxonomy, 2023-2033
8.2.1. By Country
8.2.1.1. U.S.
8.2.1.2. Canada
8.2.2. By Type
8.2.3. By Age-Group
8.3. Market Attractiveness Analysis
8.3.1. By Country
8.3.2. By Type
8.3.3. By Age-Group
8.4. Key Takeaways
9. Latin America Analysis 2018-2022 and Forecast 2023-2033, By Country
9.1. Historical Market Size Value (US$ Mn) Trend Analysis By Market Taxonomy, 2018-2022
9.2. Market Size Value (US$ Mn) Forecast By Market Taxonomy, 2023-2033
9.2.1. By Country
9.2.1.1. Brazil
9.2.1.2. Mexico
9.2.1.3. Rest of Latin America
9.2.2. By Type
9.2.3. By Age-Group
9.3. Market Attractiveness Analysis
9.3.1. By Country
9.3.2. By Type
9.3.3. By Age-Group
9.4. Key Takeaways
10. Europe Analysis 2018-2022 and Forecast 2023-2033, By Country
10.1. Historical Market Size Value (US$ Mn) Trend Analysis By Market Taxonomy, 2018-2022
10.2. Market Size Value (US$ Mn) Forecast By Market Taxonomy, 2023-2033
10.2.1. By Country
10.2.1.1. Germany
10.2.1.2. U.K.
10.2.1.3. France
10.2.1.4. Spain
10.2.1.5. Italy
10.2.1.6. Rest of Europe
10.2.2. By Type
10.2.3. By Age-Group
10.3. Market Attractiveness Analysis
10.3.1. By Country
10.3.2. By Type
10.3.3. By Age-Group
10.4. Key Takeaways
11. South Asia Analysis 2018-2022 and Forecast 2023-2033, By Country
11.1. Historical Market Size Value (US$ Mn) Trend Analysis By Market Taxonomy, 2018-2022
11.2. Market Size Value (US$ Mn) Forecast By Market Taxonomy, 2023-2033
11.2.1. By Country
11.2.1.1. India
11.2.1.2. Malaysia
11.2.1.3. Singapore
11.2.1.4. Thailand
11.2.1.5. Rest of South Asia
11.2.2. By Type
11.2.3. By Age-Group
11.3. Market Attractiveness Analysis
11.3.1. By Country
11.3.2. By Type
11.3.3. By Age-Group
11.4. Key Takeaways
12. East Asia Analysis 2018-2022 and Forecast 2023-2033, By Country
12.1. Historical Market Size Value (US$ Mn) Trend Analysis By Market Taxonomy, 2018-2022
12.2. Market Size Value (US$ Mn) Forecast By Market Taxonomy, 2023-2033
12.2.1. By Country
12.2.1.1. China
12.2.1.2. Japan
12.2.1.3. South Korea
12.2.2. By Type
12.2.3. By Age-Group
12.3. Market Attractiveness Analysis
12.3.1. By Country
12.3.2. By Type
12.3.3. By Age-Group
12.4. Key Takeaways
13. Oceania Analysis 2018-2022 and Forecast 2023-2033, By Country
13.1. Historical Market Size Value (US$ Mn) Trend Analysis By Market Taxonomy, 2018-2022
13.2. Market Size Value (US$ Mn) Forecast By Market Taxonomy, 2023-2033
13.2.1. By Country
13.2.1.1. Australia
13.2.1.2. New Zealand
13.2.2. By Type
13.2.3. By Age-Group
13.3. Market Attractiveness Analysis
13.3.1. By Country
13.3.2. By Type
13.3.3. By Age-Group
13.4. Key Takeaways
14. MEA Analysis 2018-2022 and Forecast 2023-2033, By Country
14.1. Historical Market Size Value (US$ Mn) Trend Analysis By Market Taxonomy, 2018-2022
14.2. Market Size Value (US$ Mn) Forecast By Market Taxonomy, 2023-2033
14.2.1. By Country
14.2.1.1. GCC Countries
14.2.1.2. South Africa
14.2.1.3. Israel
14.2.1.4. Rest of MEA
14.2.2. By Type
14.2.3. By Age-Group
14.3. Market Attractiveness Analysis
14.3.1. By Country
14.3.2. By Type
14.3.3. By Age-Group
14.4. Key Takeaways
15. Key Countries Analysis
15.1. U.S.
15.1.1. Pricing Analysis
15.1.2. Market Share Analysis, 2021
15.1.2.1. By Type
15.1.2.2. By Age-Group
15.2. Canada
15.2.1. Pricing Analysis
15.2.2. Market Share Analysis, 2021
15.2.2.1. By Type
15.2.2.2. By Age-Group
15.3. Brazil
15.3.1. Pricing Analysis
15.3.2. Market Share Analysis, 2021
15.3.2.1. By Type
15.3.2.2. By Age-Group
15.4. Mexico
15.4.1. Pricing Analysis
15.4.2. Market Share Analysis, 2021
15.4.2.1. By Type
15.4.2.2. By Age-Group
15.5. Germany
15.5.1. Pricing Analysis
15.5.2. Market Share Analysis, 2021
15.5.2.1. By Type
15.5.2.2. By Age-Group
15.6. U.K.
15.6.1. Pricing Analysis
15.6.2. Market Share Analysis, 2021
15.6.2.1. By Type
15.6.2.2. By Age-Group
15.7. France
15.7.1. Pricing Analysis
15.7.2. Market Share Analysis, 2021
15.7.2.1. By Type
15.7.2.2. By Age-Group
15.8. Spain
15.8.1. Pricing Analysis
15.8.2. Market Share Analysis, 2021
15.8.2.1. By Type
15.8.2.2. By Age-Group
15.9. Italy
15.9.1. Pricing Analysis
15.9.2. Market Share Analysis, 2021
15.9.2.1. By Type
15.9.2.2. By Age-Group
15.10. India
15.10.1. Pricing Analysis
15.10.2. Market Share Analysis, 2021
15.10.2.1. By Type
15.10.2.2. By Age-Group
15.11. Malaysia
15.11.1. Pricing Analysis
15.11.2. Market Share Analysis, 2021
15.11.2.1. By Type
15.11.2.2. By Age-Group
15.12. Singapore
15.12.1. Pricing Analysis
15.12.2. Market Share Analysis, 2021
15.12.2.1. By Type
15.12.2.2. By Age-Group
15.13. Thailand
15.13.1. Pricing Analysis
15.13.2. Market Share Analysis, 2021
15.13.2.1. By Type
15.13.2.2. By Age-Group
15.14. China
15.14.1. Pricing Analysis
15.14.2. Market Share Analysis, 2021
15.14.2.1. By Type
15.14.2.2. By Age-Group
15.15. Japan
15.15.1. Pricing Analysis
15.15.2. Market Share Analysis, 2021
15.15.2.1. By Type
15.15.2.2. By Age-Group
15.16. South Korea
15.16.1. Pricing Analysis
15.16.2. Market Share Analysis, 2021
15.16.2.1. By Type
15.16.2.2. By Age-Group
15.17. Australia
15.17.1. Pricing Analysis
15.17.2. Market Share Analysis, 2021
15.17.2.1. By Type
15.17.2.2. By Age-Group
15.18. New Zealand
15.18.1. Pricing Analysis
15.18.2. Market Share Analysis, 2021
15.18.2.1. By Type
15.18.2.2. By Age-Group
15.19. GCC Countries
15.19.1. Pricing Analysis
15.19.2. Market Share Analysis, 2021
15.19.2.1. By Type
15.19.2.2. By Age-Group
15.20. South Africa
15.20.1. Pricing Analysis
15.20.2. Market Share Analysis, 2021
15.20.2.1. By Type
15.20.2.2. By Age-Group
15.21. Israel
15.21.1. Pricing Analysis
15.21.2. Market Share Analysis, 2021
15.21.2.1. By Type
15.21.2.2. By Age-Group
16. Market Structure Analysis
16.1. Competition Dashboard
16.2. Competition Benchmarking
16.3. Market Share Analysis of Top Players
16.3.1. By Regional
16.3.2. By Type
16.3.3. By Age-Group
17. Competition Analysis
17.1. Competition Deep Dive
17.1.1. Blue Frog Robotics & Buddy ASUS
17.1.1.1. Overview
17.1.1.2. Product Portfolio
17.1.1.3. Profitability by Market Segments
17.1.1.4. Sales Footprint
17.1.1.5. Strategy Overview
17.1.1.5.1. Marketing Strategy
17.1.2. Intuition Robotics
17.1.2.1. Overview
17.1.2.2. Product Portfolio
17.1.2.3. Profitability by Market Segments
17.1.2.4. Sales Footprint
17.1.2.5. Strategy Overview
17.1.2.5.1. Marketing Strategy
17.1.3. inGen Dynamics
17.1.3.1. Overview
17.1.3.2. Product Portfolio
17.1.3.3. Profitability by Market Segments
17.1.3.4. Sales Footprint
17.1.3.5. Strategy Overview
17.1.3.5.1. Marketing Strategy
17.1.4. PARO Robots U.S., Inc.
17.1.4.1. Overview
17.1.4.2. Product Portfolio
17.1.4.3. Profitability by Market Segments
17.1.4.4. Sales Footprint
17.1.4.5. Strategy Overview
17.1.4.5.1. Marketing Strategy
17.1.5. No Isolation
17.1.5.1. Overview
17.1.5.2. Product Portfolio
17.1.5.3. Profitability by Market Segments
17.1.5.4. Sales Footprint
17.1.5.5. Strategy Overview
17.1.5.5.1. Marketing Strategy
17.1.6. Luvozo
17.1.6.1. Overview
17.1.6.2. Product Portfolio
17.1.6.3. Profitability by Market Segments
17.1.6.4. Sales Footprint
17.1.6.5. Strategy Overview
17.1.6.5.1. Marketing Strategy
17.1.7. Honda Robotics
17.1.7.1. Overview
17.1.7.2. Product Portfolio
17.1.7.3. Profitability by Market Segments
17.1.7.4. Sales Footprint
17.1.7.5. Strategy Overview
17.1.7.5.1. Marketing Strategy
17.1.8. Hanson Robotics
17.1.8.1. Overview
17.1.8.2. Product Portfolio
17.1.8.3. Profitability by Market Segments
17.1.8.4. Sales Footprint
17.1.8.5. Strategy Overview
17.1.8.5.1. Marketing Strategy
17.1.9. Ubtech
17.1.9.1. Overview
17.1.9.2. Product Portfolio
17.1.9.3. Profitability by Market Segments
17.1.9.4. Sales Footprint
17.1.9.5. Strategy Overview
17.1.9.5.1. Marketing Strategy
17.1.10. Emotix
17.1.10.1. Overview
17.1.10.2. Product Portfolio
17.1.10.3. Profitability by Market Segments
17.1.10.4. Sales Footprint
17.1.10.5. Strategy Overview
17.1.10.5.1. Marketing Strategy
17.1.11. Jibo.
17.1.11.1. Overview
17.1.11.2. Product Portfolio
17.1.11.3. Profitability by Market Segments
17.1.11.4. Sales Footprint
17.1.11.5. Strategy Overview
17.1.11.5.1. Marketing Strategy
18. Assumptions & Acronyms Used
19. Research Methodology
Let us know your requirement to get
100% FREE customization
List of Tables
Table 1: Global Value (US$ Mn) Forecast by Region, 2018-2033
Table 2: Global Value (US$ Mn) Forecast by Type , 2018-2033
Table 3: Global Value (US$ Mn) Forecast by Age-Group, 2018-2033
Table 4: North America Value (US$ Mn) Forecast by Country, 2018-2033
Table 5: North America Value (US$ Mn) Forecast by Type , 2018-2033
Table 6: North America Value (US$ Mn) Forecast by Age-Group, 2018-2033
Table 7: Latin America Value (US$ Mn) Forecast by Country, 2018-2033
Table 8: Latin America Value (US$ Mn) Forecast by Type , 2018-2033
Table 9: Latin America Value (US$ Mn) Forecast by Age-Group, 2018-2033
Table 10: Europe Value (US$ Mn) Forecast by Country, 2018-2033
Table 11: Europe Value (US$ Mn) Forecast by Type , 2018-2033
Table 12: Europe Value (US$ Mn) Forecast by Age-Group, 2018-2033
Table 13: South Asia Value (US$ Mn) Forecast by Country, 2018-2033
Table 14: South Asia Value (US$ Mn) Forecast by Type , 2018-2033
Table 15: South Asia Value (US$ Mn) Forecast by Age-Group, 2018-2033
Table 16: East Asia Value (US$ Mn) Forecast by Country, 2018-2033
Table 17: East Asia Value (US$ Mn) Forecast by Type , 2018-2033
Table 18: East Asia Value (US$ Mn) Forecast by Age-Group, 2018-2033
Table 19: Oceania Value (US$ Mn) Forecast by Country, 2018-2033
Table 20: Oceania Value (US$ Mn) Forecast by Type , 2018-2033
Table 21: Oceania Value (US$ Mn) Forecast by Age-Group, 2018-2033
Table 22: MEA Value (US$ Mn) Forecast by Country, 2018-2033
Table 23: MEA Value (US$ Mn) Forecast by Type , 2018-2033
Table 24: MEA Value (US$ Mn) Forecast by Age-Group, 2018-2033
Find your sweet spots for generating winning opportunities in this market.
Talk to AnalystList of Charts
Figure 1: Global Value (US$ Mn) by Type , 2023-2033
Figure 2: Global Value (US$ Mn) by Age-Group, 2023-2033
Figure 3: Global Value (US$ Mn) by Region, 2023-2033
Figure 4: Global Value (US$ Mn) Analysis by Region, 2018-2033
Figure 5: Global Value Share (%) and BPS Analysis by Region, 2023-2033
Figure 6: Global Y-o-Y Growth (%) Projections by Region, 2023-2033
Figure 7: Global Value (US$ Mn) Analysis by Type , 2018-2033
Figure 8: Global Value Share (%) and BPS Analysis by Type , 2023-2033
Figure 9: Global Y-o-Y Growth (%) Projections by Type , 2023-2033
Figure 10: Global Value (US$ Mn) Analysis by Age-Group, 2018-2033
Figure 11: Global Value Share (%) and BPS Analysis by Age-Group, 2023-2033
Figure 12: Global Y-o-Y Growth (%) Projections by Age-Group, 2023-2033
Figure 13: Global Attractiveness by Type , 2023-2033
Figure 14: Global Attractiveness by Age-Group, 2023-2033
Figure 15: Global Attractiveness by Region, 2023-2033
Figure 16: North America Value (US$ Mn) by Type , 2023-2033
Figure 17: North America Value (US$ Mn) by Age-Group, 2023-2033
Figure 18: North America Value (US$ Mn) by Country, 2023-2033
Figure 19: North America Value (US$ Mn) Analysis by Country, 2018-2033
Figure 20: North America Value Share (%) and BPS Analysis by Country, 2023-2033
Figure 21: North America Y-o-Y Growth (%) Projections by Country, 2023-2033
Figure 22: North America Value (US$ Mn) Analysis by Type , 2018-2033
Figure 23: North America Value Share (%) and BPS Analysis by Type , 2023-2033
Figure 24: North America Y-o-Y Growth (%) Projections by Type , 2023-2033
Figure 25: North America Value (US$ Mn) Analysis by Age-Group, 2018-2033
Figure 26: North America Value Share (%) and BPS Analysis by Age-Group, 2023-2033
Figure 27: North America Y-o-Y Growth (%) Projections by Age-Group, 2023-2033
Figure 28: North America Attractiveness by Type , 2023-2033
Figure 29: North America Attractiveness by Age-Group, 2023-2033
Figure 30: North America Attractiveness by Country, 2023-2033
Figure 31: Latin America Value (US$ Mn) by Type , 2023-2033
Figure 32: Latin America Value (US$ Mn) by Age-Group, 2023-2033
Figure 33: Latin America Value (US$ Mn) by Country, 2023-2033
Figure 34: Latin America Value (US$ Mn) Analysis by Country, 2018-2033
Figure 35: Latin America Value Share (%) and BPS Analysis by Country, 2023-2033
Figure 36: Latin America Y-o-Y Growth (%) Projections by Country, 2023-2033
Figure 37: Latin America Value (US$ Mn) Analysis by Type , 2018-2033
Figure 38: Latin America Value Share (%) and BPS Analysis by Type , 2023-2033
Figure 39: Latin America Y-o-Y Growth (%) Projections by Type , 2023-2033
Figure 40: Latin America Value (US$ Mn) Analysis by Age-Group, 2018-2033
Figure 41: Latin America Value Share (%) and BPS Analysis by Age-Group, 2023-2033
Figure 42: Latin America Y-o-Y Growth (%) Projections by Age-Group, 2023-2033
Figure 43: Latin America Attractiveness by Type , 2023-2033
Figure 44: Latin America Attractiveness by Age-Group, 2023-2033
Figure 45: Latin America Attractiveness by Country, 2023-2033
Figure 46: Europe Value (US$ Mn) by Type , 2023-2033
Figure 47: Europe Value (US$ Mn) by Age-Group, 2023-2033
Figure 48: Europe Value (US$ Mn) by Country, 2023-2033
Figure 49: Europe Value (US$ Mn) Analysis by Country, 2018-2033
Figure 50: Europe Value Share (%) and BPS Analysis by Country, 2023-2033
Figure 51: Europe Y-o-Y Growth (%) Projections by Country, 2023-2033
Figure 52: Europe Value (US$ Mn) Analysis by Type , 2018-2033
Figure 53: Europe Value Share (%) and BPS Analysis by Type , 2023-2033
Figure 54: Europe Y-o-Y Growth (%) Projections by Type , 2023-2033
Figure 55: Europe Value (US$ Mn) Analysis by Age-Group, 2018-2033
Figure 56: Europe Value Share (%) and BPS Analysis by Age-Group, 2023-2033
Figure 57: Europe Y-o-Y Growth (%) Projections by Age-Group, 2023-2033
Figure 58: Europe Attractiveness by Type , 2023-2033
Figure 59: Europe Attractiveness by Age-Group, 2023-2033
Figure 60: Europe Attractiveness by Country, 2023-2033
Figure 61: South Asia Value (US$ Mn) by Type , 2023-2033
Figure 62: South Asia Value (US$ Mn) by Age-Group, 2023-2033
Figure 63: South Asia Value (US$ Mn) by Country, 2023-2033
Figure 64: South Asia Value (US$ Mn) Analysis by Country, 2018-2033
Figure 65: South Asia Value Share (%) and BPS Analysis by Country, 2023-2033
Figure 66: South Asia Y-o-Y Growth (%) Projections by Country, 2023-2033
Figure 67: South Asia Value (US$ Mn) Analysis by Type , 2018-2033
Figure 68: South Asia Value Share (%) and BPS Analysis by Type , 2023-2033
Figure 69: South Asia Y-o-Y Growth (%) Projections by Type , 2023-2033
Figure 70: South Asia Value (US$ Mn) Analysis by Age-Group, 2018-2033
Figure 71: South Asia Value Share (%) and BPS Analysis by Age-Group, 2023-2033
Figure 72: South Asia Y-o-Y Growth (%) Projections by Age-Group, 2023-2033
Figure 73: South Asia Attractiveness by Type , 2023-2033
Figure 74: South Asia Attractiveness by Age-Group, 2023-2033
Figure 75: South Asia Attractiveness by Country, 2023-2033
Figure 76: East Asia Value (US$ Mn) by Type , 2023-2033
Figure 77: East Asia Value (US$ Mn) by Age-Group, 2023-2033
Figure 78: East Asia Value (US$ Mn) by Country, 2023-2033
Figure 79: East Asia Value (US$ Mn) Analysis by Country, 2018-2033
Figure 80: East Asia Value Share (%) and BPS Analysis by Country, 2023-2033
Figure 81: East Asia Y-o-Y Growth (%) Projections by Country, 2023-2033
Figure 82: East Asia Value (US$ Mn) Analysis by Type , 2018-2033
Figure 83: East Asia Value Share (%) and BPS Analysis by Type , 2023-2033
Figure 84: East Asia Y-o-Y Growth (%) Projections by Type , 2023-2033
Figure 85: East Asia Value (US$ Mn) Analysis by Age-Group, 2018-2033
Figure 86: East Asia Value Share (%) and BPS Analysis by Age-Group, 2023-2033
Figure 87: East Asia Y-o-Y Growth (%) Projections by Age-Group, 2023-2033
Figure 88: East Asia Attractiveness by Type , 2023-2033
Figure 89: East Asia Attractiveness by Age-Group, 2023-2033
Figure 90: East Asia Attractiveness by Country, 2023-2033
Figure 91: Oceania Value (US$ Mn) by Type , 2023-2033
Figure 92: Oceania Value (US$ Mn) by Age-Group, 2023-2033
Figure 93: Oceania Value (US$ Mn) by Country, 2023-2033
Figure 94: Oceania Value (US$ Mn) Analysis by Country, 2018-2033
Figure 95: Oceania Value Share (%) and BPS Analysis by Country, 2023-2033
Figure 96: Oceania Y-o-Y Growth (%) Projections by Country, 2023-2033
Figure 97: Oceania Value (US$ Mn) Analysis by Type , 2018-2033
Figure 98: Oceania Value Share (%) and BPS Analysis by Type , 2023-2033
Figure 99: Oceania Y-o-Y Growth (%) Projections by Type , 2023-2033
Figure 100: Oceania Value (US$ Mn) Analysis by Age-Group, 2018-2033
Figure 101: Oceania Value Share (%) and BPS Analysis by Age-Group, 2023-2033
Figure 102: Oceania Y-o-Y Growth (%) Projections by Age-Group, 2023-2033
Figure 103: Oceania Attractiveness by Type , 2023-2033
Figure 104: Oceania Attractiveness by Age-Group, 2023-2033
Figure 105: Oceania Attractiveness by Country, 2023-2033
Figure 106: MEA Value (US$ Mn) by Type , 2023-2033
Figure 107: MEA Value (US$ Mn) by Age-Group, 2023-2033
Figure 108: MEA Value (US$ Mn) by Country, 2023-2033
Figure 109: MEA Value (US$ Mn) Analysis by Country, 2018-2033
Figure 110: MEA Value Share (%) and BPS Analysis by Country, 2023-2033
Figure 111: MEA Y-o-Y Growth (%) Projections by Country, 2023-2033
Figure 112: MEA Value (US$ Mn) Analysis by Type , 2018-2033
Figure 113: MEA Value Share (%) and BPS Analysis by Type , 2023-2033
Figure 114: MEA Y-o-Y Growth (%) Projections by Type , 2023-2033
Figure 115: MEA Value (US$ Mn) Analysis by Age-Group, 2018-2033
Figure 116: MEA Value Share (%) and BPS Analysis by Age-Group, 2023-2033
Figure 117: MEA Y-o-Y Growth (%) Projections by Age-Group, 2023-2033
Figure 118: MEA Attractiveness by Type , 2023-2033
Figure 119: MEA Attractiveness by Age-Group, 2023-2033
Figure 120: MEA Attractiveness by Country, 2023-2033
Need specific information?
Request CustomizationExplore Healthcare Insights
View Reports