Reports

- Global Locations -

Headquarters

Future Market Insights, Inc.

Christiana Corporate, 200
Continental Drive, Suite 401,
Newark, Delaware - 19713,
United States

T: +1-845-579-5705

Americas

Future Market Insights, Inc.

616 Corporate Way, Suite 2-9018,
Valley Cottage, NY 10989, United States

T: +1-347-918-3531

MEA

Future Market Insights

1602-6 Jumeirah Bay X2 Tower, Plot No: JLT-PH2-X2A,
Jumeirah Lakes Towers, Dubai,
United Arab Emirates

Europe

Future Market Insights

3rd Floor, 207 Regent Street,
W1B 3HH London
United Kingdom

T: + 44 (0) 20 8123 9659
D: +44 (0) 20 3287 4268

Asia Pacific

Future Market Insights

IndiaLand Global Tech Park, Unit UG-1, Behind Grand HighStreet, Phase 1, Hinjawadi, MH, Pune – 411057, India

Healthcare Business Intelligence Market Outlook (2022 to 2032)

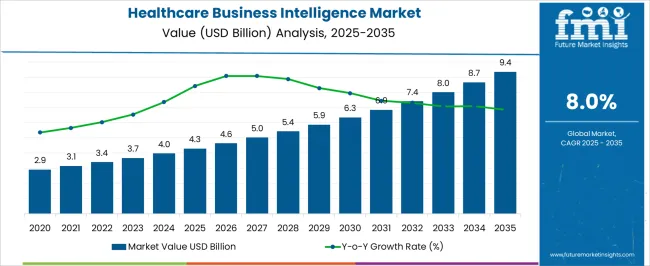
The worldwide healthcare business intelligence market is expected to grow at a modest CAGR of 8.1% between 2022 and 2032. The healthcare business intelligence market is expected to be worth US$ 3.4 Billion in 2022, rising to US$ 7.4 Billion by 2032.

Previously, the market grew at a CAGR of 10.6% (2016 to 2021), with a market size of US$ 3 billion in 2021. Factors influencing the growth of the healthcare business intelligence market are attributed to:

  • With an increasing number of patients, data penetration is rising in the healthcare industry. Furthermore, the growing incidence of chronic diseases and the healthcare help required to treat them is driving up demand for healthcare business information systems.
  • Developing economies such as India and China spend heavily on Research and Development efforts to improve healthcare business models.
  • Another element boosting sales of healthcare business intelligence systems is the increasing healthcare industry, which includes federal and private companies developing distribution channels in new market economies, cooperating with one another, and providing a foundation for manufacturers to build on.

Because of market limitations and logistics prohibitions imposed by countries throughout the world, COVID-19 has disrupted several worldwide markets by disrupting supply chains. There were, however, a few markets that benefited from the pandemic's influence.

The healthcare business intelligence sector is one of those that benefited significantly from the introduction of COVID-19. The increasing prevalence of coronavirus in most locations has raised the number of patients accessing healthcare facilities.

As the number of patients increases, so does the need to capture patient-related data and link it with worldwide systems. As a result, the industry expanded tremendously, increasing global revenue for healthcare business intelligence solutions.

According to a global assessment of the healthcare business intelligence industry, COVID-19's influence on this market has been minimal, even helping its expansion in new areas.

As a result of the large number of patients affected by the novel coronavirus who visited hospitals and clinics, the healthcare business intelligence market was able to extend its distribution channels in newly emerging nations. As a result, there is a high need for healthcare business information solutions.

Data Points Key Statistics
Expected Market Value in 2022 US$ 3.4 Billion
Projected Market Value in 2032 US$ 7.4 Billion
Growth Rate (2022 to 2032) 8.1% CAGR

Don't pay for what you don't need

Customize your report by selecting specific countries or regions and save 30%!

Development Of Healthcare Business Intelligence Market In The North America

The largest market is North America, which is growing at a 7.2% CAGR between 2022 and 2032. By the end of 2032, the area is predicted to have revenue of US$ 2.1 Billion in the healthcare business intelligence industry.

New industrial units are established, government activities surrounding research and development programs, and the government's substantial investment in hospitals and other healthcare services are propelling growth in this region.

Opportunities Abound In The Self-Service BI Segment

In the healthcare business intelligence sector, the most profitable model is self-service BI. Through the projection period, the sector in the healthcare business intelligence market flourishes with a robust growth rate, making it the largest section of the model category.

Though the corporate category does well in the market, healthcare experts believe that keeping patient data with self-service BI is safe and secure. This boosts sales of healthcare business intelligence tools in this market area. Another factor driving this category is the widespread availability of personal servers that end users may configure and maintain.

Changing healthcare dynamics including the adoption of Electronic Health Record (EHR) Systems and data-driven approaches flourished by government initiatives are set to push the growth of the healthcare business intelligence market.

Demand for healthcare business intelligence systems is also likely to rise, owing to the integration of healthcare devices to the new technologically based data directories trends. Sales of healthcare business intelligence systems are likely to rise as it strengthens disease management and makes it easy for the end user to extract the best information.

Sabyasachi Ghosh
Sabyasachi Ghosh

Principal Consultant

Talk to Analyst

Find your sweet spots for generating winning opportunities in this market.

What Is The COVID-19 Impact On The Healthcare Business Intelligence Market?

Covid-19 has impacted multiple global markets by disturbing the supply chains because of the market restrictions and logistics bans introduced by governments around the world. However, there were a handful of markets that benefitted from the pandemic's impact.

The healthcare business intelligence market is one of those markets that got slightly benefitted from the advent of covid-19. The number of patients visiting healthcare units has increased due to the high penetration of coronavirus in most regions.

As the patient number skyrockets, the need to document patient-related data and integrate it with the global systems generates. This led the market to grow exponentially, adding more global revenue for healthcare business intelligence systems.

A global study on the healthcare business intelligence market shows that covid-19's impact on this market has been less comparatively, even contributing to its growth in new markets. It helped the healthcare business intelligence market to expand its distribution channels in new developing countries as the huge number of people who got infected by the novel coronavirus visited hospitals and clinics.

This led to a huge demand for healthcare business intelligence systems.

What Are The Key Dynamics Governing The Growth Of The Healthcare Business Intelligence Market?

Covid-19 and other the growth of other healthcare markets provide enough substantial data that explains how the use of healthcare business intelligence systems will be in high demand during the forecast period as they are helpful for healthcare business owners in converting revenue.

The healthcare business intelligence market is driven by multiple factors that help the market grow: the increasing acceptance of new-generation advanced technologies, research & development initiatives, and huge investments in the healthcare industry.

The penetration of data is exceeding in the healthcare sector with the growing number of patients. In addition, the increased number of chronic diseases and the healthcare assistance needed for them is pushing the demand for healthcare business intelligence systems.

It provides the industry with data-centric strategic systems that store the data and provides substantial solutions to end-users. With the introduction of Industries 4.0 and artificial intelligence, machine learning is strengthening the healthcare business industry, improving the structure and making it more efficient and effective for healthcare operations.

These include Critical Care Units, Health Data Management systems, and Electronic Health Records (EHR). These systems digitize the healthcare units, making it easier for the medical end-user to know the history of the patient and optimize their treatment for better understanding and diagnosis of the disease.

As patient traffic rises in the government healthcare structures, the government has introduced various research and development programs to create more opportunities for the market ecosystem.

Developing economies like India and China invest huge amounts in research and development programs to enhance healthcare business models. Another factor driving the sales of healthcare business intelligence systems is the growing healthcare sector that involves federal and private players expanding the distribution channels in new market economies, partnering with each other, and providing the base structure for the manufacturers to work on.

This involves government plans for idea generation through various engineering schemes that have introduced the concept of big data into integrated healthcare systems.

The high cost attached to the research and development proficiencies is restraining the market and restricting its demand. As these systems are new to the market, the price range lies in the high bracket.

The lack of investment in underdeveloped economies and a handful of manufacturing facilities are also stooping down the growth of the healthcare business intelligence market. Another restraint for the market is the lack of technologically advanced medical professionals who can optimize this system into networks and access the data.

High maintenance costs associated with these intelligence systems and the need for upgraded systems in a frequent amount of time are also restricting the market’s growth.

Get the data you need at a Fraction of the cost

Personalize your report by choosing insights you need
and save 40%!

Comparative View Of Adjacent Healthcare Business Intelligence Market

Healthcare Business Intelligence Market :

Attributes Healthcare Business Intelligence Market
CAGR (2022 to 2032) 8.1%
Market Value (2027) US$ 7.4 Billion
Growth Factor The high adoption rate of cutting-edge medical technology like EHR and high investment by the government in research and development programs are driving the market
Opportunity A high adoption rate is providing an opportunity for new markets to open up and set up new manufacturing units.
Key Trends New cloud storage brings various opportunities for the better integration of data within the organization’s servers.

Healthcare Analytics Market :

Attributes Healthcare Analytics Market
CAGR (2022 to 2032) 26.3%
Market Value (2027) US$ 75.1 Billion
Growth Factor Increased acceptance and implementation of Electronic Health Record (EHR) Systems by the government to enhance the medical structure.
Opportunity Future healthcare trends show new opportunities rising due to the high demand for healthcare analytics from the medical care units
Key Trends More quality-oriented, easy, and accessible systems that provide efficiency and accuracy, making them value-based for the end users are in market trend.

Big Data Healthcare :

Attributes Big Data Healthcare
CAGR (2022 to 2032) 15.43%
Market Value (2027) US$ 58.4 Billion
Growth Factor The prevention and treatment of chronic diseases through the help of big data is the biggest driving factor for the big data healthcare market.
Opportunity Covid-19 has created an opportunity for the big data healthcare market as it has been a storage provider for thousands of patients
Key Trends New upward trends show that cutting-edge technology and advanced medical systems strengthen big data healthcare systems.

The introduction of cloud computing and integrated machinery set the trend for the healthcare business intelligence market, making it accessible for medical professionals to analyze a case that comes to their end and holds a history with the organization.

The tons of data can’t store or zipped to systems available in medical healthcare organizations. Cloud storage provides storage space with real-time management and provides various new opportunities to the healthcare business intelligence market. Big data healthcare systems, and healthcare analytics, are going to be a part of the upward trend, helping the healthcare business intelligence market.

What Is The Segmentation Outlook For The Healthcare Business Intelligence Market?

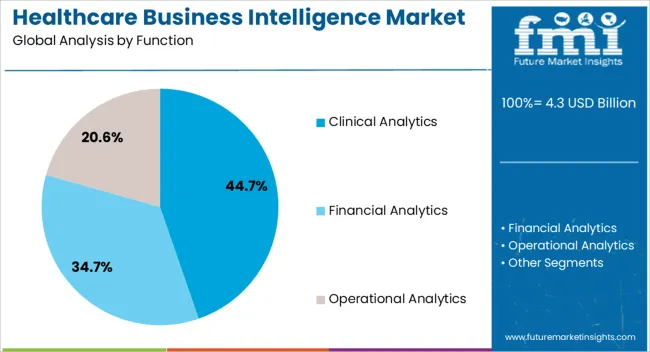
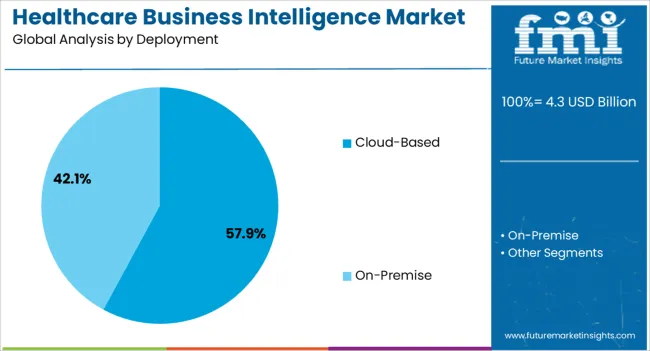
The healthcare business intelligence market is categorized into function, deployment, and model. The function category is segmented into clinical analytics, financial analytics, and operational analytics. The deployment category is further segmented into on-premise and cloud-based deployment in the healthcare business intelligence market.

Lastly, the model category is divided into self-service BI and corporate BI. These segments are increasing their market spaces in newly developed health sectors around the world and perform differently in multiple regions.

Which Segment Is Likely To Lead The Healthcare Business Intelligence Market By Function?

By function, clinical analytics is the largest segment and is likely to hold the biggest portion of the healthcare business intelligence market in the forecast period. The analytics show that clinical analytics is set to thrive at 11.5% in the forecast period. Previously, the same segment was proliferating at a CAGR of 13.1%.

The factors behind the growth of this segment are the high penetration of patients coming to hospitals, especially because of covid-19. Other segments like financial analytics and operational analytics are also growing into developing regions.

Which Segment Is Likely To Lead The Healthcare Business Intelligence Market By Deployment?

By deployment, on-premise is the biggest segment in the deployment category and is likely to be the largest portion in the forecast period. It is growing at a CAGR of 7.9% between 2022 and 2032, which was previously recorded as 9.7% between 2015 and 2026.

The factors behind the growth of on-premise deployment are the new generation of medical care systems that get integrated through the on-premise deployment and implemented easily. While with other types of deployments, the process becomes lethargic and time taking.

Which Segment is Likely to Lead the Healthcare Business Intelligence Market by Model?

By model, the most lucrative segment is self-service BI in the healthcare business intelligence market. The segment in the healthcare business intelligence market thrives with a strong growth rate through the forecast period, making it the biggest segment of the model category.

Though the corporate segment also does well in the market storing the patient’s data with self-service BI has considered safe and secure by healthcare professionals. This pushes the sales of healthcare business intelligence products for this segment. Another driver that drives this segment is the easy availability of personal servers that can adjust and be managed by the end-users.

What Is The Regional Analysis For The Healthcare Business Intelligence Market?

Regions CAGR (2022 to 2032)
USA Healthcare Business Intelligence Market 7.2%
Brazil Healthcare Business Intelligence Market 7.2%
China Healthcare Business Intelligence Market 8.8%
India Healthcare Business Intelligence Market 12.8%
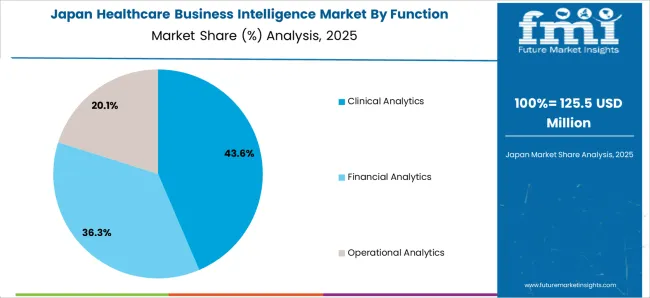
Japan Healthcare Business Intelligence Market 7.9%

The healthcare business intelligence market is divided into regions; North America, Latin America, Asia Pacific, Middle East and Africa (MEA), and Europe. The biggest market is the United States, which is thriving at a CAGR of 7.2% between 2022 to 2032.

The region is expected to hold a revenue of US$ 2.1 Billion in the healthcare business intelligence market by the end of 2032. New manufacturing units are opening up, government initiatives around the research and development programs, and high expenditure on hospitals and other healthcare services by the government are fueling the growth in this region.

Other regional healthcare business intelligence markets like the Asia Pacific are the highest growing region for healthcare business intelligence market as developing countries build and strengthen their healthcare structure.

For instance, the Indian healthcare business intelligence market could hold US$ 680 Million by the end of 2032 as it thrives on a strong CAGR of 12.8% between 2022 to 2032. China also grows along with India, with a forecasted value of US$ 564.2 Million at a CAGR of 8.8% between 2022 to 2032.

How Is The Competition In The Healthcare Business Intelligence Market?

The competitive landscape of the healthcare business intelligence market is dynamic in nature and allows new competitors to thrive in the market and increase competitiveness. The companies in the healthcare business intelligence market are a part of mergers and collaborations that result in increased distribution channels and market spaces.

These companies operating in the healthcare business intelligence market focus on upgrading the software, making it accessible to use, and increasing the segmentation more widely.

Recent Developments in the Healthcare Business Intelligence Market

  • Knarr Analytics LLC has tied up with Qlik Technologies Inc in order to upgrade Qlik’s cloud platform to increase its capability, increasing the overall sales of healthcare business intelligence.
  • Oracle has acquired Zenedge to ensure the security of critical IT systems deployed with the help of on-premise, cloud, or even hybrid hosting environments, fueling the demand for healthcare intelligence systems.
  • Microsoft has tied up with SAP SE to drive sales and expands its roots through new distribution channels.

Key Players

  • IBM Corporation
  • Microsoft
  • Oracle Corporation
  • OpenText Corporation

Key Segments

By Function:

  • Clinical Analytics
  • Financial Analytics
  • Operational Analytics

By Deployment:

  • On-Premise
  • Cloud-Based

By Deployment:

  • Self-service BI
  • Corporate BI

By Region:

  • USA
  • Brazil
  • India
  • China
  • Japan

Frequently Asked Questions

What is the CAGR of the Healthcare Business Intelligence Market?

The healthcare business intelligence market is set to grow at a CAGR of 8.1% during the forecast period.

Which is the Leading Region in the Healthcare Business Intelligence Market?

The USA is the biggest region in the healthcare business intelligence market with a CAGR of 7.2% during the forecast period.

Which Segment leads in the Healthcare Business Intelligence Market by Function?

Clinical Analytics is the leading segment in the healthcare business intelligence market by function.

What is the Growth Estimated for the Healthcare Business Intelligence Market by 2032?

The healthcare business intelligence market is set to reach US$ 4 Billion by 2032.

Which Region has the Highest Growth Potential in the Healthcare Business Intelligence Market?

Asia Pacific has the highest growth potential in the healthcare business intelligence market, where India has the highest growth rate of 12.8% during the forecast period.

Table of Content

1. Preface | Healthcare Business Intelligence Market

    1.1. Report Description

    1.2. Report Scope

    1.3. Research Methodology

2. Executive Summary

    2.1. Market Snapshot: Global Market

    2.2. Global Market Revenue, 2022 to 2032 (US$ Million) and Y-o-Y Growth (%)

3. Global Market Analysis, 2022 to 2032 (US$ Million)

    3.1. Overview

    3.2. Market Dynamics

        3.2.1. Drivers

        3.2.2. Restraints

        3.2.3. Opportunities

    3.3. Key Trends Analysis

    3.4. Global Market Analysis, By Function, 2022 to 2032 (US$ Million)

        3.4.1. Clinical Analytics

        3.4.2. Financial Analytics

        3.4.3. Operational Analytics

        3.4.4. Others

    3.5. Global Market Analysis, By Deployment Type, 2022 to 2032 (US$ Million)

        3.5.1. On-premise

        3.5.2. Cloud

    3.6. Global Market Analysis, By Model Type, 2022 to 2032 (US$ Million)

        3.6.1. Self-service BI

        3.6.2. Corporate BI

    3.7. Competitive Landscape

        3.7.1. Market Positioning of Key Players, 2021

        3.7.2. Competitive Strategies Adopted by Leading Players

4. North America Market Analysis, 2022 to 2032 (US$ Million)

    4.1. North America Market Analysis, By Function, 2022 to 2032 (US$ Million)

        4.1.1. Clinical Analytics

        4.1.2. Financial Analytics

        4.1.3. Operational Analytics

        4.1.4. Others

    4.2. North America Market Analysis, By Deployment Type, 2022 to 2032 (US$ Million)

        4.2.1. On-premise

        4.2.2. Cloud

    4.3. North America Market Analysis, By Model Type, 2022 to 2032 (US$ Million)

        4.3.1. Self-service BI

        4.3.2. Corporate BI

    4.4. North America Market Analysis, By Region, 2022 to 2032 (US$ Million)

        4.4.1. USA

        4.4.2. Rest of North America

5. Europe Water Analysis, 2022 to 2032 (US$ Million)

    5.1. Europe Market Analysis, By Function, 2022 to 2032 (US$ Million)

        5.1.1. Clinical Analytics

        5.1.2. Financial Analytics

        5.1.3. Operational Analytics

        5.1.4. Others

    5.2. Europe Market Analysis, By Deployment Type, 2022 to 2032 (US$ Million)

        5.2.1. On-premise

        5.2.2. Cloud

    5.3. Europe Market Analysis, By Model Type, 2022 to 2032 (US$ Million)

        5.3.1. Self-service BI

        5.3.2. Corporate BI

    5.4. Europe Market Analysis, By Region, 2022 to 2032 (US$ Million)

        5.4.1. EU7

        5.4.2. CIS

        5.4.3. Rest of Europe

6. Asia Pacific Market Analysis, 2022 to 2032 (US$ Million)

    6.1. Asia Pacific Market Analysis, By Function, 2022 to 2032 (US$ Million)

        6.1.1. Clinical Analytics

        6.1.2. Financial Analytics

        6.1.3. Operational Analytics

        6.1.4. Others

    6.2. Asia Pacific Market Analysis, By Deployment Type, 2022 to 2032 (US$ Million)

        6.2.1. On-premise

        6.2.2. Cloud

    6.3. Asia Pacific Market Analysis, By Model Type, 2022 to 2032 (US$ Million)

        6.3.1. Self-service BI

        6.3.2. Corporate BI

    6.4. Asia Pacific Market Analysis, By Region, 2022 to 2032 (US$ Million)

        6.4.1. Japan

        6.4.2. China

        6.4.3. Indian Subcontinent

        6.4.4. Australasia

        6.4.5. Rest of Asia Pacific

7. Middle East & Africa (MEA) Market Analysis, 2022 to 2032 (US$ Million)

    7.1. Middle East and Africa(MEA) Market Analysis, By Function, 2022 to 2032 (US$ Million)

        7.1.1. Clinical Analytics

        7.1.2. Financial Analytics

        7.1.3. Operational Analytics

        7.1.4. Others

    7.2. Middle East and Africa(MEA) Market Analysis, By Deployment Type, 2022 to 2032 (US$ Million)

        7.2.1. On-premise

        7.2.2. Cloud

    7.3. Middle East and Africa(MEA) Market Analysis, By Model Type, 2022 to 2032 (US$ Million)

        7.3.1. Self-service BI

        7.3.2. Corporate BI

    7.4. Middle East and Africa(MEA) Market Analysis, By Region, 2022 to 2032 (US$ Million)

        7.4.1. GCC Countries

        7.4.2. Southern Africa

        7.4.3. North Africa

        7.4.4. Rest of Middle East and Africa(MEA)

8. Latin America Market Analysis, 2022 to 2032 (US$ Million)

    8.1. Latin America Market Analysis, By Function, 2022 to 2032 (US$ Million)

        8.1.1. Clinical Analytics

        8.1.2. Financial Analytics

        8.1.3. Operational Analytics

        8.1.4. Others

    8.2. Latin America Market Analysis, By Deployment Type, 2022 to 2032 (US$ Million)

        8.2.1. On-premise

        8.2.2. Cloud

    8.3. Latin America Market Analysis, By Model Type, 2022 to 2032 (US$ Million)

        8.3.1. Self-service BI

        8.3.2. Corporate BI

    8.4. Latin America Water Purifier Market Analysis, By Region, 2022 to 2032 (US$ Million)

        8.4.1. Brazil

        8.4.2. Rest of Latin America

9. Company Profiles

    9.1. SAP SE

    9.2. IBM Corporation

    9.3. Microsoft Corporation

    9.4. SAS Institute, Inc.

    9.5. Information Builders

    9.6. Oracle Corporation

    9.7. OpenText Corporation

List of Tables

Table 1: Global Market Volume (Tons) and Value (US$ Million), By Function Type, 2022 to 2032

Table 2: Global Market Volume (Tons) and Value (US$ Million), By Function Type, 2022 to 2032

Table 3: Global Market Volume (Tons) and Value (US$ Million), By Deployment, 2022 to 2032

Table 4: Global Market Volume (Tons) and Value (US$ Million), By Deployment, 2022 to 2032

Table 5: Global Market Volume (Tons) and Value (US$ Million), By Model, 2022 to 2032

Table 6: Global Market Volume (Tons) and Value (US$ Million), By Model, 2022 to 2032

Table 7: Global Market, By Region, 2022 to 2032

Table 8: Global Market, By Region, 2022 to 2032

Table 9: North America Market Volume (Tons) and Value (US$ Million), By Function Type, 2022 to 2032

Table 10: North America Market Volume (Tons) and Value (US$ Million), By Function Type, 2022 to 2032

Table 11: North America Market Volume (Tons) and Value (US$ Million), By Deployment, 2022 to 2032

Table 12: North America Market Volume (Tons) and Value (US$ Million), By Deployment, 2022 to 2032

Table 13: North America Market Volume (Tons) and Value (US$ Million), By Model, 2022 to 2032

Table 14: North America Market Volume (Tons) and Value (US$ Million), By Model, 2022 to 2032

Table 15: North America Market, By Country, 2022 to 2032

Table 16: North America Market, By Country, 2022 to 2032

Table 17: Latin America Market Volume (Tons) and Value (US$ Million), By Function Type, 2022 to 2032

Table 18: Latin America Market Volume (Tons) and Value (US$ Million), By Function Type, 2022 to 2032

Table 19: Latin America Market Volume (Tons) and Value (US$ Million), By Deployment, 2022 to 2032

Table 20: Latin America Market Volume (Tons) and Value (US$ Million), By Deployment, 2022 to 2032

Table 21: Latin America Market Volume (Tons) and Value (US$ Million), By Model, 2022 to 2032

Table 22: Latin America Market Volume (Tons) and Value (US$ Million), By Model, 2022 to 2032

Table 23: Latin America Market, By Country, 2022 to 2032

Table 24: Latin America Market, By Country, 2022 to 2032

Table 25: Europe Market Volume (Tons) and Value (US$ Million), By Function Type, 2022 to 2032

Table 26: Europe Market Volume (Tons) and Value (US$ Million), By Function Type, 2022 to 2032

Table 27: Europe Market Volume (Tons) and Value (US$ Million), By Deployment, 2022 to 2032

Table 28: Europe Market Volume (Tons) and Value (US$ Million), By Deployment, 2022 to 2032

Table 29: Europe Market Volume (Tons) and Value (US$ Million), By Model, 2022 to 2032

Table 30: Europe Market Volume (Tons) and Value (US$ Million), By Model, 2022 to 2032

Table 31: Europe Market, By Country, 2022 to 2032

Table 32: Europe Market, By Country, 2022 to 2032

Table 33: East Asia Market Volume (Tons) and Value (US$ Million), By Function Type, 2022 to 2032

Table 34: East Asia Market Volume (Tons) and Value (US$ Million), By Function Type, 2022 to 2032

Table 35: East Asia Market Volume (Tons) and Value (US$ Million), By Deployment, 2022 to 2032

Table 36: East Asia Market Volume (Tons) and Value (US$ Million), By Deployment, 2022 to 2032

Table 37: East Asia Market Volume (Tons) and Value (US$ Million), By Model, 2022 to 2032

Table 38: East Asia Market Volume (Tons) and Value (US$ Million), By Model, 2022 to 2032

Table 39: East Asia Market, By Country, 2022 to 2032

Table 40: East Asia Market, By Country, 2022 to 2032

Table 41: South Asia Market Volume (Tons) and Value (US$ Million), By Function Type, 2022 to 2032

Table 42: South Asia Market Volume (Tons) and Value (US$ Million), By Function Type, 2022 to 2032

Table 43: South Asia Market Volume (Tons) and Value (US$ Million), By Deployment, 2022 to 2032

Table 44: South Asia Market Volume (Tons) and Value (US$ Million), By Deployment, 2022 to 2032

Table 45: South Asia Market Volume (Tons) and Value (US$ Million), By Model, 2022 to 2032

Table 46: South Asia Market Volume (Tons) and Value (US$ Million), By Model, 2022 to 2032

Table 47: South Asia Market, By Country, 2022 to 2032

Table 48: South Asia Market, By Country, 2022 to 2032

Table 49: Oceania Market Volume (Tons) and Value (US$ Million), By Function Type, 2022 to 2032

Table 50: Oceania Market Volume (Tons) and Value (US$ Million), By Function Type, 2022 to 2032

Table 51: Oceania Market Volume (Tons) and Value (US$ Million), By Deployment, 2022 to 2032

Table 52: Oceania Market Volume (Tons) and Value (US$ Million), By Deployment, 2022 to 2032

Table 53: Oceania Market Volume (Tons) and Value (US$ Million), By Model, 2022 to 2032

Table 54: Oceania Market Volume (Tons) and Value (US$ Million), By Model, 2022 to 2032

Table 55: Oceania Market, By Country, 2022 to 2032

Table 56: Oceania Market, By Country, 2022 to 2032

Table 57: MEA Market Volume (Tons) and Value (US$ Million), By Function Type, 2022 to 2032

Table 58: MEA Market Volume (Tons) and Value (US$ Million), By Function Type, 2022 to 2032

Table 59: MEA Market Volume (Tons) and Value (US$ Million), By Deployment, 2022 to 2032

Table 60: MEA Market Volume (Tons) and Value (US$ Million), By Deployment, 2022 to 2032

Table 61: MEA Market Volume (Tons) and Value (US$ Million), By Model, 2022 to 2032

Table 62: MEA Market Volume (Tons) and Value (US$ Million), By Model, 2022 to 2032

Table 63: MEA Market, By Country, 2022 to 2032

Table 64: MEA Market, By Country, 2022 to 2032

Table 65: Global Market Incremental $ Opportunity, By Function Type, 2022 to 2032

Table 66: Global Market Incremental $ Opportunity, By Deployment, 2022 to 2032

Table 67: Global Market Incremental $ Opportunity, By Model, 2022 to 2032

Table 68: Global Market Incremental $ Opportunity, by Region, 2022 to 2032

Table 69: North America Market Incremental $ Opportunity, By Function Type, 2022 to 2032

Table 70: North America Market Incremental $ Opportunity, By Deployment, 2022 to 2032

Table 71: North America Market Incremental $ Opportunity, By Model, 2022 to 2032

Table 72: North America Market Incremental $ Opportunity, by Country, 2022 to 2032

Table 73: Latin America Market Incremental $ Opportunity, By Function Type, 2022 to 2032

Table 74: Latin America Market Incremental $ Opportunity, By Deployment, 2022 to 2032

Table 75: Latin America Market Incremental $ Opportunity, By Model, 2022 to 2032

Table 76: Latin America Market Incremental $ Opportunity, by Country, 2022 to 2032

Table 77: Europe Market Incremental $ Opportunity, By Function Type, 2022 to 2032

Table 78: Europe Market Incremental $ Opportunity, By Deployment, 2022 to 2032

Table 79: Europe Market Incremental $ Opportunity, By Model, 2022 to 2032

Table 80: Europe Market Incremental $ Opportunity, by Country, 2022 to 2032

Table 81: East Asia Market Incremental $ Opportunity, By Function Type, 2022 to 2032

Table 82: East Asia Market Incremental $ Opportunity, By Deployment, 2022 to 2032

Table 83: East Asia Market Incremental $ Opportunity, By Model, 2022 to 2032

Table 84: East Asia Market Incremental $ Opportunity, by Country, 2022 to 2032

Table 85: South Asia Market Incremental $ Opportunity, By Function Type, 2022 to 2032

Table 86: South Asia Market Incremental $ Opportunity, By Deployment, 2022 to 2032

Table 87: South Asia Market Incremental $ Opportunity, By Model, 2022 to 2032

Table 88: South Asia Market Incremental $ Opportunity, by Country, 2022 to 2032

Table 89: Oceania Market Incremental $ Opportunity, By Function Type, 2022 to 2032

Table 90: Oceania Market Incremental $ Opportunity, By Deployment, 2022 to 2032

Table 91: Oceania Market Incremental $ Opportunity, By Model, 2022 to 2032

Table 92: Oceania Market Incremental $ Opportunity, by Country, 2022 to 2032

Table 93: MEA Market Incremental $ Opportunity, By Function Type, 2022 to 2032

Table 94: MEA Market Incremental $ Opportunity, By Deployment, 2022 to 2032

Table 95: MEA Market Incremental $ Opportunity, By Model, 2022 to 2032

Table 96: MEA Market Incremental $ Opportunity, by Country, 2022 to 2032

List of Charts

Figure 1: Global Market Value (US$ Bn) and Year-on-Year Growth, 2022 to 2032

Figure 2: Global Market Absolute $ Historical Gain (2016 to 2021) and Opportunity (2022 to 2032), US$ Million

Figure 3: Global Market Share, By Function Type, 2021 & 2032

Figure 4: Global Market Y-o-Y Growth Projections, Function Type – (2022 to 2032)

Figure 5: Global Market Attractiveness Index, Function Type – (2022 to 2032)

Figure 6: Global Market Share, By Deployment, 2021 & 2032

Figure 7: Global Market Y-o-Y Growth Projections, By Deployment – (2022 to 2032)

Figure 8: Global Market Attractiveness Index, By Deployment – (2022 to 2032)

Figure 9: Global Market Share, By Model, 2021 & 2032

Figure 10: Global Market Y-o-Y Growth Projections, By Model – (2022 to 2032)

Figure 11: Global Market Attractiveness Index, By Model – (2022 to 2032)

Figure 12: Global Market Share, By Model, 2021 & 2032

Figure 13: Global Market Y-o-Y Growth Projections, By Model – (2022 to 2032)

Figure 14: Global Market Attractiveness Index, By Model – (2022 to 2032)

Figure 15: Global Market Share, by Region, 2021 & 2032

Figure 16: Global Market Y-o-Y Growth Projections, by Region – (2022 to 2032)

Figure 17: Global Market Attractiveness Index, by Region – (2022 to 2032)

Figure 18: North America Market Value (US$ Bn) and Year-on-Year Growth, 2022 to 2032

Figure 19: North America Market Absolute $ Opportunity Historical (2016 to 2021) and Forecast Period (2022 to 2032), US$ Million

Figure 20: North America Market Share, Function Type, 2021 & 2032

Figure 21: North America Market Y-o-Y Growth Projections, Function Type – (2022 to 2032)

Figure 22: North America Market Attractiveness Index, Function Type – (2022 to 2032)

Figure 23: North America Market Share, By Deployment, 2021 & 2032

Figure 24: North America Market Y-o-Y Growth Projections, By Deployment – (2022 to 2032)

Figure 25: North America Market Attractiveness Index, By Deployment – (2022 to 2032)

Figure 26: North America Market Share, By Model, 2021 & 2032

Figure 27: North America Market Y-o-Y Growth Projections, By Model – (2022 to 2032)

Figure 28: North America Market Attractiveness Index, By Model – (2022 to 2032)

Figure 29: North America Market Share, By Model, 2021 & 2032

Figure 30: North America Market Y-o-Y Growth Projections, By Model – (2022 to 2032)

Figure 31: North America Market Attractiveness Index, By Model – (2022 to 2032)

Figure 32: North America Market Share, by Country, 2021 & 2032

Figure 33: North America Market Y-o-Y Growth Projections, by Country – (2022 to 2032)

Figure 34: North America Market Attractiveness Index, by Country – (2022 to 2032)

Figure 35: Latin America Market Value (US$ Million) and Year-on-Year Growth, 2022 to 2032

Figure 36: Latin America Market Absolute $ Opportunity Historical (2016 to 2021) and Forecast Period (2022 to 2032), US$ Million

Figure 37: Latin America Market Share, Function Type, 2021 & 2032

Figure 38: Latin America Market Y-o-Y Growth Projections, Function Type – (2022 to 2032)

Figure 39: Latin America Market Attractiveness Index, Function Type – (2022 to 2032)

Figure 40: Latin America Market Share, By Deployment, 2021 & 2032

Figure 41: Latin America Market Y-o-Y Growth Projections, By Deployment – (2022 to 2032)

Figure 42: Latin America Market Attractiveness Index, By Deployment – (2022 to 2032)

Figure 43: Latin America Market Share, By Model, 2021 & 2032

Figure 44: Latin America Market Y-o-Y Growth Projections, By Model – (2022 to 2032)

Figure 45: Latin America Market Attractiveness Index, By Model – (2022 to 2032)

Figure 46: Latin America Market Share, By Model, 2021 & 2032

Figure 47: Latin America Market Y-o-Y Growth Projections, By Model – (2022 to 2032)

Figure 48: Latin America Market Attractiveness Index, By Model – (2022 to 2032)

Figure 49: Latin America Market Share, by Country, 2021 & 2032

Figure 51: Latin America Market Y-o-Y Growth Projections, by Country – (2022 to 2032)

Figure 52: Latin America Market Attractiveness Index, by Country – (2022 to 2032)

Figure 53: Europe Market Value (US$ Million) and Year-on-Year Growth, 2022 to 2032

Figure 54: Europe Market Absolute $ Opportunity Historical (2016 to 2021) and Forecast Period (2022 to 2032), US$ Million

Figure 55: Europe Market Share, Function Type, 2021 & 2032

Figure 56: Europe Market Y-o-Y Growth Projections, Function Type – (2022 to 2032)

Figure 57: Europe Market Attractiveness Index, Function Type – (2022 to 2032)

Figure 58: Europe Market Share, By Deployment, 2021 & 2032

Figure 59: Europe Market Y-o-Y Growth Projections, By Deployment – (2022 to 2032)

Figure 60: Europe Market Attractiveness Index, By Deployment – (2022 to 2032)

Figure 61: Europe Market Share, By Model, 2021 & 2032

Figure 62: Europe Market Y-o-Y Growth Projections, By Model – (2022 to 2032)

Figure 63: Europe Market Attractiveness Index, By Model – (2022 to 2032)

Figure 64: Europe Market Share, By Model, 2021 & 2032

Figure 65: Europe Market Y-o-Y Growth Projections, By Model – (2022 to 2032)

Figure 66: Europe Market Attractiveness Index, By Model – (2022 to 2032)

Figure 67: Europe Market Share, by Country, 2021 & 2032

Figure 68: Europe Market Y-o-Y Growth Projections, by Country – (2022 to 2032)

Figure 69: Europe Market Attractiveness Index, by Country – (2022 to 2032)

Figure 71: MEA Market Value (US$ Million) and Year-on-Year Growth, 2022 to 2032

Figure 72: MEA Market Absolute $ Opportunity Historical (2016 to 2021) and Forecast Period (2022 to 2032), US$ Million

Figure 73: MEA Market Share, Function Type, 2021 & 2032

Figure 74: MEA Market Y-o-Y Growth Projections, Function Type – (2022 to 2032)

Figure 75: MEA Market Attractiveness Index, Function Type – (2022 to 2032)

Figure 76: MEA Market Share, By Deployment, 2021 & 2032

Figure 77: MEA Market Y-o-Y Growth Projections, By Deployment – (2022 to 2032)

Figure 78: MEA Market Attractiveness Index, By Deployment – (2022 to 2032)

Figure 79: MEA Market Share, By Model, 2021 & 2032

Figure 80: MEA Market Y-o-Y Growth Projections, By Model – (2022 to 2032)

Figure 81: MEA Market Attractiveness Index, By Model – (2022 to 2032)

Figure 82: MEA Market Share, By Model, 2021 & 2032

Figure 83: MEA Market Y-o-Y Growth Projections, By Model – (2022 to 2032)

Figure 84: MEA Market Attractiveness Index, By Model – (2022 to 2032)

Figure 85: MEA Market Share, by Country, 2021 & 2032

Figure 86: MEA Market Y-o-Y Growth Projections, by Country – (2022 to 2032)

Figure 87: MEA Market Attractiveness Index, by Country – (2022 to 2032)

Figure 88: East Asia Market Value (US$ Million) and Year-on-Year Growth, 2015-2030

Figure 89: East Asia Market Absolute $ Opportunity Historical (2016 to 2019) and Forecast Period (2020 to 2030), US$ Million

Figure 90: East Asia Market Share, Function Type, 2021 & 2032

Figure 91: East Asia Market Y-o-Y Growth Projections, Function Type – (2022 to 2032)

Figure 92: East Asia Market Attractiveness Index, Function Type – (2022 to 2032)

Figure 93: East Asia Market Share, By Deployment, 2021 & 2032

Figure 94: East Asia Market Y-o-Y Growth Projections, By Deployment – (2022 to 2032)

Figure 95: East Asia Market Attractiveness Index, By Deployment – (2022 to 2032)

Figure 96: East Asia Market Share, By Model, 2021 & 2032

Figure 97: East Asia Market Y-o-Y Growth Projections, By Model – (2022 to 2032)

Figure 98: East Asia Market Attractiveness Index, By Model – (2022 to 2032)

Figure 99: East Asia Market Share, By Model, 2021 & 2032

Figure 100: East Asia Market Y-o-Y Growth Projections, By Model – (2022 to 2032)

Figure 101: East Asia Market Attractiveness Index, By Model – (2022 to 2032)

Figure 102: East Asia Market Share, by Country, 2021 & 2032

Figure 103: East Asia Market Y-o-Y Growth Projections, by Country – (2022 to 2032)

Figure 104: East Asia Market Attractiveness Index, by Country – (2022 to 2032)

Figure 105: South Asia Market Value (US$ Million) and Year-on-Year Growth, 2022 to 2032

Figure 106: South Asia Market Absolute $ Opportunity Historical (2016 to 2021) and Forecast Period (2022 to 2032), US$ Million

Figure 107: South Asia Market Share, Function Type, 2021 & 2032

Figure 108: South Asia Market Y-o-Y Growth Projections, Function Type – (2022 to 2032)

Figure 109: South Asia Market Attractiveness Index, Function Type – (2022 to 2032)

Figure 110: South Asia Market Share, By Deployment, 2021 & 2032

Figure 111: South Asia Market Y-o-Y Growth Projections, By Deployment – (2022 to 2032)

Figure 112: South Asia Market Attractiveness Index, By Deployment – (2022 to 2032)

Figure 113: South Asia Market Share, By Model, 2021 & 2032

Figure 114: South Asia Market Y-o-Y Growth Projections, By Model – (2022 to 2032)

Figure 115: South Asia Market Attractiveness Index, By Model – (2022 to 2032)

Figure 116: South Asia Market Share, By Model, 2021 & 2032

Figure 117: South Asia Market Y-o-Y Growth Projections, By Model – (2022 to 2032)

Figure 118: South Asia Market Attractiveness Index, By Model – (2022 to 2032)

Figure 119: South Asia Market Share, by Country, 2021 & 2032

Figure 120: South Asia Market Y-o-Y Growth Projections, by Country – (2022 to 2032)

Figure 121: South Asia Market Attractiveness Index, by Country – (2022 to 2032)

Figure 122: Oceania Market Value (US$ Million) and Year-on-Year Growth, 2022 to 2032

Figure 123: Oceania Market Absolute $ Opportunity Historical (2016 to 2021) and Forecast Period (2022 to 2032), US$ Million

Figure 124: Oceania Market Share, Function Type, 2021 & 2032

Figure 125: Oceania Market Y-o-Y Growth Projections, Function Type – (2022 to 2032)

Figure 126: Oceania Market Attractiveness Index, Function Type – (2022 to 2032)

Figure 127: Oceania Market Share, By Deployment, 2021 & 2032

Figure 128: Oceania Market Y-o-Y Growth Projections, By Deployment – (2022 to 2032)

Figure 129: Oceania Market Attractiveness Index, By Deployment – (2022 to 2032)

Figure 130: Oceania Market Share, By Model, 2021 & 2032

Figure 131: Oceania Market Y-o-Y Growth Projections, By Model – (2022 to 2032)

Figure 132: Oceania Market Attractiveness Index, By Model – (2022 to 2032)

Figure 133: Oceania Market Share, By Model, 2021 & 2032

Figure 134: Oceania Market Y-o-Y Growth Projections, By Model – (2022 to 2032)

Figure 135: Oceania Market Attractiveness Index, By Model – (2022 to 2032)

Figure 136: Oceania Market Share, by Country, 2021 & 2032

Figure 137: Oceania Market Y-o-Y Growth Projections, by Country – (2022 to 2032)

Figure 138: Oceania Market Attractiveness Index, by Country – (2022 to 2032)

Figure 139: USA Market Value (US$ Million) and Forecast, 2022 to 2032

Figure 140: USA Market Share, Function Type, 2021

Figure 141: USA Market Share, By Deployment, 2021

Figure 142: USA Market Share, By Model, 2021

Figure 143: Canada Market Value (US$ Million) and Forecast, 2022 to 2032

Figure 144: Canada Market Share, Function Type, 2021

Figure 145: Canada Market Share, By Deployment, 2021

Figure 146: Canada Market Share, By Model, 2021

Figure 147: Brazil Market Value (US$ Million) and Forecast, 2022 to 2032

Figure 148: Brazil Market Share, Function Type, 2021

Figure 149: Brazil Market Share, By Deployment, 2021

Figure 150: Brazil Market Share, By Model, 2021

Figure 151: Mexico Market Value (US$ Million) and Forecast, 2022 to 2032

Figure 152: Mexico Market Share, Function Type, 2021

Figure 153: Mexico Market Share, By Deployment, 2021

Figure 154: Mexico Market Share, By Model, 2021

Figure 155: Germany Market Value (US$ Million) and Forecast, 2022 to 2032

Figure 156: Germany Market Share, Function Type, 2021

Figure 157: Germany Market Share, By Deployment, 2021

Figure 158: Germany Market Share, By Model, 2021

Figure 159: United Kingdom Market Value (US$ Million) and Forecast, 2022 to 2032

Figure 160: United Kingdom Market Share, Function Type, 2021

Figure 161: United Kingdom Market Share, By Deployment, 2021

Figure 162: United Kingdom Market Share, By Model, 2021

Figure 163: France Market Value (US$ Million) and Forecast, 2022 to 2032

Figure 164: France Market Share, Function Type, 2021

Figure 165: France Market Share, By Deployment, 2021

Figure 166: France Market Share, By Model, 2021

Figure 167: Italy Market Value (US$ Million) and Forecast, 2022 to 2032

Figure 168: Italy Market Share, Function Type, 2021

Figure 169: Italy Market Share, By Deployment, 2021

Figure 170: Italy Market Share, By Model, 2021

Figure 171: BENELUX Market Value (US$ Million) and Forecast, 2022 to 2032

Figure 172: BENELUX Market Share, Function Type, 2021

Figure 173: BENELUX Market Share, By Deployment, 2021

Figure 174: BENELUX Market Share, By Model, 2021

Figure 175: China Market Value (US$ Million) and Forecast, 2022 to 2032

Figure 176: China Market Share, Function Type, 2021

Figure 177: China Market Share, By Deployment, 2021

Figure 178: China Market Share, By Model, 2021

Figure 179: Japan Market Value (US$ Million) and Forecast, 2022 to 2032

Figure 180: Japan Market Share, Function Type, 2021

Figure 181: Japan Market Share, By Deployment, 2021

Figure 182: Japan Market Share, By Model, 2021

Figure 183: South Korea Market Value (US$ Million) and Forecast, 2022 to 2032

Figure 184: South Korea Market Share, Function Type, 2021

Figure 185: South Korea Market Share, By Deployment, 2021

Figure 186: South Korea Market Share, By Model, 2021

Figure 187: India Market Value (US$ Million) and Forecast, 2022 to 2032

Figure 188: India Market Share, Function Type, 2021

Figure 189: India Market Share, By Deployment, 2021

Figure 190: India Market Share, By Model, 2021

Figure 191: Indonesia Market Value (US$ Million) and Forecast, 2022 to 2032

Figure 192: Indonesia Market Share, Function Type, 2021

Figure 193: Indonesia Market Share, By Deployment, 2021

Figure 194: Indonesia Market Share, By Model, 2021

Figure 195: Singapore Market Value (US$ Million) and Forecast, 2022 to 2032

Figure 196: Singapore Market Share, Function Type, 2021

Figure 197: Singapore Market Share, By Deployment, 2021

Figure 198: Singapore Market Share, By Model, 2021

Figure 199: Australia Market Value (US$ Million) and Forecast, 2022 to 2032

Figure 200: Australia Market Share, Function Type, 2021

Figure 201: Australia Market Share, By Deployment, 2021

Figure 202: Australia Market Share, By Model, 2021

Figure 203: New Zealand Market Value (US$ Million) and Forecast, 2022 to 2032

Figure 204: New Zealand Market Share, Function Type, 2021

Figure 205: New Zealand Market Share, By Deployment, 2021

Figure 206: New Zealand Market Share, By Model, 2021

Figure 207: GCC Countries Market Value (US$ Million) and Forecast, 2022 to 2032

Figure 208: GCC Countries Market Share, Function Type, 2021

Figure 209: GCC Countries Market Share, By Deployment, 2021

Figure 210: GCC Countries Market Share, By Model, 2021

Figure 211: South Africa Market Value (US$ Million) and Forecast, 2022 to 2032

Figure 212: South Africa Market Share, Function Type, 2021

Figure 213: South Africa Market Share, By Deployment, 2021

Figure 214: South Africa Market Share, By Model, 2021

Figure 215: Turkey Market Value (US$ Million) and Forecast, 2022 to 2032

Figure 216: Turkey Market Share, Function Type, 2021

Figure 217: Turkey Market Share, By Deployment, 2021

Figure 218: Turkey Market Share, By Model, 2021

Recommendations

Healthcare

Connected Healthcare Market

Published : January 2023

Healthcare

Animal Healthcare Market

Published : January 2023

Healthcare

Home Healthcare Software Market

Published : September 2022

Healthcare

Wearable Healthcare Devices Market

Published : May 2022

Explore Healthcare Insights

View Reports

Healthcare Business Intelligence Market