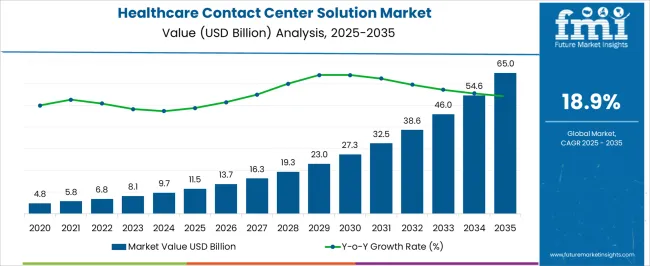
The global healthcare contact center solutions market is anticipated to reach USD 7,999.6 million in 2023. The market is projected to surpass a valuation of USD 49,256.8 million by 2033, growing at a CAGR of 19.9% through 2033. In the historical period from 2018 to 2022, the healthcare contact center solutions market witnessed a CAGR of 19.9%.
Attribute | Details |
---|---|
Healthcare Contact Center Solutions Market Historical Growth Rate (2018 to 2022) | 17.8% |
Healthcare Contact Center Solutions Market Value (2023) | USD 7,999.6 million |
Healthcare Contact Center Solutions Market Anticipated Forecast Value (2033) | USD 49,256.8 million |
Healthcare Contact Center Solutions Market Projected Growth Rate (2023 to 2033) | 19.9% |
Healthcare contact center solutions offer hospitals several advantages, including balanced patient care, proactive web interaction, and enhanced payment and collection processes to enhance the patient experience. The requirement for healthcare contact center solutions is increasing quickly as most hospitals hunt for new and creative methods to interact with their current and future patients. Additionally, by implementing cutting-edge contact center technology, hospitals can improve the efficiency of their operating processes.
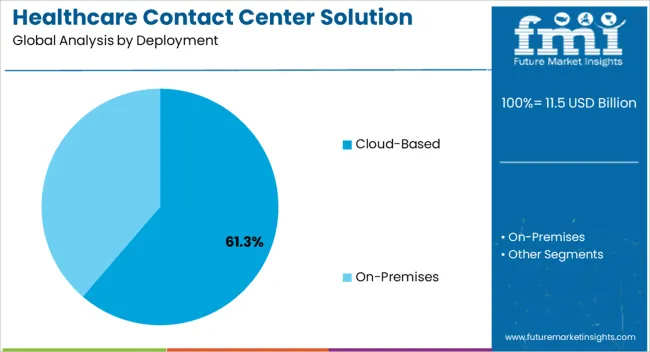
Throughout the forecast period, the market for healthcare contact center solutions is anticipated to increase due to the widespread usage of cloud-based solutions and services in contact centers. Additionally, it is projected that the market for healthcare contact center solutions would expand due to the rising need for quick and efficient customer solutions.
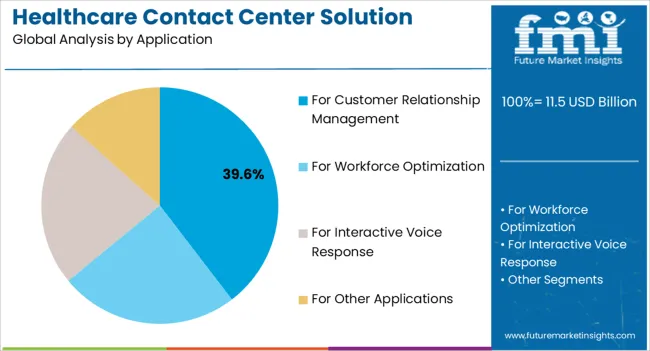
The quick transition from analog to digital technologies and the widespread use of next-generation IVR with superior voice recognition in the healthcare sector is also projected to benefit the market's expansion for contact center solutions for healthcare providers.
The market is expanding due to major emergent dynamics such as AI, visual assistance, and data analytics. The rising need for quick and efficient client solutions creates revenue possibilities. Businesses now depend more than ever on contact centers to handle the additional demand brought on by the pandemic.
In addition, it is anticipated that there will be a significant increase in demand for healthcare contact center solutions due to the cost savings and widespread adoption of cutting-edge contact center technology solutions that help hospitals improve their operational efficiencies.
Obstacles projected to limit market expansion include compliance and regulatory challenges for product approvals. Additionally, one of the main market limitations is the high cost of Research and Development associated with the manufacture and development of healthcare contact center solutions.
The healthcare contact center solutions market is dominated by North America, which is predicted to retain a market share of 31.1% by 2023. The enormous increase is the adoption of cloud-based contact center solutions by both small and large businesses in the healthcare sector. Furthermore, it is projected that the strong need for quick and efficient customer solutions would foster the expansion of the regional industry. Additionally, the rapid transition from analog to digital technologies and the widespread use of next-generation IVR with superior voice recognition in the healthcare industry is projected to benefit the market's expansion.
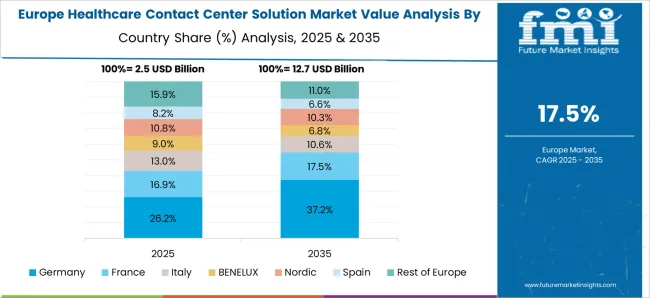
Due to extensive research and development, the second-largest healthcare contact center solutions market is in Europe. Additionally, several significant firms are trying to bolster their position in Europe through acquisitions, expansions, product launches, and approvals. The fast growth of hospital application fields, which makes it unavoidable for hospitals to move their IT infrastructure to the cloud in the future and opens up several new options, is predicted to drive demand for healthcare contact center solutions in Europe. Thus, as a result of these factors, it is anticipated that in 2023 Europe would hold a 23.3% market share for healthcare contact center solutions.
In terms of market share for healthcare contact center solutions in 2023, Asia Pacific is anticipated to account for 25%. Due to the region's vast population and rising investment in research and development from public or private healthcare organizations, it is predicted that this region will account for a significant portion of the worldwide market for healthcare contact center solutions. Additionally, it is anticipated that there will be a significant increase in demand for healthcare contact center solutions. The market is likely to expand due to the low cost and widespread adoption of cutting-edge contact center technology solutions that allow hospitals to streamline their operational efficiencies.
Many new companies are entering the marketplace with unique inventions due to a very high level of competition.
Example:
Since the healthcare contact center solutions market is extremely competitive, a clearly perceptible trend that is being noticed everywhere is that large organizations are now looking to conduct a certain business-related activity in a country that provides favorable legislation.
For instance, in September 2021, the medical information (MI) Contact Center services offered by IQVIA, a global provider of advanced analytics, technological solutions, and clinical research services to the life sciences sector, were enhanced with new AI-powered technologies. Companies in the life sciences sector utilize IQVIA's MI Contact Center services to monitor product quality and safety, provide information about new products and relevant therapeutic areas, and share information about new goods. To do this, teams of knowledgeable agents directly answer queries from customers, patients, and healthcare professionals (HCPs) worldwide. IQVIA's MI Contact Center services now employ AI-powered virtual agents alongside knowledgeable human agents to triage and answer inquiries. This mix of AI-powered agents and human agents produces faster reaction times and reporting of negative events or quality issues.
Attribute | Details |
---|---|
Growth Rate | CAGR of 19.9% from 2023 to 2033 |
Base Year for Estimation | 2022 |
Historical Data | 2018 to 2022 |
Forecast Period | 2023 to 2033 |
Quantitative Units | Revenue in USD million, Volume in Kilotons, and CAGR from 2023 to 2033 |
Report Coverage | Revenue Forecast, Volume Forecast, Company Ranking, Competitive Landscape, Growth Factors, Trends, and Pricing Analysis |
Segments Covered | Deployment, Application, Service, Enterprise Type, Region |
Regions Covered | North America; Latin America; The Asia Pacific; Middle East and Africa; Europe |
Key Countries Profiled | United States of America, Canada, Brazil, Argentina, Germany, United Kingdom, France, Spain, Italy, Nordics, BENELUX, Australia & New Zealand, China, India, ASEAN, GCC Countries, South Africa |
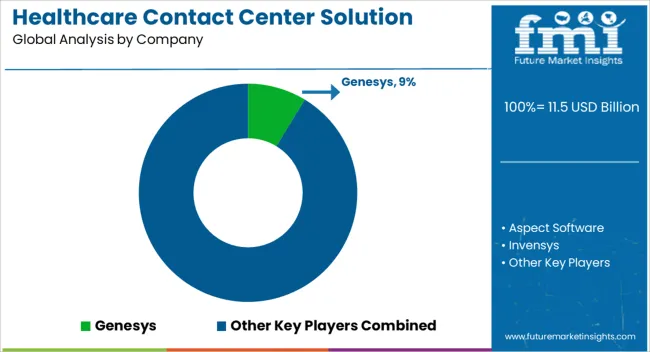
Key Companies Profiled | Genesys; Aspect Software; Invensys; DATAMARK Incorporated; Aspect; Ozonetel; Virtusa Corporation. |
Customization | Available Upon Request |
Table 1: Global Market Value (US$ Million) Forecast by Region, 2018 to 2033
Table 2: Global Market Value (US$ Million) Forecast by Deployment, 2018 to 2033
Table 3: Global Market Value (US$ Million) Forecast by Application, 2018 to 2033
Table 4: Global Market Value (US$ Million) Forecast by Service, 2018 to 2033
Table 5: Global Market Value (US$ Million) Forecast by Enterprise Type, 2018 to 2033
Table 6: North America Market Value (US$ Million) Forecast by Country, 2018 to 2033
Table 7: North America Market Value (US$ Million) Forecast by Deployment, 2018 to 2033
Table 8: North America Market Value (US$ Million) Forecast by Application, 2018 to 2033
Table 9: North America Market Value (US$ Million) Forecast by Service, 2018 to 2033
Table 10: North America Market Value (US$ Million) Forecast by Enterprise Type, 2018 to 2033
Table 11: Latin America Market Value (US$ Million) Forecast by Country, 2018 to 2033
Table 12: Latin America Market Value (US$ Million) Forecast by Deployment, 2018 to 2033
Table 13: Latin America Market Value (US$ Million) Forecast by Application, 2018 to 2033
Table 14: Latin America Market Value (US$ Million) Forecast by Service, 2018 to 2033
Table 15: Latin America Market Value (US$ Million) Forecast by Enterprise Type, 2018 to 2033
Table 16: Western Europe Market Value (US$ Million) Forecast by Country, 2018 to 2033
Table 17: Western Europe Market Value (US$ Million) Forecast by Deployment, 2018 to 2033
Table 18: Western Europe Market Value (US$ Million) Forecast by Application, 2018 to 2033
Table 19: Western Europe Market Value (US$ Million) Forecast by Service, 2018 to 2033
Table 20: Western Europe Market Value (US$ Million) Forecast by Enterprise Type, 2018 to 2033
Table 21: Eastern Europe Market Value (US$ Million) Forecast by Country, 2018 to 2033
Table 22: Eastern Europe Market Value (US$ Million) Forecast by Deployment, 2018 to 2033
Table 23: Eastern Europe Market Value (US$ Million) Forecast by Application, 2018 to 2033
Table 24: Eastern Europe Market Value (US$ Million) Forecast by Service, 2018 to 2033
Table 25: Eastern Europe Market Value (US$ Million) Forecast by Enterprise Type, 2018 to 2033
Table 26: South Asia and Pacific Market Value (US$ Million) Forecast by Country, 2018 to 2033
Table 27: South Asia and Pacific Market Value (US$ Million) Forecast by Deployment, 2018 to 2033
Table 28: South Asia and Pacific Market Value (US$ Million) Forecast by Application, 2018 to 2033
Table 29: South Asia and Pacific Market Value (US$ Million) Forecast by Service, 2018 to 2033
Table 30: South Asia and Pacific Market Value (US$ Million) Forecast by Enterprise Type, 2018 to 2033
Table 31: East Asia Market Value (US$ Million) Forecast by Country, 2018 to 2033
Table 32: East Asia Market Value (US$ Million) Forecast by Deployment, 2018 to 2033
Table 33: East Asia Market Value (US$ Million) Forecast by Application, 2018 to 2033
Table 34: East Asia Market Value (US$ Million) Forecast by Service, 2018 to 2033
Table 35: East Asia Market Value (US$ Million) Forecast by Enterprise Type, 2018 to 2033
Table 36: Middle East and Africa Market Value (US$ Million) Forecast by Country, 2018 to 2033
Table 37: Middle East and Africa Market Value (US$ Million) Forecast by Deployment, 2018 to 2033
Table 38: Middle East and Africa Market Value (US$ Million) Forecast by Application, 2018 to 2033
Table 39: Middle East and Africa Market Value (US$ Million) Forecast by Service, 2018 to 2033
Table 40: Middle East and Africa Market Value (US$ Million) Forecast by Enterprise Type, 2018 to 2033
Figure 1: Global Market Value (US$ Million) by Deployment, 2023 to 2033
Figure 2: Global Market Value (US$ Million) by Application, 2023 to 2033
Figure 3: Global Market Value (US$ Million) by Service, 2023 to 2033
Figure 4: Global Market Value (US$ Million) by Enterprise Type, 2023 to 2033
Figure 5: Global Market Value (US$ Million) by Region, 2023 to 2033
Figure 6: Global Market Value (US$ Million) Analysis by Region, 2018 to 2033
Figure 7: Global Market Value Share (%) and BPS Analysis by Region, 2023 to 2033
Figure 8: Global Market Y-o-Y Growth (%) Projections by Region, 2023 to 2033
Figure 9: Global Market Value (US$ Million) Analysis by Deployment, 2018 to 2033
Figure 10: Global Market Value Share (%) and BPS Analysis by Deployment, 2023 to 2033
Figure 11: Global Market Y-o-Y Growth (%) Projections by Deployment, 2023 to 2033
Figure 12: Global Market Value (US$ Million) Analysis by Application, 2018 to 2033
Figure 13: Global Market Value Share (%) and BPS Analysis by Application, 2023 to 2033
Figure 14: Global Market Y-o-Y Growth (%) Projections by Application, 2023 to 2033
Figure 15: Global Market Value (US$ Million) Analysis by Service, 2018 to 2033
Figure 16: Global Market Value Share (%) and BPS Analysis by Service, 2023 to 2033
Figure 17: Global Market Y-o-Y Growth (%) Projections by Service, 2023 to 2033
Figure 18: Global Market Value (US$ Million) Analysis by Enterprise Type, 2018 to 2033
Figure 19: Global Market Value Share (%) and BPS Analysis by Enterprise Type, 2023 to 2033
Figure 20: Global Market Y-o-Y Growth (%) Projections by Enterprise Type, 2023 to 2033
Figure 21: Global Market Attractiveness by Deployment, 2023 to 2033
Figure 22: Global Market Attractiveness by Application, 2023 to 2033
Figure 23: Global Market Attractiveness by Service, 2023 to 2033
Figure 24: Global Market Attractiveness by Enterprise Type, 2023 to 2033
Figure 25: Global Market Attractiveness by Region, 2023 to 2033
Figure 26: North America Market Value (US$ Million) by Deployment, 2023 to 2033
Figure 27: North America Market Value (US$ Million) by Application, 2023 to 2033
Figure 28: North America Market Value (US$ Million) by Service, 2023 to 2033
Figure 29: North America Market Value (US$ Million) by Enterprise Type, 2023 to 2033
Figure 30: North America Market Value (US$ Million) by Country, 2023 to 2033
Figure 31: North America Market Value (US$ Million) Analysis by Country, 2018 to 2033
Figure 32: North America Market Value Share (%) and BPS Analysis by Country, 2023 to 2033
Figure 33: North America Market Y-o-Y Growth (%) Projections by Country, 2023 to 2033
Figure 34: North America Market Value (US$ Million) Analysis by Deployment, 2018 to 2033
Figure 35: North America Market Value Share (%) and BPS Analysis by Deployment, 2023 to 2033
Figure 36: North America Market Y-o-Y Growth (%) Projections by Deployment, 2023 to 2033
Figure 37: North America Market Value (US$ Million) Analysis by Application, 2018 to 2033
Figure 38: North America Market Value Share (%) and BPS Analysis by Application, 2023 to 2033
Figure 39: North America Market Y-o-Y Growth (%) Projections by Application, 2023 to 2033
Figure 40: North America Market Value (US$ Million) Analysis by Service, 2018 to 2033
Figure 41: North America Market Value Share (%) and BPS Analysis by Service, 2023 to 2033
Figure 42: North America Market Y-o-Y Growth (%) Projections by Service, 2023 to 2033
Figure 43: North America Market Value (US$ Million) Analysis by Enterprise Type, 2018 to 2033
Figure 44: North America Market Value Share (%) and BPS Analysis by Enterprise Type, 2023 to 2033
Figure 45: North America Market Y-o-Y Growth (%) Projections by Enterprise Type, 2023 to 2033
Figure 46: North America Market Attractiveness by Deployment, 2023 to 2033
Figure 47: North America Market Attractiveness by Application, 2023 to 2033
Figure 48: North America Market Attractiveness by Service, 2023 to 2033
Figure 49: North America Market Attractiveness by Enterprise Type, 2023 to 2033
Figure 50: North America Market Attractiveness by Country, 2023 to 2033
Figure 51: Latin America Market Value (US$ Million) by Deployment, 2023 to 2033
Figure 52: Latin America Market Value (US$ Million) by Application, 2023 to 2033
Figure 53: Latin America Market Value (US$ Million) by Service, 2023 to 2033
Figure 54: Latin America Market Value (US$ Million) by Enterprise Type, 2023 to 2033
Figure 55: Latin America Market Value (US$ Million) by Country, 2023 to 2033
Figure 56: Latin America Market Value (US$ Million) Analysis by Country, 2018 to 2033
Figure 57: Latin America Market Value Share (%) and BPS Analysis by Country, 2023 to 2033
Figure 58: Latin America Market Y-o-Y Growth (%) Projections by Country, 2023 to 2033
Figure 59: Latin America Market Value (US$ Million) Analysis by Deployment, 2018 to 2033
Figure 60: Latin America Market Value Share (%) and BPS Analysis by Deployment, 2023 to 2033
Figure 61: Latin America Market Y-o-Y Growth (%) Projections by Deployment, 2023 to 2033
Figure 62: Latin America Market Value (US$ Million) Analysis by Application, 2018 to 2033
Figure 63: Latin America Market Value Share (%) and BPS Analysis by Application, 2023 to 2033
Figure 64: Latin America Market Y-o-Y Growth (%) Projections by Application, 2023 to 2033
Figure 65: Latin America Market Value (US$ Million) Analysis by Service, 2018 to 2033
Figure 66: Latin America Market Value Share (%) and BPS Analysis by Service, 2023 to 2033
Figure 67: Latin America Market Y-o-Y Growth (%) Projections by Service, 2023 to 2033
Figure 68: Latin America Market Value (US$ Million) Analysis by Enterprise Type, 2018 to 2033
Figure 69: Latin America Market Value Share (%) and BPS Analysis by Enterprise Type, 2023 to 2033
Figure 70: Latin America Market Y-o-Y Growth (%) Projections by Enterprise Type, 2023 to 2033
Figure 71: Latin America Market Attractiveness by Deployment, 2023 to 2033
Figure 72: Latin America Market Attractiveness by Application, 2023 to 2033
Figure 73: Latin America Market Attractiveness by Service, 2023 to 2033
Figure 74: Latin America Market Attractiveness by Enterprise Type, 2023 to 2033
Figure 75: Latin America Market Attractiveness by Country, 2023 to 2033
Figure 76: Western Europe Market Value (US$ Million) by Deployment, 2023 to 2033
Figure 77: Western Europe Market Value (US$ Million) by Application, 2023 to 2033
Figure 78: Western Europe Market Value (US$ Million) by Service, 2023 to 2033
Figure 79: Western Europe Market Value (US$ Million) by Enterprise Type, 2023 to 2033
Figure 80: Western Europe Market Value (US$ Million) by Country, 2023 to 2033
Figure 81: Western Europe Market Value (US$ Million) Analysis by Country, 2018 to 2033
Figure 82: Western Europe Market Value Share (%) and BPS Analysis by Country, 2023 to 2033
Figure 83: Western Europe Market Y-o-Y Growth (%) Projections by Country, 2023 to 2033
Figure 84: Western Europe Market Value (US$ Million) Analysis by Deployment, 2018 to 2033
Figure 85: Western Europe Market Value Share (%) and BPS Analysis by Deployment, 2023 to 2033
Figure 86: Western Europe Market Y-o-Y Growth (%) Projections by Deployment, 2023 to 2033
Figure 87: Western Europe Market Value (US$ Million) Analysis by Application, 2018 to 2033
Figure 88: Western Europe Market Value Share (%) and BPS Analysis by Application, 2023 to 2033
Figure 89: Western Europe Market Y-o-Y Growth (%) Projections by Application, 2023 to 2033
Figure 90: Western Europe Market Value (US$ Million) Analysis by Service, 2018 to 2033
Figure 91: Western Europe Market Value Share (%) and BPS Analysis by Service, 2023 to 2033
Figure 92: Western Europe Market Y-o-Y Growth (%) Projections by Service, 2023 to 2033
Figure 93: Western Europe Market Value (US$ Million) Analysis by Enterprise Type, 2018 to 2033
Figure 94: Western Europe Market Value Share (%) and BPS Analysis by Enterprise Type, 2023 to 2033
Figure 95: Western Europe Market Y-o-Y Growth (%) Projections by Enterprise Type, 2023 to 2033
Figure 96: Western Europe Market Attractiveness by Deployment, 2023 to 2033
Figure 97: Western Europe Market Attractiveness by Application, 2023 to 2033
Figure 98: Western Europe Market Attractiveness by Service, 2023 to 2033
Figure 99: Western Europe Market Attractiveness by Enterprise Type, 2023 to 2033
Figure 100: Western Europe Market Attractiveness by Country, 2023 to 2033
Figure 101: Eastern Europe Market Value (US$ Million) by Deployment, 2023 to 2033
Figure 102: Eastern Europe Market Value (US$ Million) by Application, 2023 to 2033
Figure 103: Eastern Europe Market Value (US$ Million) by Service, 2023 to 2033
Figure 104: Eastern Europe Market Value (US$ Million) by Enterprise Type, 2023 to 2033
Figure 105: Eastern Europe Market Value (US$ Million) by Country, 2023 to 2033
Figure 106: Eastern Europe Market Value (US$ Million) Analysis by Country, 2018 to 2033
Figure 107: Eastern Europe Market Value Share (%) and BPS Analysis by Country, 2023 to 2033
Figure 108: Eastern Europe Market Y-o-Y Growth (%) Projections by Country, 2023 to 2033
Figure 109: Eastern Europe Market Value (US$ Million) Analysis by Deployment, 2018 to 2033
Figure 110: Eastern Europe Market Value Share (%) and BPS Analysis by Deployment, 2023 to 2033
Figure 111: Eastern Europe Market Y-o-Y Growth (%) Projections by Deployment, 2023 to 2033
Figure 112: Eastern Europe Market Value (US$ Million) Analysis by Application, 2018 to 2033
Figure 113: Eastern Europe Market Value Share (%) and BPS Analysis by Application, 2023 to 2033
Figure 114: Eastern Europe Market Y-o-Y Growth (%) Projections by Application, 2023 to 2033
Figure 115: Eastern Europe Market Value (US$ Million) Analysis by Service, 2018 to 2033
Figure 116: Eastern Europe Market Value Share (%) and BPS Analysis by Service, 2023 to 2033
Figure 117: Eastern Europe Market Y-o-Y Growth (%) Projections by Service, 2023 to 2033
Figure 118: Eastern Europe Market Value (US$ Million) Analysis by Enterprise Type, 2018 to 2033
Figure 119: Eastern Europe Market Value Share (%) and BPS Analysis by Enterprise Type, 2023 to 2033
Figure 120: Eastern Europe Market Y-o-Y Growth (%) Projections by Enterprise Type, 2023 to 2033
Figure 121: Eastern Europe Market Attractiveness by Deployment, 2023 to 2033
Figure 122: Eastern Europe Market Attractiveness by Application, 2023 to 2033
Figure 123: Eastern Europe Market Attractiveness by Service, 2023 to 2033
Figure 124: Eastern Europe Market Attractiveness by Enterprise Type, 2023 to 2033
Figure 125: Eastern Europe Market Attractiveness by Country, 2023 to 2033
Figure 126: South Asia and Pacific Market Value (US$ Million) by Deployment, 2023 to 2033
Figure 127: South Asia and Pacific Market Value (US$ Million) by Application, 2023 to 2033
Figure 128: South Asia and Pacific Market Value (US$ Million) by Service, 2023 to 2033
Figure 129: South Asia and Pacific Market Value (US$ Million) by Enterprise Type, 2023 to 2033
Figure 130: South Asia and Pacific Market Value (US$ Million) by Country, 2023 to 2033
Figure 131: South Asia and Pacific Market Value (US$ Million) Analysis by Country, 2018 to 2033
Figure 132: South Asia and Pacific Market Value Share (%) and BPS Analysis by Country, 2023 to 2033
Figure 133: South Asia and Pacific Market Y-o-Y Growth (%) Projections by Country, 2023 to 2033
Figure 134: South Asia and Pacific Market Value (US$ Million) Analysis by Deployment, 2018 to 2033
Figure 135: South Asia and Pacific Market Value Share (%) and BPS Analysis by Deployment, 2023 to 2033
Figure 136: South Asia and Pacific Market Y-o-Y Growth (%) Projections by Deployment, 2023 to 2033
Figure 137: South Asia and Pacific Market Value (US$ Million) Analysis by Application, 2018 to 2033
Figure 138: South Asia and Pacific Market Value Share (%) and BPS Analysis by Application, 2023 to 2033
Figure 139: South Asia and Pacific Market Y-o-Y Growth (%) Projections by Application, 2023 to 2033
Figure 140: South Asia and Pacific Market Value (US$ Million) Analysis by Service, 2018 to 2033
Figure 141: South Asia and Pacific Market Value Share (%) and BPS Analysis by Service, 2023 to 2033
Figure 142: South Asia and Pacific Market Y-o-Y Growth (%) Projections by Service, 2023 to 2033
Figure 143: South Asia and Pacific Market Value (US$ Million) Analysis by Enterprise Type, 2018 to 2033
Figure 144: South Asia and Pacific Market Value Share (%) and BPS Analysis by Enterprise Type, 2023 to 2033
Figure 145: South Asia and Pacific Market Y-o-Y Growth (%) Projections by Enterprise Type, 2023 to 2033
Figure 146: South Asia and Pacific Market Attractiveness by Deployment, 2023 to 2033
Figure 147: South Asia and Pacific Market Attractiveness by Application, 2023 to 2033
Figure 148: South Asia and Pacific Market Attractiveness by Service, 2023 to 2033
Figure 149: South Asia and Pacific Market Attractiveness by Enterprise Type, 2023 to 2033
Figure 150: South Asia and Pacific Market Attractiveness by Country, 2023 to 2033
Figure 151: East Asia Market Value (US$ Million) by Deployment, 2023 to 2033
Figure 152: East Asia Market Value (US$ Million) by Application, 2023 to 2033
Figure 153: East Asia Market Value (US$ Million) by Service, 2023 to 2033
Figure 154: East Asia Market Value (US$ Million) by Enterprise Type, 2023 to 2033
Figure 155: East Asia Market Value (US$ Million) by Country, 2023 to 2033
Figure 156: East Asia Market Value (US$ Million) Analysis by Country, 2018 to 2033
Figure 157: East Asia Market Value Share (%) and BPS Analysis by Country, 2023 to 2033
Figure 158: East Asia Market Y-o-Y Growth (%) Projections by Country, 2023 to 2033
Figure 159: East Asia Market Value (US$ Million) Analysis by Deployment, 2018 to 2033
Figure 160: East Asia Market Value Share (%) and BPS Analysis by Deployment, 2023 to 2033
Figure 161: East Asia Market Y-o-Y Growth (%) Projections by Deployment, 2023 to 2033
Figure 162: East Asia Market Value (US$ Million) Analysis by Application, 2018 to 2033
Figure 163: East Asia Market Value Share (%) and BPS Analysis by Application, 2023 to 2033
Figure 164: East Asia Market Y-o-Y Growth (%) Projections by Application, 2023 to 2033
Figure 165: East Asia Market Value (US$ Million) Analysis by Service, 2018 to 2033
Figure 166: East Asia Market Value Share (%) and BPS Analysis by Service, 2023 to 2033
Figure 167: East Asia Market Y-o-Y Growth (%) Projections by Service, 2023 to 2033
Figure 168: East Asia Market Value (US$ Million) Analysis by Enterprise Type, 2018 to 2033
Figure 169: East Asia Market Value Share (%) and BPS Analysis by Enterprise Type, 2023 to 2033
Figure 170: East Asia Market Y-o-Y Growth (%) Projections by Enterprise Type, 2023 to 2033
Figure 171: East Asia Market Attractiveness by Deployment, 2023 to 2033
Figure 172: East Asia Market Attractiveness by Application, 2023 to 2033
Figure 173: East Asia Market Attractiveness by Service, 2023 to 2033
Figure 174: East Asia Market Attractiveness by Enterprise Type, 2023 to 2033
Figure 175: East Asia Market Attractiveness by Country, 2023 to 2033
Figure 176: Middle East and Africa Market Value (US$ Million) by Deployment, 2023 to 2033
Figure 177: Middle East and Africa Market Value (US$ Million) by Application, 2023 to 2033
Figure 178: Middle East and Africa Market Value (US$ Million) by Service, 2023 to 2033
Figure 179: Middle East and Africa Market Value (US$ Million) by Enterprise Type, 2023 to 2033
Figure 180: Middle East and Africa Market Value (US$ Million) by Country, 2023 to 2033
Figure 181: Middle East and Africa Market Value (US$ Million) Analysis by Country, 2018 to 2033
Figure 182: Middle East and Africa Market Value Share (%) and BPS Analysis by Country, 2023 to 2033
Figure 183: Middle East and Africa Market Y-o-Y Growth (%) Projections by Country, 2023 to 2033
Figure 184: Middle East and Africa Market Value (US$ Million) Analysis by Deployment, 2018 to 2033
Figure 185: Middle East and Africa Market Value Share (%) and BPS Analysis by Deployment, 2023 to 2033
Figure 186: Middle East and Africa Market Y-o-Y Growth (%) Projections by Deployment, 2023 to 2033
Figure 187: Middle East and Africa Market Value (US$ Million) Analysis by Application, 2018 to 2033
Figure 188: Middle East and Africa Market Value Share (%) and BPS Analysis by Application, 2023 to 2033
Figure 189: Middle East and Africa Market Y-o-Y Growth (%) Projections by Application, 2023 to 2033
Figure 190: Middle East and Africa Market Value (US$ Million) Analysis by Service, 2018 to 2033
Figure 191: Middle East and Africa Market Value Share (%) and BPS Analysis by Service, 2023 to 2033
Figure 192: Middle East and Africa Market Y-o-Y Growth (%) Projections by Service, 2023 to 2033
Figure 193: Middle East and Africa Market Value (US$ Million) Analysis by Enterprise Type, 2018 to 2033
Figure 194: Middle East and Africa Market Value Share (%) and BPS Analysis by Enterprise Type, 2023 to 2033
Figure 195: Middle East and Africa Market Y-o-Y Growth (%) Projections by Enterprise Type, 2023 to 2033
Figure 196: Middle East and Africa Market Attractiveness by Deployment, 2023 to 2033
Figure 197: Middle East and Africa Market Attractiveness by Application, 2023 to 2033
Figure 198: Middle East and Africa Market Attractiveness by Service, 2023 to 2033
Figure 199: Middle East and Africa Market Attractiveness by Enterprise Type, 2023 to 2033
Figure 200: Middle East and Africa Market Attractiveness by Country, 2023 to 2033
The growing aging population and the increasing prevalence of chronic diseases are driving the growth of the healthcare contact center solution market in Asia Pacific.
The increasing focus on patient care and the rising demand for customer service are driving the growth of the healthcare contact center solution market in Europe.
The booming IT sector and the increasing demand for remote patient care are driving the adoption of healthcare contact center services globally.
The United States held 35% of the global market share in 2022.
Asia Pacific is projected to witness the highest CAGR of 10% through 2033.
Explore Similar Insights
Thank you!
You will receive an email from our Business Development Manager. Please be sure to check your SPAM/JUNK folder too.