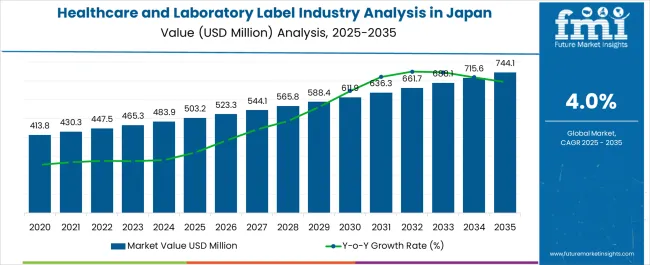
The Healthcare and Laboratory Label Industry Analysis in Japan is estimated to be valued at USD 503.2 million in 2025 and is projected to reach USD 744.1 million by 2035, registering a compound annual growth rate (CAGR) of 4.0% over the forecast period.

| Metric | Value |
|---|---|
| Healthcare and Laboratory Label Industry Analysis in Japan Estimated Value in (2025 E) | USD 503.2 million |
| Healthcare and Laboratory Label Industry Analysis in Japan Forecast Value in (2035 F) | USD 744.1 million |
| Forecast CAGR (2025 to 2035) | 4.0% |
The healthcare and laboratory label industry in Japan is witnessing steady growth. Rising demand for accurate labeling in pharmaceuticals, biotechnology, and clinical laboratories is driving market expansion. Current market dynamics are characterized by stringent regulatory requirements, high standards for traceability, and increasing adoption of automated labeling systems.
Technological advancements in label materials, printing techniques, and adhesion properties are enhancing reliability and durability. The future outlook is shaped by growing investments in healthcare infrastructure, rising pharmaceutical manufacturing activities, and the need for compliance with international labeling standards. Demand is also being influenced by the expansion of laboratory testing and diagnostic services across public and private sectors.
Growth rationale is anchored on the critical role of labels in ensuring product safety, regulatory compliance, and operational efficiency Continuous innovation in materials and labeling technology, combined with the capacity to meet high-volume production requirements, is expected to sustain market growth and strengthen adoption across healthcare and laboratory applications.

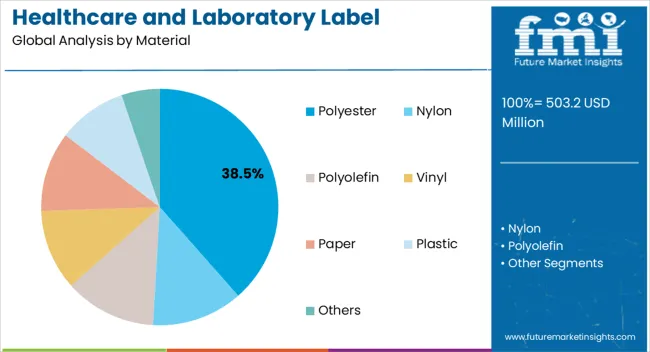
The polyester segment, holding 38.50% of the material category, has been leading due to its durability, chemical resistance, and suitability for high-performance labeling applications. Its adoption has been reinforced by consistent quality and compatibility with automated printing and labeling systems.
The segment has benefited from high thermal stability and adhesive versatility, enabling reliable use in various healthcare and laboratory environments. Demand has been supported by regulatory compliance requirements, where polyester labels ensure legibility and traceability over product lifecycle.
Technological improvements in film thickness, coating, and printing finish have enhanced performance, while manufacturers’ focus on sustainable production and cost optimization has strengthened market position The segment’s continued growth is expected to be driven by expanding healthcare infrastructure and increasing volumes of pharmaceutical and laboratory products requiring high-quality labeling solutions.

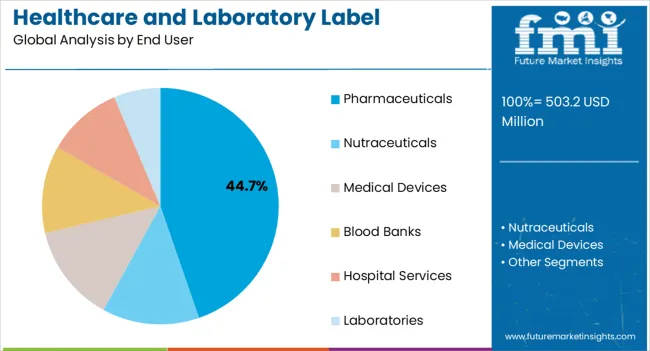
The pharmaceuticals end-user segment, accounting for 44.70% of the end-user category, has maintained its leadership due to the critical need for precise labeling in drug manufacturing and distribution. Adoption has been supported by strict regulatory frameworks that mandate accurate identification, dosage instructions, and traceability.
The segment’s market share has been reinforced by high production volumes in the pharmaceutical industry and integration of automated labeling systems in manufacturing lines. Demand has been stabilized by continuous pharmaceutical product launches and the expansion of hospital and retail pharmacy networks.
Innovations in label readability, anti-counterfeiting features, and durability have strengthened adoption Ongoing emphasis on compliance, safety, and operational efficiency is expected to sustain the segment’s share and support continued growth in Japan’s healthcare and laboratory labeling industry.
The Kanto region is a significant hub for the healthcare and laboratory label industry in Japan. The region likely contributes substantially to the industrial advancements with its central location and hosting major metropolitan areas, including Tokyo. Presence in Kanto could offer strategic advantages, including access to a robust healthcare infrastructure and research facilities.
Chubu, another pivotal region, likely plays a key role in the Healthcare and Laboratory Label sector. It may contribute to industrial growth and innovation as a central industrial and economic hub. Proximity to Chubu manufacturing centers and research institutions may influence the production and development of labels tailored for healthcare and laboratory applications in the region.
In 2025, the healthcare and laboratory label industry sees predominant utilization in Plastic, commanding a substantial share of 60.9%. The Pharmaceutical sector holds a significant industrial presence, contributing a 29.4% share.
These trends emphasize the industrial reliance on plastic-based Label and the crucial role of specialized labeling solutions in pharmaceutical applications.
| Category | Industrial Share in 2025 |
|---|---|
| Plastic | 60.9% |
| Pharmaceutical | 29.4% |
In 2025, the healthcare and laboratory label industry showcased a commanding presence in the plastic sector, claiming a substantial industrial share of 60.9%. This indicates a significant reliance on plastic-based labels within the industry, potentially driven by durability, versatility, and compliance with stringent healthcare regulations.
The pharmaceutical sector plays a pivotal role in the healthcare and laboratory label industry, contributing significantly with a share of 29.4%. This highlights the crucial need for specialized labels in pharmaceutical applications, addressing specific requirements related to drug information, dosage instructions, and regulatory compliance.
| Attribute | Details |
|---|---|
| Estimated Industry Size in 2025 | USD 503.2 million |
| Projected Industry Size in 2035 | USD 744.1 million |
| Anticipated CAGR between 2025 to 2035 | 4.0% CAGR |
| Demand Forecast for the Healthcare and Laboratory Label Industry in Japan | 2025 to 2035 |
| Report Coverage | Industry Size, Industry Trends, Analysis of key factors influencing the Healthcare and Laboratory Label Industry in Japan, Insights on Global Players and their Industry Strategy in Japan, Ecosystem Analysis of Local and Regional Japan Providers |
| Key Provinces Analyzed | Kanto; Chubu; Kinki; Kyushu and Okinawa; Tohoku; Rest of Japan |
| Key Companies Profiled | Sato Holdings Corporation; GA International Inc.; General Data Co. Inc.; Caresfield LLC; Diversified Biotech Inc.; Shamrock Label; Loftware Inc.; Medline Industries, Inc.; Avery Dennison Corporation; CCL Industries Inc.; 3M Company |
The global healthcare and laboratory label industry analysis in Japan is estimated to be valued at USD 503.2 million in 2025.
The market size for the healthcare and laboratory label industry analysis in Japan is projected to reach USD 745.8 million by 2035.
The healthcare and laboratory label industry analysis in Japan is expected to grow at a 4.0% CAGR between 2025 and 2035.
The key product types in healthcare and laboratory label industry analysis in Japan are polyester, nylon, polyolefin, vinyl, paper, plastic and others.
In terms of end user, pharmaceuticals segment to command 44.7% share in the healthcare and laboratory label industry analysis in Japan in 2025.


Full Research Suite comprises of:
Market outlook & trends analysis
Interviews & case studies
Strategic recommendations
Vendor profiles & capabilities analysis
5-year forecasts
8 regions and 60+ country-level data splits
Market segment data splits
12 months of continuous data updates
DELIVERED AS:
PDF EXCEL ONLINE
Healthcare AI Computer Vision Market Size and Share Forecast Outlook 2025 to 2035
Healthcare Master Data Management Market Size and Share Forecast Outlook 2025 to 2035
Healthcare Contact Center Solution Market Size and Share Forecast Outlook 2025 to 2035
Healthcare Semiconductor Market Size and Share Forecast Outlook 2025 to 2035
Healthcare Mobile Computers Market Size and Share Forecast Outlook 2025 to 2035
Healthcare Companion Robots Market Size and Share Forecast Outlook 2025 to 2035
Healthcare Analytics Market Size and Share Forecast Outlook 2025 to 2035
Healthcare Contract Research Organization Market Analysis – Size, Share, and Forecast Outlook 2025 to 2035
Healthcare Chatbot Market - Growth Trends & Forecast 2025 to 2035
Healthcare Virtual Assistants Market Analysis by Product, End User and Region Through 2035
Healthcare Digital Experience Platform Market Trends - Growth & Forecast 2025 to 2035
Healthcare API Market Growth – Trends & Forecast 2025 to 2035
Healthcare Biometrics Market Trends - Growth, Demand & Forecast 2025 to 2035
Global Healthcare Fabrics Market Insights – Trends & Forecast 2024-2034
Healthcare Technology Management Market Insights – Growth & Forecast 2024-2034
Healthcare IoT Market
Healthcare BPO Market
Healthcare Revenue Cycle Management Software Market – Forecast 2017-2022
Healthcare Interoperability Solutions Market Analysis – Trends & Growth 2025 to 2035
Healthcare Business Intelligence Market Size and Share Forecast Outlook 2025 to 2035

Thank you!
You will receive an email from our Business Development Manager. Please be sure to check your SPAM/JUNK folder too.
Chat With
MaRIA