Reports

- Global Locations -

Headquarters

Future Market Insights, Inc.

Christiana Corporate, 200
Continental Drive, Suite 401,
Newark, Delaware - 19713,
United States

T: +1-845-579-5705

Americas

Future Market Insights, Inc.

616 Corporate Way, Suite 2-9018,
Valley Cottage, NY 10989, United States

T: +1-347-918-3531

MEA

Future Market Insights

1602-6 Jumeirah Bay X2 Tower, Plot No: JLT-PH2-X2A,
Jumeirah Lakes Towers, Dubai,
United Arab Emirates

Europe

Future Market Insights

3rd Floor, 207 Regent Street,
W1B 3HH London
United Kingdom

T: + 44 (0) 20 8123 9659
D: +44 (0) 20 3287 4268

Asia Pacific

Future Market Insights

IndiaLand Global Tech Park, Unit UG-1, Behind Grand HighStreet, Phase 1, Hinjawadi, MH, Pune – 411057, India

Healthcare Analytics Market Overview (2022 to 2032)

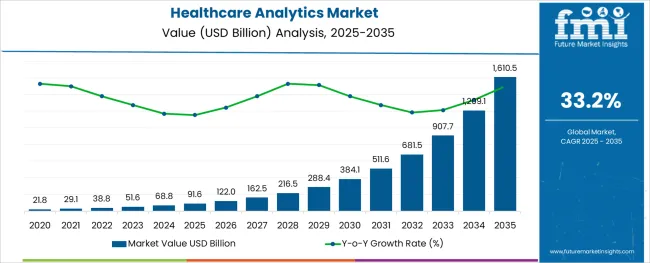
[250 Pages Report] Newly-released Healthcare Analytics Market analysis report by Future Market Insights shows that global sales of the Healthcare Analytics Market in 2021 were held at US$ 29.1 Billion. With 29.2%, the projected market growth from 2022 to 2032 is expected to be significantly higher than the historical growth. Software is expected to be the highest revenue-generating segment, projected to grow at a CAGR of over 33% from 2022 to 2032.

Don't pay for what you don't need

Customize your report by selecting specific countries or regions and save 30%!

Key Points Covered in Healthcare Analytics Market Survey

  • Market Estimates and Forecasts (2017 to 2032)
  • Key Drivers and Restraints Shaping Market Growth
  • Segment-wise, Country-wise, and Region-wise Analysis
  • Competition Mapping and Benchmarking
  • Market Share Analysis
  • COVID-19 Impact on Healthcare Analytics Market and How to Navigate
  • Recommendation on Key Winning Strategies

Revenue of Healthcare Analytics Market from 2017 to 2021 Compared to Demand Outlook for 2022 to 2032

As per the Healthcare Analytics Market research by Future Market Insights - a market research and competitive intelligence provider, historically, from 2017 to 2021, the market value of the Healthcare Analytics Market increased at around 24.2% CAGR.

Rapid revenue growth in today's industry is predicted by the implementation of user-based analytics, with the ability to predict market trends using analysis of prescriptive and predictive solutions.

The healthcare industry is rapidly being affected by social media websites and the internet in an effort to encourage patient participation in their healthcare to gather data. The market for analytics data concerning patient welfare is slowly being stimulated by the growing demand for consumer analysis.

Advanced analytical tools tailored to the unique needs of healthcare facilities and businesses offering financial, clinical, operational, and administrative services are bringing growth to the healthcare field. An overriding factor in the growth of the market for healthcare analytics is the use of data mining techniques and big data analytics to study high-risk patients and deliver the most appropriate care. Predictive analytics applications are also being used to solve an array of challenges including risk assessment.

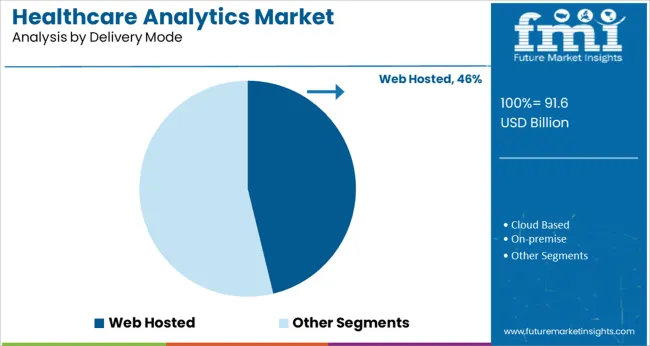
Web-based solutions are gaining in popularity in the fields of revenue cycle management (RCM) and medical management. There is a growing need for highly individualized medicine, and data analytics programs help to achieve this goal. For instance, by using patient-specific health information, such as electronic medical records (EMRs), mHealth, and eHealth records. Furthermore, health data mining has started to use artificial intelligence solutions wrapped in data analytics to enable tailored treatment plans, which is projected to create demand for analytical solutions in healthcare.

  • Healthcare Analytics Market was valued at US$ 29.1 Billion in 2021. According to Future Market Insights, Healthcare Analytics Market revenue would increase 12.8X between 2022 and 2032, reaching roughly US$ 470.8 Billion in 2032.
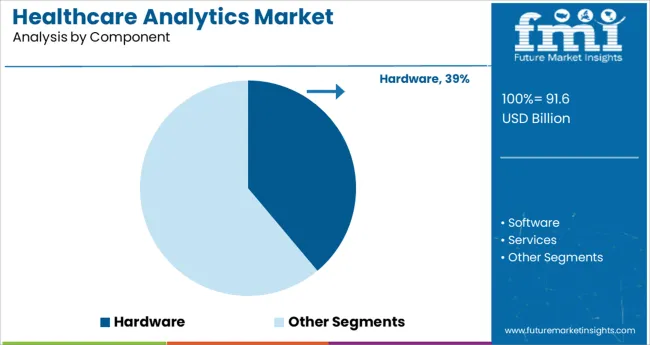
  • In terms of Components, the Software accounts for the highest projected CAGR of over 33%.
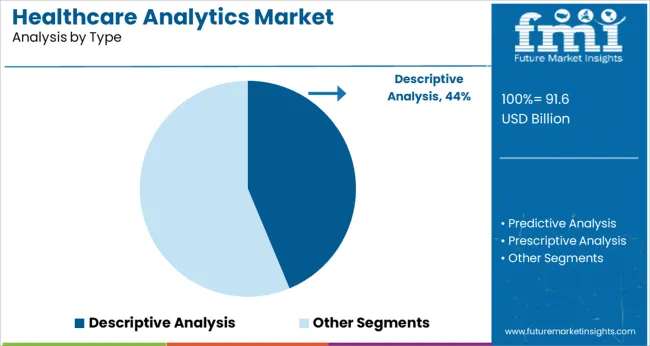
  • In terms of Types of healthcare analytics, Descriptive Analysis accounts for the highest CAGR of 28.1% during the historic period (2017 to 21).
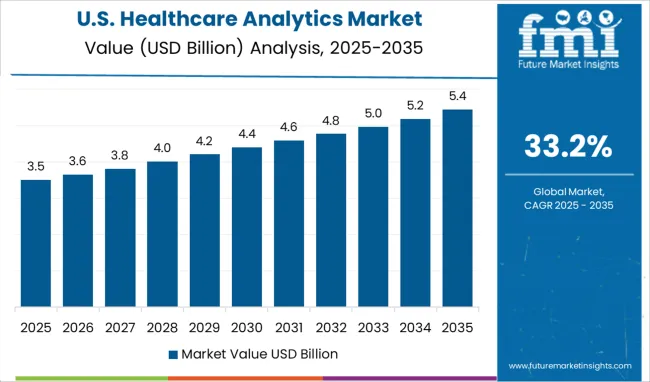
  • The USA is the dominant region in the Healthcare Analytics Market with an absolute dollar growth opportunity of over US$ 197 Billion.
Sudip Saha
Sudip Saha

Principal Consultant

Talk to Analyst

Find your sweet spots for generating winning opportunities in this market.

What Factors are Propelling Healthcare Analytics Demand?

The growing use of analytics in the healthcare industry and government initiatives to boost the use of electronic health records (EHRs) in healthcare clinics have fostered the growth of the healthcare analytics market. Furthermore, the rising competition among healthcare organizations to reduce unnecessary expenses is boosting the market growth.

Factors such as complicated implementation procedures and lack of highly skilled labor are believed to curb healthcare analytics’ market expansion. On the other hand, the use of cloud-based analytics across many healthcare providers and the increase in the adoption of augmented analytics within the medical sector are anticipated to open up lucrative opportunities for the expansion of the market.

How the Emergence of Big Data in Healthcare Pulled the Growth Trigger in Healthcare Analytics Market?

Healthcare analytics, typically known as clinical data analytics, is a type of analytics that aids in healthcare delivery, based on the real-time application of data to determine an individual's future treatment course. It can provide analysis on a matter of macro- and micro-level types.

The introduction of big data in the healthcare industry has played a major role in the development of healthcare analytics, which is propelling the market forward. In addition, the growth of the overall industry is assisted by a rise in health issues, an increase in disposable income, and a large increase in the senior citizen populace.

However, the expanding market will likely be hindered by the high prices and complexities of software development, as well as data integrity and privacy issues. In addition, technological developments and favorable government plans should create promising economic opportunities.
Get the data you need at a Fraction of the cost

Personalize your report by choosing insights you need
and save 40%!

Which Region is projected to Offer the Largest Opportunity for Healthcare Analytics Market?

In 2021, North America held the largest share of the global healthcare analytics market. Government support for the healthcare sector's development, a high level of awareness about rare disorders, easy access to high-quality medical facilities, and attractive reimbursement policies are some of the important drivers for regional market growth.

Due to the growing healthcare expenditure of Japan and China and factors such as the introduction of generic Temozolomide, and the growing geriatric population, Asia Pacific is projected to grow at the fastest rate throughout the projection period.
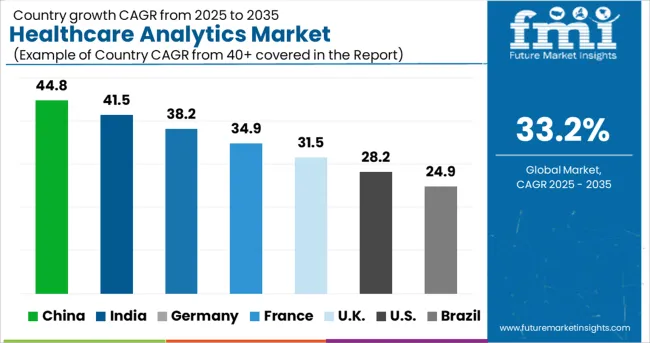
Country-wise Analysis

Which Country Lies at the CenterStage for Healthcare Analytics Market Revenue?

The USA is expected to have the highest market share of US$ 213 Billion by the end of 2032. The plaintiffs of healthcare companies have benefited from the accessibility of innovative healthcare products and the increase in interest of healthcare fraternities in analytics due to favorable rules and improved rates of the latest illnesses.

Category-wise Insights

Why Descriptive Analysis is projected to Witness the Fastest Growth among Healthcare Analytics Types?

The descriptive Analysis segment is forecasted to grow at the highest CAGR of over 30% from 2022 to 2032. This growth is due to the escalating demand for enhanced analyses based on historical patterns and datasets to generate data-enriched insight that will help organizations better understand the current situation.

Market participants forecast future market outcomes using data mining technologies on descriptive data silos. Trifecta and Accenture, for example, collaborated in December 2020 to supply high-quality data mining solutions for enhanced drug development operations. Companies employ descriptive analytics to turn raw data and patterns into interpretable data-driven insights that help them better understand past business performance, consumer behavior, and market impacts. Given the cheaper cost of obtaining descriptive datasets compared to predictive and prescriptive analyzed datasets, descriptive analysis is projected to rise dramatically in the future years.

Which Component of Healthcare Analytics is expected to Score Highest Growth in the Coming Years?

Healthcare Analytics Software commanded the largest revenue as well as CAGR of nearly 37%, during the forecast period. Because they lack the skills and resources to deploy analytics, healthcare, and life science organizations outsource these services to other premier analytical solutions companies. Furthermore, the services sector is predicted to increase at the quickest rate in the next years. Multi-package services are being introduced by outsourcing businesses to life science companies, and this is projected to contribute to the segment's growth throughout the projection period. The healthcare business is experiencing a surge in demand for analytical solutions as a result of the increased workload.

For handling patient records, healthcare infrastructure is evolving and incorporating analytical and AI-based technologies. Due to the outsourcing of services for short-term and long-term contracts, the services category is predicted to develop at the quickest rate over the forecasted period. Social media analytics, manufacturing process, preventative maintenance, benchmarking, promotional spending, and predictive analysis for medical device failure are all included in these packages.
What is the impact of Covid-19 on Healthcare Analytics Market?

Owing to the increased acceptance of healthcare analytics solutions among healthcare organizations for managing huge amounts of COVID-19 data, the healthcare analytics market swelled during COVID-19. Furthermore, the key challenge during COVID-19 was predicting the need for hospital personnel; hence, analytics solutions assist enterprises in managing staff requirements and tracking staff health.

Several developing countries globally have been implementing healthcare analytics solutions to pace up the fight against the pandemic, which is propelling the industry forward. Companies and facilities may now actively engage with consumers, provide labour management solutions, and manage complex supply chains owing to the growing need for digital health technology and advanced analytical solutions. Healthcare organizations are taking technological advances, including data mining, clinical decision support systems, and clinical trial management systems.

Competitive Analysis

Players in the market are constantly developing improved analytical solutions as well as extending their product offerings. To help healthcare organizations implement data analysis solutions, combat the Covid-19 pandemic, and preserve competitive advantage in the market, the companies are focused on their alliances, technology collaborations, and product launch strategies.

Some of the recent developments of key Healthcare Analytics providers are as follows:

  • In April 2021, Cerner announced the acquisition of Kantar Health. With this acquisition, Cerner plans to bind data to improve the safety and efficacy of clinical research in life sciences, pharmaceuticals, and healthcare. This acquisition is also expected to add to its service offering.
  • In January 2021, Optum and Change Healthcare a healthcare technology provider announced their collaboration. Under this partnership, Change Healthcare would join Optum Insight in delivering software and data analytics, technology-based services, research, and revenue cycle management offerings to strengthen Optum’s healthcare analytics portfolio.
  • In July 2020, the Department of Health and Human Services (HHS), the Department of Veterans Affairs, and the Department of Energy (DOE) announced a new big data analytics initiative to coordinate and share COVID-19 information.

Similarly, recent developments related to companies' Healthcare Analytics services have been tracked by the team at Future Market Insights, which are available in the full report.

Healthcare Analytics Market Report Scope

Attribute Details
Forecast Period 2022 to 2032
Historical Data Available for 2017 to 2021
Market Analysis US$ Billion for Value
Key Regions Covered North America, Latin America, Europe, Asia Pacific, Middle East & Africa
Key Countries Covered United States of America, Canada, Brazil, Mexico, Germany, the UK, France, Spain, Italy, Russia, China, Japan, South Korea, India, Australia, South Africa, Saudi Arabia, UAE, and Israel.
Key Market Segments Covered Component, Type, Delivery Mode, Application, Region
Key Companies Profiled
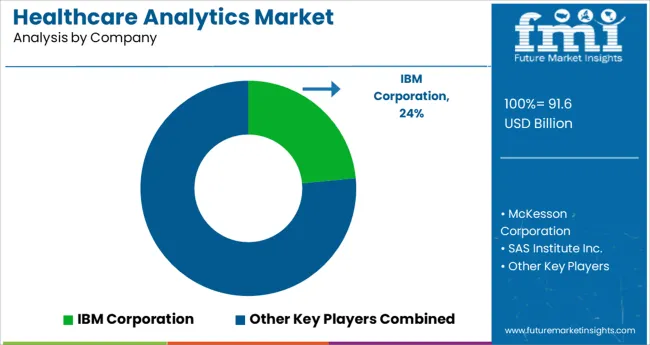
  • IBM Corporation
  • McKesson Corporation
  • SAS Institute Inc.
  • Optum Inc.
  • Oracle
  • IQVIA
  • Cerner Corporation
  • Truven Health Analytics, Inc.
Pricing Available upon Request

Market Segments Covered in Healthcare Analytics Market Analysis

By Component:

  • Software
  • Services
  • Hardware

By Delivery Mode:

  • Web Hosted
  • Cloud-Based
  • On-Premise

By Type:

  • Descriptive Analysis
  • Predictive Analysis
  • Prescriptive Analysis

By Application:

  • Clinical
  • Financial
  • Operational & Administrative

By Region:

  • North America
  • Latin America
  • Europe
  • Asia-Pacific (APAC)
  • Middle East and Africa (MEA)

Frequently Asked Questions

How much is the current worth of the Healthcare Analytics Market?

The global Healthcare Analytics Market is worth more than US$ 29.1 Billion at present.

What is the sales forecast for Healthcare Analytics Market?

Value of Healthcare Analytics Market are projected to increase at a CAGR of around 29.2% from 2022 to 2032.

What was the last 5 year’s market CAGR?

Value of Healthcare Analytics Market increased at a CAGR of around 24.2% from 2017 to 2021.

What is a key trend shaping the growth of the market for Healthcare Analytics Market?

Advanced analytical solutions designed for specific requirements of healthcare companies and facilities delivering financial, clinical, operational, and administrative services are bolstering the growth.

At what percentage is sales of Healthcare Analytics Market going to register growth in China?

The market for Healthcare Analytics Market in China is projected to expand at a CAGR of around 30.7% from 2022 to 2032.

What do statistics for South Korea and Japan reveal?

While the market in South Korea is expected to grow at nearly 27.5%, the market in Japan is projected to register a CAGR of nearly 37.1% from 2022 to 2032.

Table of Content

1. Executive Summary | Healthcare Analytics Market

    1.1. Global Market Outlook

    1.2. Demand-side Trends

    1.3. Supply-side Trends

    1.4. Technology Roadmap Analysis

    1.5. Analysis and Recommendations

2. Market Overview

    2.1. Market Coverage / Taxonomy

    2.2. Market Definition / Scope / Limitations

3. Market Background

    3.1. Market Dynamics

        3.1.1. Drivers

        3.1.2. Restraints

        3.1.3. Opportunity

        3.1.4. Trends

    3.2. Scenario Forecast

        3.2.1. Demand in Optimistic Scenario

        3.2.2. Demand in Likely Scenario

        3.2.3. Demand in Conservative Scenario

    3.3. Opportunity Map Analysis

    3.4. Investment Feasibility Matrix

    3.5. PESTLE and Porter’s Analysis

    3.6. Regulatory Landscape

        3.6.1. By Key Regions

        3.6.2. By Key Countries

4. Global Market Analysis 2017 to 2021 and Forecast, 2022 to 2032

    4.1. Historical Market Size Value (US$ Million) Analysis, 2017 to 2021

    4.2. Current and Future Market Size Value (US$ Million) Projections, 2022 to 2032

        4.2.1. Y-o-Y Growth Trend Analysis

        4.2.2. Absolute $ Opportunity Analysis

5. Global Market Analysis 2017 to 2021 and Forecast 2022 to 2032, By Component

    5.1. Introduction / Key Findings

    5.2. Historical Market Size Value (US$ Million) Analysis By Component, 2017 to 2021

    5.3. Current and Future Market Size Value (US$ Million) Analysis and Forecast By Component, 2022 to 2032

        5.3.1. Hardware

        5.3.2. Software

        5.3.3. Services

    5.4. Y-o-Y Growth Trend Analysis By Component, 2017 to 2021

    5.5. Absolute $ Opportunity Analysis By Component, 2022 to 2032

6. Global Market Analysis 2017 to 2021 and Forecast 2022 to 2032, By Type

    6.1. Introduction / Key Findings

    6.2. Historical Market Size Value (US$ Million) Analysis By Type, 2017 to 2021

    6.3. Current and Future Market Size Value (US$ Million) Analysis and Forecast By Type, 2022 to 2032

        6.3.1. Descriptive Analysis

        6.3.2. Predictive Analysis

        6.3.3. Prescriptive Analysis

    6.4. Y-o-Y Growth Trend Analysis By Type, 2017 to 2021

    6.5. Absolute $ Opportunity Analysis By Type, 2022 to 2032

7. Global Market Analysis 2017 to 2021 and Forecast 2022 to 2032, By Delivery Mode

    7.1. Introduction / Key Findings

    7.2. Historical Market Size Value (US$ Million) Analysis By Delivery Mode, 2017 to 2021

    7.3. Current and Future Market Size Value (US$ Million) Analysis and Forecast By Delivery Mode, 2022 to 2032

        7.3.1. Web Hosted

        7.3.2. Cloud Based

        7.3.3. On-premise

    7.4. Y-o-Y Growth Trend Analysis By Delivery Mode, 2017 to 2021

    7.5. Absolute $ Opportunity Analysis By Delivery Mode, 2022 to 2032

8. Global Market Analysis 2017 to 2021 and Forecast 2022 to 2032, By Application

    8.1. Introduction / Key Findings

    8.2. Historical Market Size Value (US$ Million) Analysis By Application, 2017 to 2021

    8.3. Current and Future Market Size Value (US$ Million) Analysis and Forecast By Application, 2022 to 2032

        8.3.1. Clinical

        8.3.2. Financial

        8.3.3. Operational & Administrative

    8.4. Y-o-Y Growth Trend Analysis By Application, 2017 to 2021

    8.5. Absolute $ Opportunity Analysis By Application, 2022 to 2032

9. Global Market Analysis 2017 to 2021 and Forecast 2022 to 2032, By Region

    9.1. Introduction

    9.2. Historical Market Size Value (US$ Million) Analysis By Region, 2017 to 2021

    9.3. Current Market Size Value (US$ Million) Analysis and Forecast By Region, 2022 to 2032

        9.3.1. North America

        9.3.2. Latin America

        9.3.3. Europe

        9.3.4. Asia Pacific

        9.3.5. Middle East and Africa (MEA)

    9.4. Market Attractiveness Analysis By Region

10. North America Market Analysis 2017 to 2021 and Forecast 2022 to 2032, By Country

    10.1. Historical Market Size Value (US$ Million) Trend Analysis By Market Taxonomy, 2017 to 2021

    10.2. Market Size Value (US$ Million) Forecast By Market Taxonomy, 2022 to 2032

        10.2.1. By Country

            10.2.1.1. United States of America

            10.2.1.2. Canada

        10.2.2. By Component

        10.2.3. By Type

        10.2.4. By Delivery Mode

        10.2.5. By Application

    10.3. Market Attractiveness Analysis

        10.3.1. By Country

        10.3.2. By Component

        10.3.3. By Type

        10.3.4. By Delivery Mode

        10.3.5. By Application

    10.4. Key Takeaways

11. Latin America Market Analysis 2017 to 2021 and Forecast 2022 to 2032, By Country

    11.1. Historical Market Size Value (US$ Million) Trend Analysis By Market Taxonomy, 2017 to 2021

    11.2. Market Size Value (US$ Million) Forecast By Market Taxonomy, 2022 to 2032

        11.2.1. By Country

            11.2.1.1. Brazil

            11.2.1.2. Mexico

            11.2.1.3. Rest of Latin America

        11.2.2. By Component

        11.2.3. By Type

        11.2.4. By Delivery Mode

        11.2.5. By Application

    11.3. Market Attractiveness Analysis

        11.3.1. By Country

        11.3.2. By Component

        11.3.3. By Type

        11.3.4. By Delivery Mode

        11.3.5. By Application

    11.4. Key Takeaways

12. Europe Market Analysis 2017 to 2021 and Forecast 2022 to 2032, By Country

    12.1. Historical Market Size Value (US$ Million) Trend Analysis By Market Taxonomy, 2017 to 2021

    12.2. Market Size Value (US$ Million) Forecast By Market Taxonomy, 2022 to 2032

        12.2.1. By Country

            12.2.1.1. Germany

            12.2.1.2. Italy

            12.2.1.3. France

            12.2.1.4. United Kingdom

            12.2.1.5. Spain

            12.2.1.6. Russia

            12.2.1.7. BENELUX

            12.2.1.8. Rest of Europe

        12.2.2. By Component

        12.2.3. By Type

        12.2.4. By Delivery Mode

        12.2.5. By Application

    12.3. Market Attractiveness Analysis

        12.3.1. By Country

        12.3.2. By Component

        12.3.3. By Type

        12.3.4. By Delivery Mode

        12.3.5. By Application

    12.4. Key Takeaways

13. Asia Pacific Market Analysis 2017 to 2021 and Forecast 2022 to 2032, By Country

    13.1. Historical Market Size Value (US$ Million) Trend Analysis By Market Taxonomy, 2017 to 2021

    13.2. Market Size Value (US$ Million) Forecast By Market Taxonomy, 2022 to 2032

        13.2.1. By Country

            13.2.1.1. China

            13.2.1.2. Japan

            13.2.1.3. South Korea

            13.2.1.4. India

            13.2.1.5. Thailand

            13.2.1.6. Malaysia

            13.2.1.7. Indonesia

            13.2.1.8. Rest of Asia Pacific

        13.2.2. By Component

        13.2.3. By Type

        13.2.4. By Delivery Mode

        13.2.5. By Application

    13.3. Market Attractiveness Analysis

        13.3.1. By Country

        13.3.2. By Component

        13.3.3. By Type

        13.3.4. By Delivery Mode

        13.3.5. By Application

    13.4. Key Takeaways

14. MEA Market Analysis 2017 to 2021 and Forecast 2022 to 2032, By Country

    14.1. Historical Market Size Value (US$ Million) Trend Analysis By Market Taxonomy, 2017 to 2021

    14.2. Market Size Value (US$ Million) Forecast By Market Taxonomy, 2022 to 2032

        14.2.1. By Country

            14.2.1.1. GCC Countries

            14.2.1.2. Rest of MEA

        14.2.2. By Component

        14.2.3. By Type

        14.2.4. By Delivery Mode

        14.2.5. By Application

    14.3. Market Attractiveness Analysis

        14.3.1. By Country

        14.3.2. By Component

        14.3.3. By Type

        14.3.4. By Delivery Mode

        14.3.5. By Application

    14.4. Key Takeaways

15. Key Countries Market Analysis

    15.1. United States of America

        15.1.1. Pricing Analysis

        15.1.2. Market Share Analysis, 2021

            15.1.2.1. By Component

            15.1.2.2. By Type

            15.1.2.3. By Delivery Mode

            15.1.2.4. By Application

    15.2. Canada

        15.2.1. Pricing Analysis

        15.2.2. Market Share Analysis, 2021

            15.2.2.1. By Component

            15.2.2.2. By Type

            15.2.2.3. By Delivery Mode

            15.2.2.4. By Application

    15.3. Brazil

        15.3.1. Pricing Analysis

        15.3.2. Market Share Analysis, 2021

            15.3.2.1. By Component

            15.3.2.2. By Type

            15.3.2.3. By Delivery Mode

            15.3.2.4. By Application

    15.4. Mexico

        15.4.1. Pricing Analysis

        15.4.2. Market Share Analysis, 2021

            15.4.2.1. By Component

            15.4.2.2. By Type

            15.4.2.3. By Delivery Mode

            15.4.2.4. By Application

    15.5. Germany

        15.5.1. Pricing Analysis

        15.5.2. Market Share Analysis, 2021

            15.5.2.1. By Component

            15.5.2.2. By Type

            15.5.2.3. By Delivery Mode

            15.5.2.4. By Application

    15.6. Italy

        15.6.1. Pricing Analysis

        15.6.2. Market Share Analysis, 2021

            15.6.2.1. By Component

            15.6.2.2. By Type

            15.6.2.3. By Delivery Mode

            15.6.2.4. By Application

    15.7. France

        15.7.1. Pricing Analysis

        15.7.2. Market Share Analysis, 2021

            15.7.2.1. By Component

            15.7.2.2. By Type

            15.7.2.3. By Delivery Mode

            15.7.2.4. By Application

    15.8. United Kingdom

        15.8.1. Pricing Analysis

        15.8.2. Market Share Analysis, 2021

            15.8.2.1. By Component

            15.8.2.2. By Type

            15.8.2.3. By Delivery Mode

            15.8.2.4. By Application

    15.9. Spain

        15.9.1. Pricing Analysis

        15.9.2. Market Share Analysis, 2021

            15.9.2.1. By Component

            15.9.2.2. By Type

            15.9.2.3. By Delivery Mode

            15.9.2.4. By Application

    15.10. Russia

        15.10.1. Pricing Analysis

        15.10.2. Market Share Analysis, 2021

            15.10.2.1. By Component

            15.10.2.2. By Type

            15.10.2.3. By Delivery Mode

            15.10.2.4. By Application

    15.11. BENELUX

        15.11.1. Pricing Analysis

        15.11.2. Market Share Analysis, 2021

            15.11.2.1. By Component

            15.11.2.2. By Type

            15.11.2.3. By Delivery Mode

            15.11.2.4. By Application

    15.12. China

        15.12.1. Pricing Analysis

        15.12.2. Market Share Analysis, 2021

            15.12.2.1. By Component

            15.12.2.2. By Type

            15.12.2.3. By Delivery Mode

            15.12.2.4. By Application

    15.13. Japan

        15.13.1. Pricing Analysis

        15.13.2. Market Share Analysis, 2021

            15.13.2.1. By Component

            15.13.2.2. By Type

            15.13.2.3. By Delivery Mode

            15.13.2.4. By Application

    15.14. South Korea

        15.14.1. Pricing Analysis

        15.14.2. Market Share Analysis, 2021

            15.14.2.1. By Component

            15.14.2.2. By Type

            15.14.2.3. By Delivery Mode

            15.14.2.4. By Application

    15.15. India

        15.15.1. Pricing Analysis

        15.15.2. Market Share Analysis, 2021

            15.15.2.1. By Component

            15.15.2.2. By Type

            15.15.2.3. By Delivery Mode

            15.15.2.4. By Application

    15.16. Thailand

        15.16.1. Pricing Analysis

        15.16.2. Market Share Analysis, 2021

            15.16.2.1. By Component

            15.16.2.2. By Type

            15.16.2.3. By Delivery Mode

            15.16.2.4. By Application

    15.17. Malaysia

        15.17.1. Pricing Analysis

        15.17.2. Market Share Analysis, 2021

            15.17.2.1. By Component

            15.17.2.2. By Type

            15.17.2.3. By Delivery Mode

            15.17.2.4. By Application

    15.18. Indonesia

        15.18.1. Pricing Analysis

        15.18.2. Market Share Analysis, 2021

            15.18.2.1. By Component

            15.18.2.2. By Type

            15.18.2.3. By Delivery Mode

            15.18.2.4. By Application

    15.19. GCC Countries

        15.19.1. Pricing Analysis

        15.19.2. Market Share Analysis, 2021

            15.19.2.1. By Component

            15.19.2.2. By Type

            15.19.2.3. By Delivery Mode

            15.19.2.4. By Application

16. Market Structure Analysis

    16.1. Competition Dashboard

    16.2. Competition Benchmarking

    16.3. Market Share Analysis of Top Players

        16.3.1. By Regional

        16.3.2. By Component

        16.3.3. By Type

        16.3.4. By Delivery Mode

        16.3.5. By Application

17. Competition Analysis

    17.1. Competition Deep Dive

        17.1.1. IBM Corporation

            17.1.1.1. Overview

            17.1.1.2. Product Portfolio

            17.1.1.3. Profitability by Market Segments

            17.1.1.4. Sales Footprint

            17.1.1.5. Strategy Overview

                17.1.1.5.1. Marketing Strategy

        17.1.2. McKesson Corporation

            17.1.2.1. Overview

            17.1.2.2. Product Portfolio

            17.1.2.3. Profitability by Market Segments

            17.1.2.4. Sales Footprint

            17.1.2.5. Strategy Overview

                17.1.2.5.1. Marketing Strategy

        17.1.3. SAS Institute Inc.

            17.1.3.1. Overview

            17.1.3.2. Product Portfolio

            17.1.3.3. Profitability by Market Segments

            17.1.3.4. Sales Footprint

            17.1.3.5. Strategy Overview

                17.1.3.5.1. Marketing Strategy

        17.1.4. Optum Inc.

            17.1.4.1. Overview

            17.1.4.2. Product Portfolio

            17.1.4.3. Profitability by Market Segments

            17.1.4.4. Sales Footprint

            17.1.4.5. Strategy Overview

                17.1.4.5.1. Marketing Strategy

        17.1.5. Oracle

            17.1.5.1. Overview

            17.1.5.2. Product Portfolio

            17.1.5.3. Profitability by Market Segments

            17.1.5.4. Sales Footprint

            17.1.5.5. Strategy Overview

                17.1.5.5.1. Marketing Strategy

        17.1.6. IQVIA

            17.1.6.1. Overview

            17.1.6.2. Product Portfolio

            17.1.6.3. Profitability by Market Segments

            17.1.6.4. Sales Footprint

            17.1.6.5. Strategy Overview

                17.1.6.5.1. Marketing Strategy

        17.1.7. Cerner Corporation

            17.1.7.1. Overview

            17.1.7.2. Product Portfolio

            17.1.7.3. Profitability by Market Segments

            17.1.7.4. Sales Footprint

            17.1.7.5. Strategy Overview

                17.1.7.5.1. Marketing Strategy

        17.1.8. Truven Health Analytics, Inc.

            17.1.8.1. Overview

            17.1.8.2. Product Portfolio

            17.1.8.3. Profitability by Market Segments

            17.1.8.4. Sales Footprint

            17.1.8.5. Strategy Overview

                17.1.8.5.1. Marketing Strategy

18. Assumptions & Acronyms Used

19. Research Methodology

List of Tables

Table 1: Global Market Value (US$ Million) Forecast by Region, 2017 to 2032

Table 2: Global Market Value (US$ Million) Forecast by Component, 2017 to 2032

Table 3: Global Market Value (US$ Million) Forecast by Type, 2017 to 2032

Table 4: Global Market Value (US$ Million) Forecast by Delivery Mode, 2017 to 2032

Table 5: Global Market Value (US$ Million) Forecast by Application, 2017 to 2032

Table 6: North America Market Value (US$ Million) Forecast by Country, 2017 to 2032

Table 7: North America Market Value (US$ Million) Forecast by Component, 2017 to 2032

Table 8: North America Market Value (US$ Million) Forecast by Type, 2017 to 2032

Table 9: North America Market Value (US$ Million) Forecast by Delivery Mode, 2017 to 2032

Table 10: North America Market Value (US$ Million) Forecast by Application, 2017 to 2032

Table 11: Latin America Market Value (US$ Million) Forecast by Country, 2017 to 2032

Table 12: Latin America Market Value (US$ Million) Forecast by Component, 2017 to 2032

Table 13: Latin America Market Value (US$ Million) Forecast by Type, 2017 to 2032

Table 14: Latin America Market Value (US$ Million) Forecast by Delivery Mode, 2017 to 2032

Table 15: Latin America Market Value (US$ Million) Forecast by Application, 2017 to 2032

Table 16: Europe Market Value (US$ Million) Forecast by Country, 2017 to 2032

Table 17: Europe Market Value (US$ Million) Forecast by Component, 2017 to 2032

Table 18: Europe Market Value (US$ Million) Forecast by Type, 2017 to 2032

Table 19: Europe Market Value (US$ Million) Forecast by Delivery Mode, 2017 to 2032

Table 20: Europe Market Value (US$ Million) Forecast by Application, 2017 to 2032

Table 21: Asia Pacific Market Value (US$ Million) Forecast by Country, 2017 to 2032

Table 22: Asia Pacific Market Value (US$ Million) Forecast by Component, 2017 to 2032

Table 23: Asia Pacific Market Value (US$ Million) Forecast by Type, 2017 to 2032

Table 24: Asia Pacific Market Value (US$ Million) Forecast by Delivery Mode, 2017 to 2032

Table 25: Asia Pacific Market Value (US$ Million) Forecast by Application, 2017 to 2032

Table 26: MEA Market Value (US$ Million) Forecast by Country, 2017 to 2032

Table 27: MEA Market Value (US$ Million) Forecast by Component, 2017 to 2032

Table 28: MEA Market Value (US$ Million) Forecast by Type, 2017 to 2032

Table 29: MEA Market Value (US$ Million) Forecast by Delivery Mode, 2017 to 2032

Table 30: MEA Market Value (US$ Million) Forecast by Application, 2017 to 2032

List of Charts

Figure 1: Global Market Value (US$ Million) by Component, 2022 to 2032

Figure 2: Global Market Value (US$ Million) by Type, 2022 to 2032

Figure 3: Global Market Value (US$ Million) by Delivery Mode, 2022 to 2032

Figure 4: Global Market Value (US$ Million) by Application, 2022 to 2032

Figure 5: Global Market Value (US$ Million) by Region, 2022 to 2032

Figure 6: Global Market Value (US$ Million) Analysis by Region, 2017 to 2032

Figure 7: Global Market Value Share (%) and BPS Analysis by Region, 2022 to 2032

Figure 8: Global Market Y-o-Y Growth (%) Projections by Region, 2022 to 2032

Figure 9: Global Market Value (US$ Million) Analysis by Component, 2017 to 2032

Figure 10: Global Market Value Share (%) and BPS Analysis by Component, 2022 to 2032

Figure 11: Global Market Y-o-Y Growth (%) Projections by Component, 2022 to 2032

Figure 12: Global Market Value (US$ Million) Analysis by Type, 2017 to 2032

Figure 13: Global Market Value Share (%) and BPS Analysis by Type, 2022 to 2032

Figure 14: Global Market Y-o-Y Growth (%) Projections by Type, 2022 to 2032

Figure 15: Global Market Value (US$ Million) Analysis by Delivery Mode, 2017 to 2032

Figure 16: Global Market Value Share (%) and BPS Analysis by Delivery Mode, 2022 to 2032

Figure 17: Global Market Y-o-Y Growth (%) Projections by Delivery Mode, 2022 to 2032

Figure 18: Global Market Value (US$ Million) Analysis by Application, 2017 to 2032

Figure 19: Global Market Value Share (%) and BPS Analysis by Application, 2022 to 2032

Figure 20: Global Market Y-o-Y Growth (%) Projections by Application, 2022 to 2032

Figure 21: Global Market Attractiveness by Component, 2022 to 2032

Figure 22: Global Market Attractiveness by Type, 2022 to 2032

Figure 23: Global Market Attractiveness by Delivery Mode, 2022 to 2032

Figure 24: Global Market Attractiveness by Application, 2022 to 2032

Figure 25: Global Market Attractiveness by Region, 2022 to 2032

Figure 26: North America Market Value (US$ Million) by Component, 2022 to 2032

Figure 27: North America Market Value (US$ Million) by Type, 2022 to 2032

Figure 28: North America Market Value (US$ Million) by Delivery Mode, 2022 to 2032

Figure 29: North America Market Value (US$ Million) by Application, 2022 to 2032

Figure 30: North America Market Value (US$ Million) by Country, 2022 to 2032

Figure 31: North America Market Value (US$ Million) Analysis by Country, 2017 to 2032

Figure 32: North America Market Value Share (%) and BPS Analysis by Country, 2022 to 2032

Figure 33: North America Market Y-o-Y Growth (%) Projections by Country, 2022 to 2032

Figure 34: North America Market Value (US$ Million) Analysis by Component, 2017 to 2032

Figure 35: North America Market Value Share (%) and BPS Analysis by Component, 2022 to 2032

Figure 36: North America Market Y-o-Y Growth (%) Projections by Component, 2022 to 2032

Figure 37: North America Market Value (US$ Million) Analysis by Type, 2017 to 2032

Figure 38: North America Market Value Share (%) and BPS Analysis by Type, 2022 to 2032

Figure 39: North America Market Y-o-Y Growth (%) Projections by Type, 2022 to 2032

Figure 40: North America Market Value (US$ Million) Analysis by Delivery Mode, 2017 to 2032

Figure 41: North America Market Value Share (%) and BPS Analysis by Delivery Mode, 2022 to 2032

Figure 42: North America Market Y-o-Y Growth (%) Projections by Delivery Mode, 2022 to 2032

Figure 43: North America Market Value (US$ Million) Analysis by Application, 2017 to 2032

Figure 44: North America Market Value Share (%) and BPS Analysis by Application, 2022 to 2032

Figure 45: North America Market Y-o-Y Growth (%) Projections by Application, 2022 to 2032

Figure 46: North America Market Attractiveness by Component, 2022 to 2032

Figure 47: North America Market Attractiveness by Type, 2022 to 2032

Figure 48: North America Market Attractiveness by Delivery Mode, 2022 to 2032

Figure 49: North America Market Attractiveness by Application, 2022 to 2032

Figure 50: North America Market Attractiveness by Country, 2022 to 2032

Figure 51: Latin America Market Value (US$ Million) by Component, 2022 to 2032

Figure 52: Latin America Market Value (US$ Million) by Type, 2022 to 2032

Figure 53: Latin America Market Value (US$ Million) by Delivery Mode, 2022 to 2032

Figure 54: Latin America Market Value (US$ Million) by Application, 2022 to 2032

Figure 55: Latin America Market Value (US$ Million) by Country, 2022 to 2032

Figure 56: Latin America Market Value (US$ Million) Analysis by Country, 2017 to 2032

Figure 57: Latin America Market Value Share (%) and BPS Analysis by Country, 2022 to 2032

Figure 58: Latin America Market Y-o-Y Growth (%) Projections by Country, 2022 to 2032

Figure 59: Latin America Market Value (US$ Million) Analysis by Component, 2017 to 2032

Figure 60: Latin America Market Value Share (%) and BPS Analysis by Component, 2022 to 2032

Figure 61: Latin America Market Y-o-Y Growth (%) Projections by Component, 2022 to 2032

Figure 62: Latin America Market Value (US$ Million) Analysis by Type, 2017 to 2032

Figure 63: Latin America Market Value Share (%) and BPS Analysis by Type, 2022 to 2032

Figure 64: Latin America Market Y-o-Y Growth (%) Projections by Type, 2022 to 2032

Figure 65: Latin America Market Value (US$ Million) Analysis by Delivery Mode, 2017 to 2032

Figure 66: Latin America Market Value Share (%) and BPS Analysis by Delivery Mode, 2022 to 2032

Figure 67: Latin America Market Y-o-Y Growth (%) Projections by Delivery Mode, 2022 to 2032

Figure 68: Latin America Market Value (US$ Million) Analysis by Application, 2017 to 2032

Figure 69: Latin America Market Value Share (%) and BPS Analysis by Application, 2022 to 2032

Figure 70: Latin America Market Y-o-Y Growth (%) Projections by Application, 2022 to 2032

Figure 71: Latin America Market Attractiveness by Component, 2022 to 2032

Figure 72: Latin America Market Attractiveness by Type, 2022 to 2032

Figure 73: Latin America Market Attractiveness by Delivery Mode, 2022 to 2032

Figure 74: Latin America Market Attractiveness by Application, 2022 to 2032

Figure 75: Latin America Market Attractiveness by Country, 2022 to 2032

Figure 76: Europe Market Value (US$ Million) by Component, 2022 to 2032

Figure 77: Europe Market Value (US$ Million) by Type, 2022 to 2032

Figure 78: Europe Market Value (US$ Million) by Delivery Mode, 2022 to 2032

Figure 79: Europe Market Value (US$ Million) by Application, 2022 to 2032

Figure 80: Europe Market Value (US$ Million) by Country, 2022 to 2032

Figure 81: Europe Market Value (US$ Million) Analysis by Country, 2017 to 2032

Figure 82: Europe Market Value Share (%) and BPS Analysis by Country, 2022 to 2032

Figure 83: Europe Market Y-o-Y Growth (%) Projections by Country, 2022 to 2032

Figure 84: Europe Market Value (US$ Million) Analysis by Component, 2017 to 2032

Figure 85: Europe Market Value Share (%) and BPS Analysis by Component, 2022 to 2032

Figure 86: Europe Market Y-o-Y Growth (%) Projections by Component, 2022 to 2032

Figure 87: Europe Market Value (US$ Million) Analysis by Type, 2017 to 2032

Figure 88: Europe Market Value Share (%) and BPS Analysis by Type, 2022 to 2032

Figure 89: Europe Market Y-o-Y Growth (%) Projections by Type, 2022 to 2032

Figure 90: Europe Market Value (US$ Million) Analysis by Delivery Mode, 2017 to 2032

Figure 91: Europe Market Value Share (%) and BPS Analysis by Delivery Mode, 2022 to 2032

Figure 92: Europe Market Y-o-Y Growth (%) Projections by Delivery Mode, 2022 to 2032

Figure 93: Europe Market Value (US$ Million) Analysis by Application, 2017 to 2032

Figure 94: Europe Market Value Share (%) and BPS Analysis by Application, 2022 to 2032

Figure 95: Europe Market Y-o-Y Growth (%) Projections by Application, 2022 to 2032

Figure 96: Europe Market Attractiveness by Component, 2022 to 2032

Figure 97: Europe Market Attractiveness by Type, 2022 to 2032

Figure 98: Europe Market Attractiveness by Delivery Mode, 2022 to 2032

Figure 99: Europe Market Attractiveness by Application, 2022 to 2032

Figure 100: Europe Market Attractiveness by Country, 2022 to 2032

Figure 101: Asia Pacific Market Value (US$ Million) by Component, 2022 to 2032

Figure 102: Asia Pacific Market Value (US$ Million) by Type, 2022 to 2032

Figure 103: Asia Pacific Market Value (US$ Million) by Delivery Mode, 2022 to 2032

Figure 104: Asia Pacific Market Value (US$ Million) by Application, 2022 to 2032

Figure 105: Asia Pacific Market Value (US$ Million) by Country, 2022 to 2032

Figure 106: Asia Pacific Market Value (US$ Million) Analysis by Country, 2017 to 2032

Figure 107: Asia Pacific Market Value Share (%) and BPS Analysis by Country, 2022 to 2032

Figure 108: Asia Pacific Market Y-o-Y Growth (%) Projections by Country, 2022 to 2032

Figure 109: Asia Pacific Market Value (US$ Million) Analysis by Component, 2017 to 2032

Figure 110: Asia Pacific Market Value Share (%) and BPS Analysis by Component, 2022 to 2032

Figure 111: Asia Pacific Market Y-o-Y Growth (%) Projections by Component, 2022 to 2032

Figure 112: Asia Pacific Market Value (US$ Million) Analysis by Type, 2017 to 2032

Figure 113: Asia Pacific Market Value Share (%) and BPS Analysis by Type, 2022 to 2032

Figure 114: Asia Pacific Market Y-o-Y Growth (%) Projections by Type, 2022 to 2032

Figure 115: Asia Pacific Market Value (US$ Million) Analysis by Delivery Mode, 2017 to 2032

Figure 116: Asia Pacific Market Value Share (%) and BPS Analysis by Delivery Mode, 2022 to 2032

Figure 117: Asia Pacific Market Y-o-Y Growth (%) Projections by Delivery Mode, 2022 to 2032

Figure 118: Asia Pacific Market Value (US$ Million) Analysis by Application, 2017 to 2032

Figure 119: Asia Pacific Market Value Share (%) and BPS Analysis by Application, 2022 to 2032

Figure 120: Asia Pacific Market Y-o-Y Growth (%) Projections by Application, 2022 to 2032

Figure 121: Asia Pacific Market Attractiveness by Component, 2022 to 2032

Figure 122: Asia Pacific Market Attractiveness by Type, 2022 to 2032

Figure 123: Asia Pacific Market Attractiveness by Delivery Mode, 2022 to 2032

Figure 124: Asia Pacific Market Attractiveness by Application, 2022 to 2032

Figure 125: Asia Pacific Market Attractiveness by Country, 2022 to 2032

Figure 126: MEA Market Value (US$ Million) by Component, 2022 to 2032

Figure 127: MEA Market Value (US$ Million) by Type, 2022 to 2032

Figure 128: MEA Market Value (US$ Million) by Delivery Mode, 2022 to 2032

Figure 129: MEA Market Value (US$ Million) by Application, 2022 to 2032

Figure 130: MEA Market Value (US$ Million) by Country, 2022 to 2032

Figure 131: MEA Market Value (US$ Million) Analysis by Country, 2017 to 2032

Figure 132: MEA Market Value Share (%) and BPS Analysis by Country, 2022 to 2032

Figure 133: MEA Market Y-o-Y Growth (%) Projections by Country, 2022 to 2032

Figure 134: MEA Market Value (US$ Million) Analysis by Component, 2017 to 2032

Figure 135: MEA Market Value Share (%) and BPS Analysis by Component, 2022 to 2032

Figure 136: MEA Market Y-o-Y Growth (%) Projections by Component, 2022 to 2032

Figure 137: MEA Market Value (US$ Million) Analysis by Type, 2017 to 2032

Figure 138: MEA Market Value Share (%) and BPS Analysis by Type, 2022 to 2032

Figure 139: MEA Market Y-o-Y Growth (%) Projections by Type, 2022 to 2032

Figure 140: MEA Market Value (US$ Million) Analysis by Delivery Mode, 2017 to 2032

Figure 141: MEA Market Value Share (%) and BPS Analysis by Delivery Mode, 2022 to 2032

Figure 142: MEA Market Y-o-Y Growth (%) Projections by Delivery Mode, 2022 to 2032

Figure 143: MEA Market Value (US$ Million) Analysis by Application, 2017 to 2032

Figure 144: MEA Market Value Share (%) and BPS Analysis by Application, 2022 to 2032

Figure 145: MEA Market Y-o-Y Growth (%) Projections by Application, 2022 to 2032

Figure 146: MEA Market Attractiveness by Component, 2022 to 2032

Figure 147: MEA Market Attractiveness by Type, 2022 to 2032

Figure 148: MEA Market Attractiveness by Delivery Mode, 2022 to 2032

Figure 149: MEA Market Attractiveness by Application, 2022 to 2032

Figure 150: MEA Market Attractiveness by Country, 2022 to 2032

Recommendations

Technology

Financial Analytics Market

Published : October 2023

Technology

Analytics Of Things Market

Published : January 2023

Technology

In-Memory Analytics Tools Market

Published : June 2022

Explore Technology Insights

View Reports

Healthcare Analytics Market