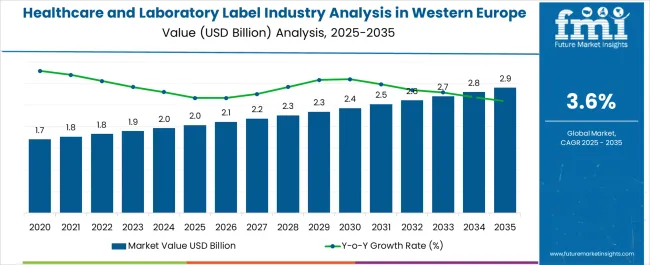
The Healthcare and Laboratory Label Industry Analysis in Western Europe is estimated to be valued at USD 2.0 billion in 2025 and is projected to reach USD 2.9 billion by 2035, registering a compound annual growth rate (CAGR) of 3.6% over the forecast period.

| Metric | Value |
|---|---|
| Healthcare and Laboratory Label Industry Analysis in Western Europe Estimated Value in (2025 E) | USD 2.0 billion |
| Healthcare and Laboratory Label Industry Analysis in Western Europe Forecast Value in (2035 F) | USD 2.9 billion |
| Forecast CAGR (2025 to 2035) | 3.6% |
The healthcare and laboratory label industry in Western Europe is experiencing steady growth. Increasing demand for accurate labeling in pharmaceuticals, medical devices, and laboratory samples is driving adoption. Current market dynamics are influenced by stringent regulatory requirements for traceability, patient safety, and compliance with regional labeling standards.
Technological advancements in printing, adhesive formulations, and durable substrates are enhancing product performance and reliability. The future outlook is shaped by expansion of pharmaceutical manufacturing, growing laboratory testing volumes, and rising awareness about product authenticity and counterfeit prevention. Industry players are focusing on innovation, including smart labels and tamper-evident solutions, to meet evolving end-user expectations.
Growth rationale is anchored on the critical role of labeling in regulatory compliance, inventory management, and quality assurance Continuous improvements in material quality, printing technology, and distribution efficiency are expected to support sustainable market expansion and maintain high adoption levels across healthcare and laboratory applications in the region.

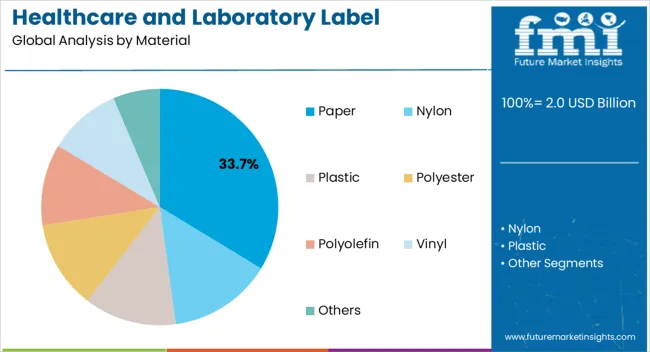
The paper segment, representing 33.70% of the material category, has maintained a leading position due to its cost-effectiveness, printability, and compatibility with a wide range of labeling applications. Demand has been reinforced by its suitability for both pharmaceutical packaging and laboratory sample labeling, where legibility and adherence to standards are critical.
Production efficiencies, consistent quality, and regulatory compliance have strengthened market confidence. Ongoing innovation in coatings and adhesive integration has improved durability, moisture resistance, and print quality, ensuring reliability in diverse healthcare environments.
The segment’s share is further supported by widespread adoption among manufacturers seeking standardized, easily deployable labeling solutions, and sustained investment in material enhancements is expected to maintain its leadership position within the healthcare and laboratory label market in Western Europe.

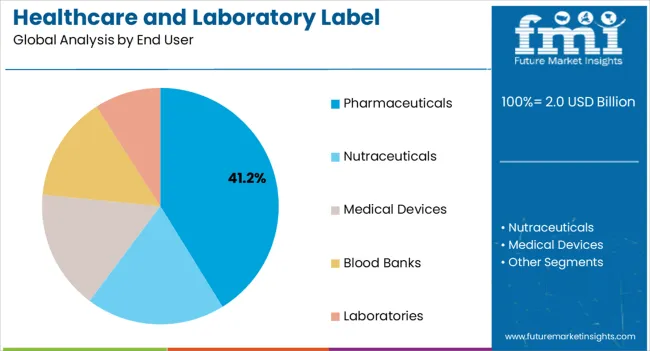
The pharmaceuticals segment, accounting for 41.20% of the end-user category, has remained the leading segment due to high demand for precise, compliant labeling in drug packaging and distribution. Adoption has been driven by regulatory mandates, increasing drug production, and the need for traceability across supply chains.
Label performance, including resistance to chemicals, moisture, and abrasion, has been a critical factor in segment growth. Integration of anti-counterfeit features and serialization initiatives has further reinforced adoption in the pharmaceutical sector.
Operational reliability, adherence to Good Manufacturing Practices, and partnerships with label manufacturers have strengthened market positioning Ongoing expansion of pharmaceutical manufacturing facilities and growing emphasis on patient safety are expected to sustain the segment’s market share and drive continued growth in the healthcare and laboratory label industry.
Innovations in labeling technologies, such as smart labels, RFID, and barcode systems, are being adopted to enhance traceability, inventory management, and accuracy in healthcare and laboratory settings. The healthcare and laboratory labels in the United Kingdom is expected to grow with a CAGR of 3.90% from 2025 to 2035.
Continuous investment in healthcare, including pharmaceuticals, medical devices, and laboratory equipment, contributes to sustained demand for accurate and compliant labeling solutions.
Germany is a prominent market for medical devices, necessitating healthcare and laboratory labeling solutions compliant with the EU Medical Devices Regulation (MDR) for devices used in various healthcare settings. The healthcare and laboratory label in Germany is expected to grow with a CAGR of 3.40% from 2025-2035.
country's emphasis on research and development fuels demand for labeling solutions in laboratory settings, including specimen identification, diagnostic tools, and equipment labeling. Integration of labeling systems with digital health platforms, electronic medical records, and laboratory information management systems is gaining traction, influencing labeling trends in Germany.
Plastic remains the prominent material in the healthcare and laboratory label in Western Europe with a share of 63.10%. Plastic labels offer durability and resilience, capable of withstanding various environmental conditions such as moisture, chemicals, and sterilization processes. This durability is crucial in healthcare settings where labels may encounter harsh conditions.
Plastic labels often come with strong adhesive properties, ensuring they remain firmly attached to surfaces, which is essential for critical information to remain intact and readable over time. Plastic labels provide excellent print quality and clarity, ensuring the information on the label remains legible even after prolonged use or exposure to different conditions.
| Attribute | Details |
|---|---|
| Material | Plastics |
| Value Share | 63.10% |
Based on end-use, the pharmaceutical segment is likely to be a prominent utilizer of healthcare and laboratory labels. A revenue share of 29.70% is expected for the segment in 2025.
The pharmaceutical industry operates under stringent regulations regarding labeling and packaging. Compliance with regulations like the EU Medical Device Regulation (MDR), In Vitro Diagnostic Regulation (IVDR), and pharmaceutical standards necessitates highly specialized and compliant labeling, driving significant demand from this sector.
Pharmaceuticals encompass a wide range of products, including prescription drugs, over-the-counter medicines, vaccines, and biologics, each requiring specific labeling to comply with regulations and address the complexities of these products. The continuous increase in healthcare spending, especially on pharmaceuticals, drives the demand for accurate, informative, and compliant labeling solutions.
| Attribute | Details |
|---|---|
| End Use | Pharmaceutical |
| Value Share | 29.70% |

Industry players in healthcare and laboratory labels in Western Europe are using mergers & acquisitions as a critical strategy for expanding their geographical presence and for more business in terms of revenue.
Companies often collaborate with healthcare providers, pharmaceutical companies, or technology firms to develop innovative labeling solutions.
Product Offering
| Attribute | Details |
|---|---|
| Estimated Industry Size in 2025 | USD 2.0 billion |
| Projected Industry Size in 2035 | USD 2.9 billion |
| Anticipated CAGR between 2025 to 2035 | 3.6% CAGR |
| Historical Analysis of Demand for Healthcare and laboratory Label in Western Europe | 2020 to 2025 |
| Demand Forecast for Healthcare and laboratory Label in Western Europe | 2025 to 2035 |
| Report Coverage | Industry Size, Industry Trends, Analysis of key factors influencing Healthcare and laboratory Label in Western Europe, Insights on Global Players and their Industry Strategy in Western Europe, Ecosystem Analysis of Local Providers in Western Europe |
| Key Country Analyzed while Studying Opportunities Healthcare and laboratory Label in Western Europe | The United Kingdom, Germany, Italy, France, Spain, Rest of Western Europe |
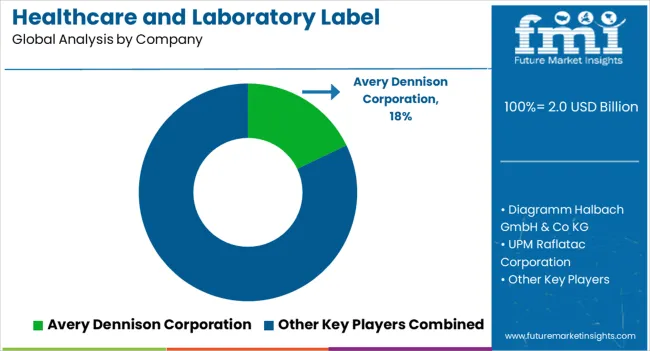
| Key Companies Profiled | Diagramm Halbach GmbH & Co KG; UPM Raflatac Corporation; Advanced Labelling Systems Ltd.; Avery Dennison Corporation; CCL Industries Inc.; 3M Company; Multi-Color Corporation; Brady Corporation; Sato Holdings Corporation; Weber Packaging Solutions Inc.; Schreiner Group GmbH & Co. |
The global healthcare and laboratory label industry analysis in Western Europe is estimated to be valued at USD 2.0 billion in 2025.
The market size for the healthcare and laboratory label industry analysis in Western Europe is projected to reach USD 2.9 billion by 2035.
The healthcare and laboratory label industry analysis in Western Europe is expected to grow at a 3.6% CAGR between 2025 and 2035.
The key product types in healthcare and laboratory label industry analysis in Western Europe are paper, nylon, plastic, polyester, polyolefin, vinyl and others.
In terms of end user, pharmaceuticals segment to command 41.2% share in the healthcare and laboratory label industry analysis in Western Europe in 2025.


Full Research Suite comprises of:
Market outlook & trends analysis
Interviews & case studies
Strategic recommendations
Vendor profiles & capabilities analysis
5-year forecasts
8 regions and 60+ country-level data splits
Market segment data splits
12 months of continuous data updates
DELIVERED AS:
PDF EXCEL ONLINE
Healthcare AI Computer Vision Market Size and Share Forecast Outlook 2025 to 2035
Healthcare Master Data Management Market Size and Share Forecast Outlook 2025 to 2035
Healthcare Contact Center Solution Market Size and Share Forecast Outlook 2025 to 2035
Healthcare Semiconductor Market Size and Share Forecast Outlook 2025 to 2035
Healthcare Mobile Computers Market Size and Share Forecast Outlook 2025 to 2035
Healthcare Companion Robots Market Size and Share Forecast Outlook 2025 to 2035
Healthcare Analytics Market Size and Share Forecast Outlook 2025 to 2035
Healthcare Contract Research Organization Market Analysis – Size, Share, and Forecast Outlook 2025 to 2035
Healthcare Chatbot Market - Growth Trends & Forecast 2025 to 2035
Healthcare Virtual Assistants Market Analysis by Product, End User and Region Through 2035
Healthcare Digital Experience Platform Market Trends - Growth & Forecast 2025 to 2035
Healthcare API Market Growth – Trends & Forecast 2025 to 2035
Healthcare Biometrics Market Trends - Growth, Demand & Forecast 2025 to 2035
Global Healthcare Fabrics Market Insights – Trends & Forecast 2024-2034
Healthcare Technology Management Market Insights – Growth & Forecast 2024-2034
Healthcare IoT Market
Healthcare BPO Market
Healthcare Revenue Cycle Management Software Market – Forecast 2017-2022
Healthcare Interoperability Solutions Market Analysis – Trends & Growth 2025 to 2035
Healthcare Business Intelligence Market Size and Share Forecast Outlook 2025 to 2035

Thank you!
You will receive an email from our Business Development Manager. Please be sure to check your SPAM/JUNK folder too.
Chat With
MaRIA