Reports

- Global Locations -

Headquarters

Future Market Insights, Inc.

Christiana Corporate, 200
Continental Drive, Suite 401,
Newark, Delaware - 19713,
United States

T: +1-845-579-5705

Americas

Future Market Insights, Inc.

616 Corporate Way, Suite 2-9018,
Valley Cottage, NY 10989, United States

T: +1-347-918-3531

MEA

Future Market Insights

1602-6 Jumeirah Bay X2 Tower, Plot No: JLT-PH2-X2A,
Jumeirah Lakes Towers, Dubai,
United Arab Emirates

Europe

Future Market Insights

3rd Floor, 207 Regent Street,
W1B 3HH London
United Kingdom

T: + 44 (0) 20 8123 9659
D: +44 (0) 20 3287 4268

Asia Pacific

Future Market Insights

IndiaLand Global Tech Park, Unit UG-1, Behind Grand HighStreet, Phase 1, Hinjawadi, MH, Pune – 411057, India

Predictive Disease Analytics Market Snapshot

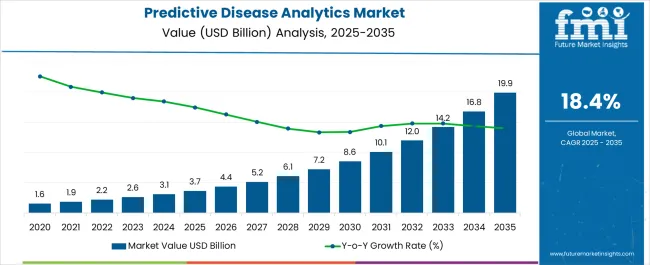
According to the recent report by Future Market Insights (FMI), the predictive disease analytics market size is estimated to stand at US$ 18.64 billion by 2033. Over the forecast period, the market is assessed to trail at a CAGR of 22.5%. For the year 2023, the market is estimated to be worth US$ 2.45 billion.

Market Propellers for Predictive Disease Analytics

  • Surge in Chronic Illnesses: Occurrence of chronic diseases like cancer, diabetes, respiratory diseases, and cardiovascular diseases is rising. As a result, generating a market for predictive disease analytics solutions to efficiently manage such diseases.
  • Technological Advancements: Technological innovations like Machine Learning (ML), Artificial Intelligence (AI), and data analytics have empowered healthcare providers to gather and analyze enormous patient data. With the help of these technologies, health professionals are better equipped to create precise predictive disease analytics solutions.
  • Soaring Adoption of Electronic Health Records (EHRs): Extensive adoption of EHRs has resulted in the accumulation of a massive amount of patient data. As a result, making it is feasible to formulate predictive disease analytics solutions.
  • Propelling Demand for Personalized Medicine: Predictive disease analytics solutions enable healthcare professionals to tailor treatments according to individual patients, taking into consideration their medical histories and unique characteristics.
  • Governmental Focus on Developing Healthcare IT: Governments across the globe are increasing their investments in healthcare IT infrastructure and encouraging EHRs adoption. The market is projected to foster owing to such favorable government initiatives.

Don't pay for what you don't need

Customize your report by selecting specific countries or regions and save 30%!

Predictive Disease Analytics to Fill the Loopholes in the Healthcare Industry

The healthcare industry has been facing challenges in the form of spiking treatment expenses, a dearth of improved patient care, and low patient engagement and retention. Therefore, predictive data analysis techniques are being deployed throughout the healthcare sector to offer enhanced patient care and upgrade operations. These are some key factors propelling the healthcare analytics industry.

In November 2022, for instance, Google Cloud and Hartford HealthCare officially declared their long-term partnership. The partnership is to digitally transform their healthcare system to enhance patient care and data analytics.

Surging Governmental Support

The rise in government initiatives and huge finance invested in the healthcare industry bolstered the market. In February 2023, the European Commission invested US$ 7.2 million for a new project aimed at developing an AI-based platform. This platform is going to collect and analyze clinical data on new medicines of oncology to encourage their assessment via regulators and health technology assessment agencies (HTA).

Likewise, the United States government is launching the HealthData.gov portal. The portal captures information from various federal databases on clinical data, medical and patient knowledge, and community health performance.

Attributes Details
Predictive Disease Analytics Market Value (2023) US$ 2.45 billion
Predictive Disease Analytics Market Forecast Value (2033) US$ 18.64 billion
Predictive Disease Analytics Market CAGR (2023 to 2033) 22.5%

2018 to 2022 Predictive Disease Analytics Demand Outlook Compared to 2023 to 2033 Market Forecast

The market generated a revenue of US$ 2 billion in 2022. The market is set to register a CAGR of 22.5% to reach US$ 2.45 billion in 2023.

The predictive disease analytics industry is being driven by the following factors

  • Increasing advancements in Machine Learning (ML) and Artificial Intelligence (AI) to generate more efficient and effective results.
  • Growing demand for medicine tailored to individual needs.
  • Potential use of predictive disease analytics in programs related to population health management.

Predicted Growth of Predictive Disease Analytics Market Over the Forecast Period

Duration Market Analysis
Short-term Growth The market is anticipated to stand at a valuation of US$ 3.68 billion by 2025. Increasing emphasis on preventive care is propelling the deployment of disease prediction using symptoms dataset. With the help of predictive disease analytics, healthcare providers are better able to identify patients who are at risk of suffering from certain conditions. These solutions help in potentially minimizing healthcare expenditure.
Medium-term Growth By 2028 end, the market is estimated to surpass a market worth of US$ 6.76 billion. The market is expected to be led by the accelerating telehealth sector, particularly for predictive disease analytics. These solutions are predicted to be used to support telemedicine consultations and remote patient monitoring.
Long-term Growth The market is projected to amass a total of US$ 18.64 billion by 2033. In the long run, integration of these solutions with blockchain technology is anticipated to boost the transparency and security of patient data. As a result, making it is convenient to share and analyze health insights spanning different healthcare organizations.
Sabyasachi Ghosh
Sabyasachi Ghosh

Principal Consultant

Talk to Analyst

Find your sweet spots for generating winning opportunities in this market.

Comparative Analysis of Adjacent Markets

Predictive Disease Analytics Market:

Differentiating Aspects Predictive Disease Analytics Market
CAGR (Forecast Period) 22.5%
Market Valuation in 2023 US$ 2.45 billion
Projected Market Value by 2033 US$ 18.64 billion
Growth Factors Surging chronic illnesses
Trends Healthcare tourism
Opportunities Increasing governmental support

Predictive Analytics Market:

Differentiating Aspects Predictive Analytics Market
CAGR (Forecast Period) 15.8%
Market Valuation in 2023 US$ 14.08 billion
Projected Market Value by 2033 US$ 61.05 billion
Growth Factors Growing awareness regarding the generation of a huge volume of data
Trends Increasing deployment of real-time analytics information to develop personalized offers
Opportunities Increasing technological upgradations in the market

Machine Learning (ML) Market:

Differentiating Aspects Machine Learning (ML) Market
CAGR (Forecast Period) 38%
Market Valuation in 2023 US$ 29.21 billion
Projected Market Value by 2033 US$ 731.80 billion
Growth Factors Surging applications of ML in the healthcare sector
Trends Booming e-commerce sector
Opportunities Increasing investments by small and mid-sized enterprises to deploy ML technology

Segmentation Division

Software and Services to Acquire Robust Momentum Over the Forecast Period

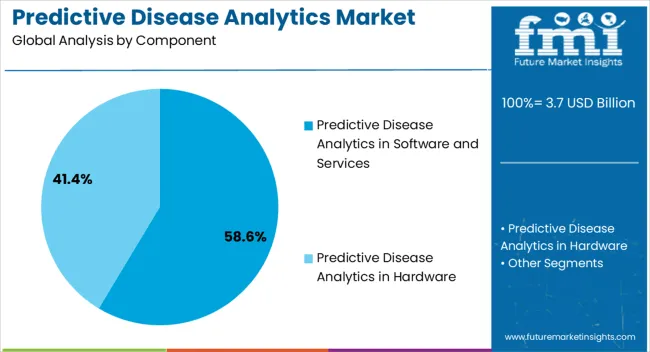
The software and services segment accounted for a maximum share of 69.9% in 2022. The segment is also anticipated to observe a significant CAGR over the forecast period. Digitalization of data and the development of platforms has led to considerable investments by the healthcare sector into the IT sector.

Since a significant amount of businesses don’t have an in-house data analytics department, they outsource data analytics work to their IT team. Due to the aforesaid factor, data analytics firms are growing in business and more of these firms are coming into the business. These firms offer an entire range of services to businesses. The growing scope of services and new services aimed to meet evolving business demands are further enhancing segment growth.

On-premise Segment to Enjoy Huge Pie of Predictive Disease Analytics Market

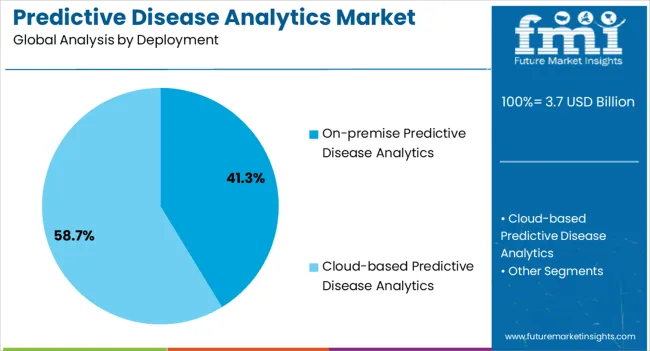
The on-premise section led the predictive disease analytics industry by acquiring a total revenue share of 65.9% in 2022. Due to the high security and convenience of access offered by on-premise deployment, several institutions are focusing on installing instruments and software to accumulate data at their premises. This comes in handy for small businesses. However, in case it is scaled up to manage a sizeable dataset of businesses, it can make data management tiring and challenging.

Cloud-based Solutions to Expand at a Robust Pace

The cloud-based solutions segment is projected to register a prominent CAGR in the assessment period. Growing demand for solutions that offer easy storage, more flexibility and efficiency, and low capital requirements is boosting the adoption of cloud-based solutions. Further, these solutions also help enhance user engagement and obtain medical evidence from anywhere and at any given time. Companies offering predictive disease analytics are actively concentrating on multiple strategic initiatives to bolster segment growth.

Payer Segment to Hold a Significant Market Share

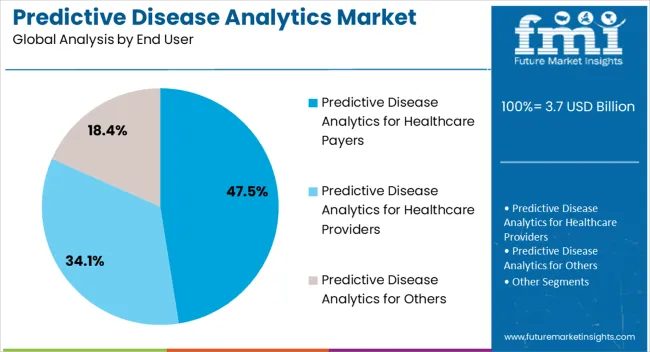
The payer segment is expected to rule the market, on the basis of the end user. The market share of this segment is anticipated to be 40.9% in 2022. The payer segment consists of government agencies, insurance companies, third-party payers, and health plan sponsors (unions and employers). These companies or institutions are employing predictive disease analytics tools. To properly evaluate insurance claims before payment settlement, disease risk assessment, and detecting and detecting and preventing fraudulent claims. Increasing utilization of historical as well as current data by payers to predict future trends is expected to boost segment growth.

Provider Section to Witness Expeditious Growth

The provider segment is expected to expand expeditiously in the upcoming years. Some key drivers of the market include soaring healthcare outlay and increasing investment in healthcare infrastructure. Surging chronic disorders and the rising geriatric population is also pushing several providers to invest in predictive disease analytics solutions. These solutions enable providers to identify patterns and trends and make shrewd decisions regarding treatment and allocation of resources.

These services also help by offering insights and forecasting demand for healthcare services and strategizing for future needs. In October 2022, the research team at the University of Pennsylvania Perelman School of Medicine and the University of Florida made an announcement. The declaration was to establish a set of predictive analytics algorithms to find out which patients are likely to develop a rare disease.
Get the data you need at a Fraction of the cost

Personalize your report by choosing insights you need
and save 40%!

Geographic Forecasts

United States Market Boasts of Lion’s Share

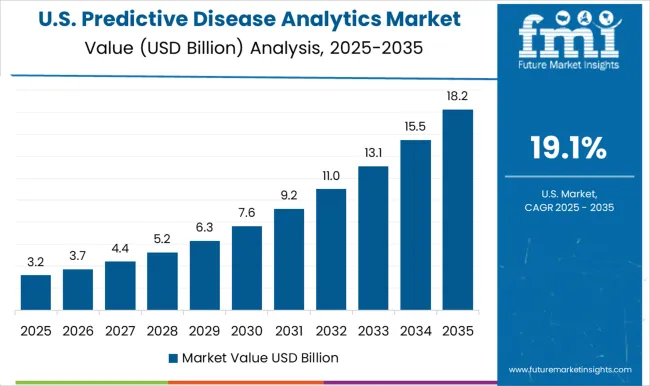
The United States predictive disease analytics industry occupied a huge market share in 2022. The country is home to significantly advanced healthcare facilities that boast predictive disease analytics. In addition to this, a rise in chronic disorders and a surging density of the geriatric population has been witnessed in the country. This has led to heightened demand for analytics tools from hospitals, clinics, and other organizations.

Moreover, the high count of key players in the United States market is also contributing to market growth. In September 2020, Microsoft introduced Microsoft Cloud for Healthcare aimed to unite providers and patients in gaining better insights pertaining to patient care.

China to Observe Accelerated Growth

The China predictive disease analytics industry is expected to account for robust CAGR in the stipulated time frame. Favorable government policies and support are catalyzing market development in this country. Additionally, increasing expenditure on healthcare is the propelling market expansion and opening up new avenues for growth.

The increasing geriatric population and surging cases of chronic disorders are two crucial factors for market growth in China. As per the United States Census Bureau’s survey, in 2020, the geriatric population amounted to 414 million individuals in Asia. Moreover, by 2060 end, that figure is going to reach 1.2 billion.
Competitive Intelligence: Strategic Undertakings Adopted by Market Players

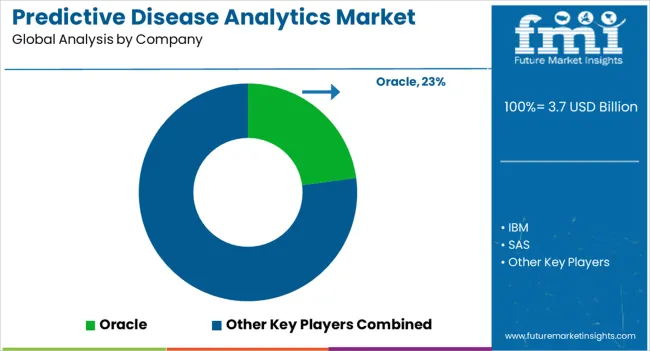
Top players in the market are concentrating their efforts on developing new solutions and tools. These efforts are made to cater to the surging demand for predictive disease analytics from the life sciences and healthcare industry. Moreover, mergers and acquisitions and extension in geographic footprint are some key tactics adopted by these players.

In January 2023, SwitchPoint Ventures and Ardent Health Service partnered together to release an innovation studio. This studio focuses on creating and deploying data-driven solutions. Additionally, Ardent has also adopted Polaris, which is SwitchPoint’s new solution to precisely predict patient volume in a clinical set-up.

Escalating investments in healthcare further bolsters startups to enter the market, thereby increasing the competition. FMI has profiled the following players in the market report

  • Oracle
  • IBM
  • SAS
  • Allscripts Healthcare Solutions Inc.
  • MedeAnalytics, Inc.
  • Health Catalyst.
  • Apixio Inc.

Scope of Report

Attribute Details
Forecast Period 2023 to 2033
Historical Data Available for 2018 to 2022
Market Analysis US$ billion for Value
Key Regions Covered
  • North America
  • Europe
  • Asia Pacific
  • Latin America
  • The Middle East and Africa
Key Countries Covered The United States, Canada, Germany, the United Kingdom, France, Italy, NORDICS, Spain, Russia, Poland, BENELUX, China, Japan, India, ASEAN, Oceania, South Korea, Brazil, Mexico, Argentina, GCC Countries, South Africa, Northern Africa, Türkiye
Key Segments Covered Component, Deployment, End User, and Region
Key Companies Profiled
  • Oracle
  • IBM
  • SAS
  • Allscripts Healthcare Solutions Inc.
  • MedeAnalytics, Inc.
  • Health Catalyst.
  • Apixio Inc.
Report Coverage Market Forecast, Company Share Analysis, Competition Intelligence, DROT Analysis, Market Dynamics and Challenges, and Strategic Growth Initiatives
Customization & Pricing Available upon Request

Predictive Disease Analytics Market by Category

By Component, the Predictive Disease Analytics Industry is segmented as:

  • Predictive Disease Analytics in Software and Services
  • Predictive Disease Analytics in Hardware

By Deployment, the Predictive Disease Analytics Industry is categorized as:

  • On-premise Predictive Disease Analytics
  • Cloud-based Predictive Disease Analytics

By End User, the Predictive Disease Analytics Market is segregated as:

  • Predictive Disease Analytics for Healthcare Payers
  • Predictive Disease Analytics for Healthcare Providers
  • Predictive Disease Analytics for Others

By Region, the Industry of Predictive Disease Analytics is segmented as:

  • Predictive Disease Analytics in North America Market
  • Predictive Disease Analytics in Europe Market
  • Predictive Disease Analytics in Asia Pacific Market
  • Predictive Disease Analytics in Latin America Market
  • Predictive Disease Analytics in the Middle East and Africa Market

Frequently Asked Questions

How Big is the Predictive Disease Analytics Market?

The market is valued at US$ 2.45 billion in 2023.

What is the Growth Potential of the Predictive Disease Analytics Market?

The market is expected to record a 22.5% CAGR through 2033.

How Big will the Predictive Disease Analytics Market by 2033?

The market is estimated to reach US$ 18.64 billion by 2033.

What is the Top Trend Driving the Predictive Disease Analytics Market?

Healthcare tourism is positively influencing the market growth.

Who are the Key Predictive Disease Analytics Market Players?

Oracle, IBM, and SAS are key predictive disease analytics market players.

Table of Content

1. Executive Summary | Predictive Disease Analytics Market

    1.1. Global Market Outlook

    1.2. Demand-side Trends

    1.3. Supply-side Trends

    1.4. Technology Roadmap Analysis

    1.5. Analysis and Recommendations

2. Market Overview

    2.1. Market Coverage / Taxonomy

    2.2. Market Definition / Scope / Limitations

3. Market Background

    3.1. Market Dynamics

        3.1.1. Drivers

        3.1.2. Restraints

        3.1.3. Opportunity

        3.1.4. Trends

    3.2. Scenario Forecast

        3.2.1. Demand in Optimistic Scenario

        3.2.2. Demand in Likely Scenario

        3.2.3. Demand in Conservative Scenario

    3.3. Opportunity Map Analysis

    3.4. Investment Feasibility Matrix

    3.5. PESTLE and Porter’s Analysis

    3.6. Regulatory Landscape

        3.6.1. By Key Regions

        3.6.2. By Key Countries

    3.7. Regional Parent Market Outlook

4. Global Market Analysis 2018 to 2022 and Forecast, 2023 to 2033

    4.1. Historical Market Size Value (US$ Million) Analysis, 2018 to 2022

    4.2. Current and Future Market Size Value (US$ Million) Projections, 2023 to 2033

        4.2.1. Y-o-Y Growth Trend Analysis

        4.2.2. Absolute $ Opportunity Analysis

5. Global Market Analysis 2018 to 2022 and Forecast 2023 to 2033, By Component

    5.1. Introduction / Key Findings

    5.2. Historical Market Size Value (US$ Million) Analysis By Component, 2018 to 2022

    5.3. Current and Future Market Size Value (US$ Million) Analysis and Forecast By Component, 2023 to 2033

        5.3.1. Hardware

        5.3.2. Software

        5.3.3. Services

    5.4. Y-o-Y Growth Trend Analysis By Component, 2018 to 2022

    5.5. Absolute $ Opportunity Analysis By Component, 2023 to 2033

6. Global Market Analysis 2018 to 2022 and Forecast 2023 to 2033, By Deployment

    6.1. Introduction / Key Findings

    6.2. Historical Market Size Value (US$ Million) Analysis By Deployment, 2018 to 2022

    6.3. Current and Future Market Size Value (US$ Million) Analysis and Forecast By Deployment, 2023 to 2033

        6.3.1. On-premise

        6.3.2. Cloud-based

    6.4. Y-o-Y Growth Trend Analysis By Deployment, 2018 to 2022

    6.5. Absolute $ Opportunity Analysis By Deployment, 2023 to 2033

7. Global Market Analysis 2018 to 2022 and Forecast 2023 to 2033, By End User

    7.1. Introduction / Key Findings

    7.2. Historical Market Size Value (US$ Million) Analysis By End User, 2018 to 2022

    7.3. Current and Future Market Size Value (US$ Million) Analysis and Forecast By End User, 2023 to 2033

        7.3.1. Healthcare Payers

        7.3.2. Healthcare Providers

        7.3.3. Research Institutions

    7.4. Y-o-Y Growth Trend Analysis By End User, 2018 to 2022

    7.5. Absolute $ Opportunity Analysis By End User, 2023 to 2033

8. Global Market Analysis 2018 to 2022 and Forecast 2023 to 2033, By Application

    8.1. Introduction / Key Findings

    8.2. Historical Market Size Value (US$ Million) Analysis By Application, 2018 to 2022

    8.3. Current and Future Market Size Value (US$ Million) Analysis and Forecast By Application, 2023 to 2033

        8.3.1. Clinical Data Analytics

        8.3.2. Financial Data Analytics

        8.3.3. Administrative Data Analytics

        8.3.4. Research Data Analytics

    8.4. Y-o-Y Growth Trend Analysis By Application, 2018 to 2022

    8.5. Absolute $ Opportunity Analysis By Application, 2023 to 2033

9. Global Market Analysis 2018 to 2022 and Forecast 2023 to 2033, By Region

    9.1. Introduction

    9.2. Historical Market Size Value (US$ Million) Analysis By Region, 2018 to 2022

    9.3. Current Market Size Value (US$ Million) Analysis and Forecast By Region, 2023 to 2033

        9.3.1. North America

        9.3.2. Latin America

        9.3.3. Europe

        9.3.4. South Asia

        9.3.5. East Asia

        9.3.6. Oceania

        9.3.7. MEA

    9.4. Market Attractiveness Analysis By Region

10. North America Market Analysis 2018 to 2022 and Forecast 2023 to 2033, By Country

    10.1. Historical Market Size Value (US$ Million) Trend Analysis By Market Taxonomy, 2018 to 2022

    10.2. Market Size Value (US$ Million) Forecast By Market Taxonomy, 2023 to 2033

        10.2.1. By Country

            10.2.1.1. USA

            10.2.1.2. Canada

        10.2.2. By Component

        10.2.3. By Deployment

        10.2.4. By End User

        10.2.5. By Application

    10.3. Market Attractiveness Analysis

        10.3.1. By Country

        10.3.2. By Component

        10.3.3. By Deployment

        10.3.4. By End User

        10.3.5. By Application

    10.4. Key Takeaways

11. Latin America Market Analysis 2018 to 2022 and Forecast 2023 to 2033, By Country

    11.1. Historical Market Size Value (US$ Million) Trend Analysis By Market Taxonomy, 2018 to 2022

    11.2. Market Size Value (US$ Million) Forecast By Market Taxonomy, 2023 to 2033

        11.2.1. By Country

            11.2.1.1. Brazil

            11.2.1.2. Mexico

            11.2.1.3. Rest of Latin America

        11.2.2. By Component

        11.2.3. By Deployment

        11.2.4. By End User

        11.2.5. By Application

    11.3. Market Attractiveness Analysis

        11.3.1. By Country

        11.3.2. By Component

        11.3.3. By Deployment

        11.3.4. By End User

        11.3.5. By Application

    11.4. Key Takeaways

12. Europe Market Analysis 2018 to 2022 and Forecast 2023 to 2033, By Country

    12.1. Historical Market Size Value (US$ Million) Trend Analysis By Market Taxonomy, 2018 to 2022

    12.2. Market Size Value (US$ Million) Forecast By Market Taxonomy, 2023 to 2033

        12.2.1. By Country

            12.2.1.1. Germany

            12.2.1.2. United kingdom

            12.2.1.3. France

            12.2.1.4. Spain

            12.2.1.5. Italy

            12.2.1.6. Rest of Europe

        12.2.2. By Component

        12.2.3. By Deployment

        12.2.4. By End User

        12.2.5. By Application

    12.3. Market Attractiveness Analysis

        12.3.1. By Country

        12.3.2. By Component

        12.3.3. By Deployment

        12.3.4. By End User

        12.3.5. By Application

    12.4. Key Takeaways

13. South Asia Market Analysis 2018 to 2022 and Forecast 2023 to 2033, By Country

    13.1. Historical Market Size Value (US$ Million) Trend Analysis By Market Taxonomy, 2018 to 2022

    13.2. Market Size Value (US$ Million) Forecast By Market Taxonomy, 2023 to 2033

        13.2.1. By Country

            13.2.1.1. India

            13.2.1.2. Malaysia

            13.2.1.3. Singapore

            13.2.1.4. Thailand

            13.2.1.5. Rest of South Asia

        13.2.2. By Component

        13.2.3. By Deployment

        13.2.4. By End User

        13.2.5. By Application

    13.3. Market Attractiveness Analysis

        13.3.1. By Country

        13.3.2. By Component

        13.3.3. By Deployment

        13.3.4. By End User

        13.3.5. By Application

    13.4. Key Takeaways

14. East Asia Market Analysis 2018 to 2022 and Forecast 2023 to 2033, By Country

    14.1. Historical Market Size Value (US$ Million) Trend Analysis By Market Taxonomy, 2018 to 2022

    14.2. Market Size Value (US$ Million) Forecast By Market Taxonomy, 2023 to 2033

        14.2.1. By Country

            14.2.1.1. China

            14.2.1.2. Japan

            14.2.1.3. South Korea

        14.2.2. By Component

        14.2.3. By Deployment

        14.2.4. By End User

        14.2.5. By Application

    14.3. Market Attractiveness Analysis

        14.3.1. By Country

        14.3.2. By Component

        14.3.3. By Deployment

        14.3.4. By End User

        14.3.5. By Application

    14.4. Key Takeaways

15. Oceania Market Analysis 2018 to 2022 and Forecast 2023 to 2033, By Country

    15.1. Historical Market Size Value (US$ Million) Trend Analysis By Market Taxonomy, 2018 to 2022

    15.2. Market Size Value (US$ Million) Forecast By Market Taxonomy, 2023 to 2033

        15.2.1. By Country

            15.2.1.1. Australia

            15.2.1.2. New Zealand

        15.2.2. By Component

        15.2.3. By Deployment

        15.2.4. By End User

        15.2.5. By Application

    15.3. Market Attractiveness Analysis

        15.3.1. By Country

        15.3.2. By Component

        15.3.3. By Deployment

        15.3.4. By End User

        15.3.5. By Application

    15.4. Key Takeaways

16. MEA Market Analysis 2018 to 2022 and Forecast 2023 to 2033, By Country

    16.1. Historical Market Size Value (US$ Million) Trend Analysis By Market Taxonomy, 2018 to 2022

    16.2. Market Size Value (US$ Million) Forecast By Market Taxonomy, 2023 to 2033

        16.2.1. By Country

            16.2.1.1. GCC Countries

            16.2.1.2. South Africa

            16.2.1.3. Israel

            16.2.1.4. Rest of MEA

        16.2.2. By Component

        16.2.3. By Deployment

        16.2.4. By End User

        16.2.5. By Application

    16.3. Market Attractiveness Analysis

        16.3.1. By Country

        16.3.2. By Component

        16.3.3. By Deployment

        16.3.4. By End User

        16.3.5. By Application

    16.4. Key Takeaways

17. Key Countries Market Analysis

    17.1. USA

        17.1.1. Pricing Analysis

        17.1.2. Market Share Analysis, 2022

            17.1.2.1. By Component

            17.1.2.2. By Deployment

            17.1.2.3. By End User

            17.1.2.4. By Application

    17.2. Canada

        17.2.1. Pricing Analysis

        17.2.2. Market Share Analysis, 2022

            17.2.2.1. By Component

            17.2.2.2. By Deployment

            17.2.2.3. By End User

            17.2.2.4. By Application

    17.3. Brazil

        17.3.1. Pricing Analysis

        17.3.2. Market Share Analysis, 2022

            17.3.2.1. By Component

            17.3.2.2. By Deployment

            17.3.2.3. By End User

            17.3.2.4. By Application

    17.4. Mexico

        17.4.1. Pricing Analysis

        17.4.2. Market Share Analysis, 2022

            17.4.2.1. By Component

            17.4.2.2. By Deployment

            17.4.2.3. By End User

            17.4.2.4. By Application

    17.5. Germany

        17.5.1. Pricing Analysis

        17.5.2. Market Share Analysis, 2022

            17.5.2.1. By Component

            17.5.2.2. By Deployment

            17.5.2.3. By End User

            17.5.2.4. By Application

    17.6. United kingdom

        17.6.1. Pricing Analysis

        17.6.2. Market Share Analysis, 2022

            17.6.2.1. By Component

            17.6.2.2. By Deployment

            17.6.2.3. By End User

            17.6.2.4. By Application

    17.7. France

        17.7.1. Pricing Analysis

        17.7.2. Market Share Analysis, 2022

            17.7.2.1. By Component

            17.7.2.2. By Deployment

            17.7.2.3. By End User

            17.7.2.4. By Application

    17.8. Spain

        17.8.1. Pricing Analysis

        17.8.2. Market Share Analysis, 2022

            17.8.2.1. By Component

            17.8.2.2. By Deployment

            17.8.2.3. By End User

            17.8.2.4. By Application

    17.9. Italy

        17.9.1. Pricing Analysis

        17.9.2. Market Share Analysis, 2022

            17.9.2.1. By Component

            17.9.2.2. By Deployment

            17.9.2.3. By End User

            17.9.2.4. By Application

    17.10. India

        17.10.1. Pricing Analysis

        17.10.2. Market Share Analysis, 2022

            17.10.2.1. By Component

            17.10.2.2. By Deployment

            17.10.2.3. By End User

            17.10.2.4. By Application

    17.11. Malaysia

        17.11.1. Pricing Analysis

        17.11.2. Market Share Analysis, 2022

            17.11.2.1. By Component

            17.11.2.2. By Deployment

            17.11.2.3. By End User

            17.11.2.4. By Application

    17.12. Singapore

        17.12.1. Pricing Analysis

        17.12.2. Market Share Analysis, 2022

            17.12.2.1. By Component

            17.12.2.2. By Deployment

            17.12.2.3. By End User

            17.12.2.4. By Application

    17.13. Thailand

        17.13.1. Pricing Analysis

        17.13.2. Market Share Analysis, 2022

            17.13.2.1. By Component

            17.13.2.2. By Deployment

            17.13.2.3. By End User

            17.13.2.4. By Application

    17.14. China

        17.14.1. Pricing Analysis

        17.14.2. Market Share Analysis, 2022

            17.14.2.1. By Component

            17.14.2.2. By Deployment

            17.14.2.3. By End User

            17.14.2.4. By Application

    17.15. Japan

        17.15.1. Pricing Analysis

        17.15.2. Market Share Analysis, 2022

            17.15.2.1. By Component

            17.15.2.2. By Deployment

            17.15.2.3. By End User

            17.15.2.4. By Application

    17.16. South Korea

        17.16.1. Pricing Analysis

        17.16.2. Market Share Analysis, 2022

            17.16.2.1. By Component

            17.16.2.2. By Deployment

            17.16.2.3. By End User

            17.16.2.4. By Application

    17.17. Australia

        17.17.1. Pricing Analysis

        17.17.2. Market Share Analysis, 2022

            17.17.2.1. By Component

            17.17.2.2. By Deployment

            17.17.2.3. By End User

            17.17.2.4. By Application

    17.18. New Zealand

        17.18.1. Pricing Analysis

        17.18.2. Market Share Analysis, 2022

            17.18.2.1. By Component

            17.18.2.2. By Deployment

            17.18.2.3. By End User

            17.18.2.4. By Application

    17.19. GCC Countries

        17.19.1. Pricing Analysis

        17.19.2. Market Share Analysis, 2022

            17.19.2.1. By Component

            17.19.2.2. By Deployment

            17.19.2.3. By End User

            17.19.2.4. By Application

    17.20. South Africa

        17.20.1. Pricing Analysis

        17.20.2. Market Share Analysis, 2022

            17.20.2.1. By Component

            17.20.2.2. By Deployment

            17.20.2.3. By End User

            17.20.2.4. By Application

    17.21. Israel

        17.21.1. Pricing Analysis

        17.21.2. Market Share Analysis, 2022

            17.21.2.1. By Component

            17.21.2.2. By Deployment

            17.21.2.3. By End User

            17.21.2.4. By Application

18. Market Structure Analysis

    18.1. Competition Dashboard

    18.2. Competition Benchmarking

    18.3. Market Share Analysis of Top Players

        18.3.1. By Regional

        18.3.2. By Component

        18.3.3. By Deployment

        18.3.4. By End User

        18.3.5. By Application

19. Competition Analysis

    19.1. Competition Deep Dive

        19.1.1. Oracle

            19.1.1.1. Overview

            19.1.1.2. Product Portfolio

            19.1.1.3. Profitability by Market Segments

            19.1.1.4. Sales Footprint

            19.1.1.5. Strategy Overview

                19.1.1.5.1. Marketing Strategy

        19.1.2. IBM

            19.1.2.1. Overview

            19.1.2.2. Product Portfolio

            19.1.2.3. Profitability by Market Segments

            19.1.2.4. Sales Footprint

            19.1.2.5. Strategy Overview

                19.1.2.5.1. Marketing Strategy

        19.1.3. SAS

            19.1.3.1. Overview

            19.1.3.2. Product Portfolio

            19.1.3.3. Profitability by Market Segments

            19.1.3.4. Sales Footprint

            19.1.3.5. Strategy Overview

                19.1.3.5.1. Marketing Strategy

        19.1.4. Allscripts Healthcare Solutions Inc.

            19.1.4.1. Overview

            19.1.4.2. Product Portfolio

            19.1.4.3. Profitability by Market Segments

            19.1.4.4. Sales Footprint

            19.1.4.5. Strategy Overview

                19.1.4.5.1. Marketing Strategy

        19.1.5. Medeanalytics, Inc.

            19.1.5.1. Overview

            19.1.5.2. Product Portfolio

            19.1.5.3. Profitability by Market Segments

            19.1.5.4. Sales Footprint

            19.1.5.5. Strategy Overview

                19.1.5.5.1. Marketing Strategy

        19.1.6. Health Catalyst

            19.1.6.1. Overview

            19.1.6.2. Product Portfolio

            19.1.6.3. Profitability by Market Segments

            19.1.6.4. Sales Footprint

            19.1.6.5. Strategy Overview

                19.1.6.5.1. Marketing Strategy

        19.1.7. Apixio Inc.

            19.1.7.1. Overview

            19.1.7.2. Product Portfolio

            19.1.7.3. Profitability by Market Segments

            19.1.7.4. Sales Footprint

            19.1.7.5. Strategy Overview

                19.1.7.5.1. Marketing Strategy

        19.1.8. Optum, Inc.

            19.1.8.1. Overview

            19.1.8.2. Product Portfolio

            19.1.8.3. Profitability by Market Segments

            19.1.8.4. Sales Footprint

            19.1.8.5. Strategy Overview

                19.1.8.5.1. Marketing Strategy

        19.1.9. Mckesson Corporation

            19.1.9.1. Overview

            19.1.9.2. Product Portfolio

            19.1.9.3. Profitability by Market Segments

            19.1.9.4. Sales Footprint

            19.1.9.5. Strategy Overview

                19.1.9.5.1. Marketing Strategy

        19.1.10. Cerner Corporation

            19.1.10.1. Overview

            19.1.10.2. Product Portfolio

            19.1.10.3. Profitability by Market Segments

            19.1.10.4. Sales Footprint

            19.1.10.5. Strategy Overview

                19.1.10.5.1. Marketing Strategy

20. Assumptions & Acronyms Used

21. Research Methodology

List of Tables

Table 1: Global Market Value (US$ Million) Forecast by Region, 2018 to 2033

Table 2: Global Market Value (US$ Million) Forecast by Component, 2018 to 2033

Table 3: Global Market Value (US$ Million) Forecast by Deployment, 2018 to 2033

Table 4: Global Market Value (US$ Million) Forecast by End User, 2018 to 2033

Table 5: Global Market Value (US$ Million) Forecast by Application, 2018 to 2033

Table 6: North America Market Value (US$ Million) Forecast by Country, 2018 to 2033

Table 7: North America Market Value (US$ Million) Forecast by Component, 2018 to 2033

Table 8: North America Market Value (US$ Million) Forecast by Deployment, 2018 to 2033

Table 9: North America Market Value (US$ Million) Forecast by End User, 2018 to 2033

Table 10: North America Market Value (US$ Million) Forecast by Application, 2018 to 2033

Table 11: Latin America Market Value (US$ Million) Forecast by Country, 2018 to 2033

Table 12: Latin America Market Value (US$ Million) Forecast by Component, 2018 to 2033

Table 13: Latin America Market Value (US$ Million) Forecast by Deployment, 2018 to 2033

Table 14: Latin America Market Value (US$ Million) Forecast by End User, 2018 to 2033

Table 15: Latin America Market Value (US$ Million) Forecast by Application, 2018 to 2033

Table 16: Europe Market Value (US$ Million) Forecast by Country, 2018 to 2033

Table 17: Europe Market Value (US$ Million) Forecast by Component, 2018 to 2033

Table 18: Europe Market Value (US$ Million) Forecast by Deployment, 2018 to 2033

Table 19: Europe Market Value (US$ Million) Forecast by End User, 2018 to 2033

Table 20: Europe Market Value (US$ Million) Forecast by Application, 2018 to 2033

Table 21: South Asia Market Value (US$ Million) Forecast by Country, 2018 to 2033

Table 22: South Asia Market Value (US$ Million) Forecast by Component, 2018 to 2033

Table 23: South Asia Market Value (US$ Million) Forecast by Deployment, 2018 to 2033

Table 24: South Asia Market Value (US$ Million) Forecast by End User, 2018 to 2033

Table 25: South Asia Market Value (US$ Million) Forecast by Application, 2018 to 2033

Table 26: East Asia Market Value (US$ Million) Forecast by Country, 2018 to 2033

Table 27: East Asia Market Value (US$ Million) Forecast by Component, 2018 to 2033

Table 28: East Asia Market Value (US$ Million) Forecast by Deployment, 2018 to 2033

Table 29: East Asia Market Value (US$ Million) Forecast by End User, 2018 to 2033

Table 30: East Asia Market Value (US$ Million) Forecast by Application, 2018 to 2033

Table 31: Oceania Market Value (US$ Million) Forecast by Country, 2018 to 2033

Table 32: Oceania Market Value (US$ Million) Forecast by Component, 2018 to 2033

Table 33: Oceania Market Value (US$ Million) Forecast by Deployment, 2018 to 2033

Table 34: Oceania Market Value (US$ Million) Forecast by End User, 2018 to 2033

Table 35: Oceania Market Value (US$ Million) Forecast by Application, 2018 to 2033

Table 36: MEA Market Value (US$ Million) Forecast by Country, 2018 to 2033

Table 37: MEA Market Value (US$ Million) Forecast by Component, 2018 to 2033

Table 38: MEA Market Value (US$ Million) Forecast by Deployment, 2018 to 2033

Table 39: MEA Market Value (US$ Million) Forecast by End User, 2018 to 2033

Table 40: MEA Market Value (US$ Million) Forecast by Application, 2018 to 2033

List of Charts

Figure 1: Global Market Value (US$ Million) by Component, 2023 to 2033

Figure 2: Global Market Value (US$ Million) by Deployment, 2023 to 2033

Figure 3: Global Market Value (US$ Million) by End User, 2023 to 2033

Figure 4: Global Market Value (US$ Million) by Application, 2023 to 2033

Figure 5: Global Market Value (US$ Million) by Region, 2023 to 2033

Figure 6: Global Market Value (US$ Million) Analysis by Region, 2018 to 2033

Figure 7: Global Market Value Share (%) and BPS Analysis by Region, 2023 to 2033

Figure 8: Global Market Y-o-Y Growth (%) Projections by Region, 2023 to 2033

Figure 9: Global Market Value (US$ Million) Analysis by Component, 2018 to 2033

Figure 10: Global Market Value Share (%) and BPS Analysis by Component, 2023 to 2033

Figure 11: Global Market Y-o-Y Growth (%) Projections by Component, 2023 to 2033

Figure 12: Global Market Value (US$ Million) Analysis by Deployment, 2018 to 2033

Figure 13: Global Market Value Share (%) and BPS Analysis by Deployment, 2023 to 2033

Figure 14: Global Market Y-o-Y Growth (%) Projections by Deployment, 2023 to 2033

Figure 15: Global Market Value (US$ Million) Analysis by End User, 2018 to 2033

Figure 16: Global Market Value Share (%) and BPS Analysis by End User, 2023 to 2033

Figure 17: Global Market Y-o-Y Growth (%) Projections by End User, 2023 to 2033

Figure 18: Global Market Value (US$ Million) Analysis by Application, 2018 to 2033

Figure 19: Global Market Value Share (%) and BPS Analysis by Application, 2023 to 2033

Figure 20: Global Market Y-o-Y Growth (%) Projections by Application, 2023 to 2033

Figure 21: Global Market Attractiveness by Component, 2023 to 2033

Figure 22: Global Market Attractiveness by Deployment, 2023 to 2033

Figure 23: Global Market Attractiveness by End User, 2023 to 2033

Figure 24: Global Market Attractiveness by Application, 2023 to 2033

Figure 25: Global Market Attractiveness by Region, 2023 to 2033

Figure 26: North America Market Value (US$ Million) by Component, 2023 to 2033

Figure 27: North America Market Value (US$ Million) by Deployment, 2023 to 2033

Figure 28: North America Market Value (US$ Million) by End User, 2023 to 2033

Figure 29: North America Market Value (US$ Million) by Application, 2023 to 2033

Figure 30: North America Market Value (US$ Million) by Country, 2023 to 2033

Figure 31: North America Market Value (US$ Million) Analysis by Country, 2018 to 2033

Figure 32: North America Market Value Share (%) and BPS Analysis by Country, 2023 to 2033

Figure 33: North America Market Y-o-Y Growth (%) Projections by Country, 2023 to 2033

Figure 34: North America Market Value (US$ Million) Analysis by Component, 2018 to 2033

Figure 35: North America Market Value Share (%) and BPS Analysis by Component, 2023 to 2033

Figure 36: North America Market Y-o-Y Growth (%) Projections by Component, 2023 to 2033

Figure 37: North America Market Value (US$ Million) Analysis by Deployment, 2018 to 2033

Figure 38: North America Market Value Share (%) and BPS Analysis by Deployment, 2023 to 2033

Figure 39: North America Market Y-o-Y Growth (%) Projections by Deployment, 2023 to 2033

Figure 40: North America Market Value (US$ Million) Analysis by End User, 2018 to 2033

Figure 41: North America Market Value Share (%) and BPS Analysis by End User, 2023 to 2033

Figure 42: North America Market Y-o-Y Growth (%) Projections by End User, 2023 to 2033

Figure 43: North America Market Value (US$ Million) Analysis by Application, 2018 to 2033

Figure 44: North America Market Value Share (%) and BPS Analysis by Application, 2023 to 2033

Figure 45: North America Market Y-o-Y Growth (%) Projections by Application, 2023 to 2033

Figure 46: North America Market Attractiveness by Component, 2023 to 2033

Figure 47: North America Market Attractiveness by Deployment, 2023 to 2033

Figure 48: North America Market Attractiveness by End User, 2023 to 2033

Figure 49: North America Market Attractiveness by Application, 2023 to 2033

Figure 50: North America Market Attractiveness by Country, 2023 to 2033

Figure 51: Latin America Market Value (US$ Million) by Component, 2023 to 2033

Figure 52: Latin America Market Value (US$ Million) by Deployment, 2023 to 2033

Figure 53: Latin America Market Value (US$ Million) by End User, 2023 to 2033

Figure 54: Latin America Market Value (US$ Million) by Application, 2023 to 2033

Figure 55: Latin America Market Value (US$ Million) by Country, 2023 to 2033

Figure 56: Latin America Market Value (US$ Million) Analysis by Country, 2018 to 2033

Figure 57: Latin America Market Value Share (%) and BPS Analysis by Country, 2023 to 2033

Figure 58: Latin America Market Y-o-Y Growth (%) Projections by Country, 2023 to 2033

Figure 59: Latin America Market Value (US$ Million) Analysis by Component, 2018 to 2033

Figure 60: Latin America Market Value Share (%) and BPS Analysis by Component, 2023 to 2033

Figure 61: Latin America Market Y-o-Y Growth (%) Projections by Component, 2023 to 2033

Figure 62: Latin America Market Value (US$ Million) Analysis by Deployment, 2018 to 2033

Figure 63: Latin America Market Value Share (%) and BPS Analysis by Deployment, 2023 to 2033

Figure 64: Latin America Market Y-o-Y Growth (%) Projections by Deployment, 2023 to 2033

Figure 65: Latin America Market Value (US$ Million) Analysis by End User, 2018 to 2033

Figure 66: Latin America Market Value Share (%) and BPS Analysis by End User, 2023 to 2033

Figure 67: Latin America Market Y-o-Y Growth (%) Projections by End User, 2023 to 2033

Figure 68: Latin America Market Value (US$ Million) Analysis by Application, 2018 to 2033

Figure 69: Latin America Market Value Share (%) and BPS Analysis by Application, 2023 to 2033

Figure 70: Latin America Market Y-o-Y Growth (%) Projections by Application, 2023 to 2033

Figure 71: Latin America Market Attractiveness by Component, 2023 to 2033

Figure 72: Latin America Market Attractiveness by Deployment, 2023 to 2033

Figure 73: Latin America Market Attractiveness by End User, 2023 to 2033

Figure 74: Latin America Market Attractiveness by Application, 2023 to 2033

Figure 75: Latin America Market Attractiveness by Country, 2023 to 2033

Figure 76: Europe Market Value (US$ Million) by Component, 2023 to 2033

Figure 77: Europe Market Value (US$ Million) by Deployment, 2023 to 2033

Figure 78: Europe Market Value (US$ Million) by End User, 2023 to 2033

Figure 79: Europe Market Value (US$ Million) by Application, 2023 to 2033

Figure 80: Europe Market Value (US$ Million) by Country, 2023 to 2033

Figure 81: Europe Market Value (US$ Million) Analysis by Country, 2018 to 2033

Figure 82: Europe Market Value Share (%) and BPS Analysis by Country, 2023 to 2033

Figure 83: Europe Market Y-o-Y Growth (%) Projections by Country, 2023 to 2033

Figure 84: Europe Market Value (US$ Million) Analysis by Component, 2018 to 2033

Figure 85: Europe Market Value Share (%) and BPS Analysis by Component, 2023 to 2033

Figure 86: Europe Market Y-o-Y Growth (%) Projections by Component, 2023 to 2033

Figure 87: Europe Market Value (US$ Million) Analysis by Deployment, 2018 to 2033

Figure 88: Europe Market Value Share (%) and BPS Analysis by Deployment, 2023 to 2033

Figure 89: Europe Market Y-o-Y Growth (%) Projections by Deployment, 2023 to 2033

Figure 90: Europe Market Value (US$ Million) Analysis by End User, 2018 to 2033

Figure 91: Europe Market Value Share (%) and BPS Analysis by End User, 2023 to 2033

Figure 92: Europe Market Y-o-Y Growth (%) Projections by End User, 2023 to 2033

Figure 93: Europe Market Value (US$ Million) Analysis by Application, 2018 to 2033

Figure 94: Europe Market Value Share (%) and BPS Analysis by Application, 2023 to 2033

Figure 95: Europe Market Y-o-Y Growth (%) Projections by Application, 2023 to 2033

Figure 96: Europe Market Attractiveness by Component, 2023 to 2033

Figure 97: Europe Market Attractiveness by Deployment, 2023 to 2033

Figure 98: Europe Market Attractiveness by End User, 2023 to 2033

Figure 99: Europe Market Attractiveness by Application, 2023 to 2033

Figure 100: Europe Market Attractiveness by Country, 2023 to 2033

Figure 101: South Asia Market Value (US$ Million) by Component, 2023 to 2033

Figure 102: South Asia Market Value (US$ Million) by Deployment, 2023 to 2033

Figure 103: South Asia Market Value (US$ Million) by End User, 2023 to 2033

Figure 104: South Asia Market Value (US$ Million) by Application, 2023 to 2033

Figure 105: South Asia Market Value (US$ Million) by Country, 2023 to 2033

Figure 106: South Asia Market Value (US$ Million) Analysis by Country, 2018 to 2033

Figure 107: South Asia Market Value Share (%) and BPS Analysis by Country, 2023 to 2033

Figure 108: South Asia Market Y-o-Y Growth (%) Projections by Country, 2023 to 2033

Figure 109: South Asia Market Value (US$ Million) Analysis by Component, 2018 to 2033

Figure 110: South Asia Market Value Share (%) and BPS Analysis by Component, 2023 to 2033

Figure 111: South Asia Market Y-o-Y Growth (%) Projections by Component, 2023 to 2033

Figure 112: South Asia Market Value (US$ Million) Analysis by Deployment, 2018 to 2033

Figure 113: South Asia Market Value Share (%) and BPS Analysis by Deployment, 2023 to 2033

Figure 114: South Asia Market Y-o-Y Growth (%) Projections by Deployment, 2023 to 2033

Figure 115: South Asia Market Value (US$ Million) Analysis by End User, 2018 to 2033

Figure 116: South Asia Market Value Share (%) and BPS Analysis by End User, 2023 to 2033

Figure 117: South Asia Market Y-o-Y Growth (%) Projections by End User, 2023 to 2033

Figure 118: South Asia Market Value (US$ Million) Analysis by Application, 2018 to 2033

Figure 119: South Asia Market Value Share (%) and BPS Analysis by Application, 2023 to 2033

Figure 120: South Asia Market Y-o-Y Growth (%) Projections by Application, 2023 to 2033

Figure 121: South Asia Market Attractiveness by Component, 2023 to 2033

Figure 122: South Asia Market Attractiveness by Deployment, 2023 to 2033

Figure 123: South Asia Market Attractiveness by End User, 2023 to 2033

Figure 124: South Asia Market Attractiveness by Application, 2023 to 2033

Figure 125: South Asia Market Attractiveness by Country, 2023 to 2033

Figure 126: East Asia Market Value (US$ Million) by Component, 2023 to 2033

Figure 127: East Asia Market Value (US$ Million) by Deployment, 2023 to 2033

Figure 128: East Asia Market Value (US$ Million) by End User, 2023 to 2033

Figure 129: East Asia Market Value (US$ Million) by Application, 2023 to 2033

Figure 130: East Asia Market Value (US$ Million) by Country, 2023 to 2033

Figure 131: East Asia Market Value (US$ Million) Analysis by Country, 2018 to 2033

Figure 132: East Asia Market Value Share (%) and BPS Analysis by Country, 2023 to 2033

Figure 133: East Asia Market Y-o-Y Growth (%) Projections by Country, 2023 to 2033

Figure 134: East Asia Market Value (US$ Million) Analysis by Component, 2018 to 2033

Figure 135: East Asia Market Value Share (%) and BPS Analysis by Component, 2023 to 2033

Figure 136: East Asia Market Y-o-Y Growth (%) Projections by Component, 2023 to 2033

Figure 137: East Asia Market Value (US$ Million) Analysis by Deployment, 2018 to 2033

Figure 138: East Asia Market Value Share (%) and BPS Analysis by Deployment, 2023 to 2033

Figure 139: East Asia Market Y-o-Y Growth (%) Projections by Deployment, 2023 to 2033

Figure 140: East Asia Market Value (US$ Million) Analysis by End User, 2018 to 2033

Figure 141: East Asia Market Value Share (%) and BPS Analysis by End User, 2023 to 2033

Figure 142: East Asia Market Y-o-Y Growth (%) Projections by End User, 2023 to 2033

Figure 143: East Asia Market Value (US$ Million) Analysis by Application, 2018 to 2033

Figure 144: East Asia Market Value Share (%) and BPS Analysis by Application, 2023 to 2033

Figure 145: East Asia Market Y-o-Y Growth (%) Projections by Application, 2023 to 2033

Figure 146: East Asia Market Attractiveness by Component, 2023 to 2033

Figure 147: East Asia Market Attractiveness by Deployment, 2023 to 2033

Figure 148: East Asia Market Attractiveness by End User, 2023 to 2033

Figure 149: East Asia Market Attractiveness by Application, 2023 to 2033

Figure 150: East Asia Market Attractiveness by Country, 2023 to 2033

Figure 151: Oceania Market Value (US$ Million) by Component, 2023 to 2033

Figure 152: Oceania Market Value (US$ Million) by Deployment, 2023 to 2033

Figure 153: Oceania Market Value (US$ Million) by End User, 2023 to 2033

Figure 154: Oceania Market Value (US$ Million) by Application, 2023 to 2033

Figure 155: Oceania Market Value (US$ Million) by Country, 2023 to 2033

Figure 156: Oceania Market Value (US$ Million) Analysis by Country, 2018 to 2033

Figure 157: Oceania Market Value Share (%) and BPS Analysis by Country, 2023 to 2033

Figure 158: Oceania Market Y-o-Y Growth (%) Projections by Country, 2023 to 2033

Figure 159: Oceania Market Value (US$ Million) Analysis by Component, 2018 to 2033

Figure 160: Oceania Market Value Share (%) and BPS Analysis by Component, 2023 to 2033

Figure 161: Oceania Market Y-o-Y Growth (%) Projections by Component, 2023 to 2033

Figure 162: Oceania Market Value (US$ Million) Analysis by Deployment, 2018 to 2033

Figure 163: Oceania Market Value Share (%) and BPS Analysis by Deployment, 2023 to 2033

Figure 164: Oceania Market Y-o-Y Growth (%) Projections by Deployment, 2023 to 2033

Figure 165: Oceania Market Value (US$ Million) Analysis by End User, 2018 to 2033

Figure 166: Oceania Market Value Share (%) and BPS Analysis by End User, 2023 to 2033

Figure 167: Oceania Market Y-o-Y Growth (%) Projections by End User, 2023 to 2033

Figure 168: Oceania Market Value (US$ Million) Analysis by Application, 2018 to 2033

Figure 169: Oceania Market Value Share (%) and BPS Analysis by Application, 2023 to 2033

Figure 170: Oceania Market Y-o-Y Growth (%) Projections by Application, 2023 to 2033

Figure 171: Oceania Market Attractiveness by Component, 2023 to 2033

Figure 172: Oceania Market Attractiveness by Deployment, 2023 to 2033

Figure 173: Oceania Market Attractiveness by End User, 2023 to 2033

Figure 174: Oceania Market Attractiveness by Application, 2023 to 2033

Figure 175: Oceania Market Attractiveness by Country, 2023 to 2033

Figure 176: MEA Market Value (US$ Million) by Component, 2023 to 2033

Figure 177: MEA Market Value (US$ Million) by Deployment, 2023 to 2033

Figure 178: MEA Market Value (US$ Million) by End User, 2023 to 2033

Figure 179: MEA Market Value (US$ Million) by Application, 2023 to 2033

Figure 180: MEA Market Value (US$ Million) by Country, 2023 to 2033

Figure 181: MEA Market Value (US$ Million) Analysis by Country, 2018 to 2033

Figure 182: MEA Market Value Share (%) and BPS Analysis by Country, 2023 to 2033

Figure 183: MEA Market Y-o-Y Growth (%) Projections by Country, 2023 to 2033

Figure 184: MEA Market Value (US$ Million) Analysis by Component, 2018 to 2033

Figure 185: MEA Market Value Share (%) and BPS Analysis by Component, 2023 to 2033

Figure 186: MEA Market Y-o-Y Growth (%) Projections by Component, 2023 to 2033

Figure 187: MEA Market Value (US$ Million) Analysis by Deployment, 2018 to 2033

Figure 188: MEA Market Value Share (%) and BPS Analysis by Deployment, 2023 to 2033

Figure 189: MEA Market Y-o-Y Growth (%) Projections by Deployment, 2023 to 2033

Figure 190: MEA Market Value (US$ Million) Analysis by End User, 2018 to 2033

Figure 191: MEA Market Value Share (%) and BPS Analysis by End User, 2023 to 2033

Figure 192: MEA Market Y-o-Y Growth (%) Projections by End User, 2023 to 2033

Figure 193: MEA Market Value (US$ Million) Analysis by Application, 2018 to 2033

Figure 194: MEA Market Value Share (%) and BPS Analysis by Application, 2023 to 2033

Figure 195: MEA Market Y-o-Y Growth (%) Projections by Application, 2023 to 2033

Figure 196: MEA Market Attractiveness by Component, 2023 to 2033

Figure 197: MEA Market Attractiveness by Deployment, 2023 to 2033

Figure 198: MEA Market Attractiveness by End User, 2023 to 2033

Figure 199: MEA Market Attractiveness by Application, 2023 to 2033

Figure 200: MEA Market Attractiveness by Country, 2023 to 2033

Recommendations

Technology

Predictive Touch Market

Published : October 2022

Technology

Predictive Analytics Market

Published : June 2022

Explore Healthcare Insights

View Reports

Predictive Disease Analytics Market