Reports

- Global Locations -

Headquarters

Future Market Insights, Inc.

Christiana Corporate, 200
Continental Drive, Suite 401,
Newark, Delaware - 19713,
United States

T: +1-845-579-5705

Americas

Future Market Insights, Inc.

616 Corporate Way, Suite 2-9018,
Valley Cottage, NY 10989, United States

T: +1-347-918-3531

MEA

Future Market Insights

1602-6 Jumeirah Bay X2 Tower, Plot No: JLT-PH2-X2A,
Jumeirah Lakes Towers, Dubai,
United Arab Emirates

Europe

Future Market Insights

3rd Floor, 207 Regent Street,
W1B 3HH London
United Kingdom

T: + 44 (0) 20 8123 9659
D: +44 (0) 20 3287 4268

Asia Pacific

Future Market Insights

IndiaLand Global Tech Park, Unit UG-1, Behind Grand HighStreet, Phase 1, Hinjawadi, MH, Pune – 411057, India

Airway Disease Treatment Market Outlook (2022 to 2032)

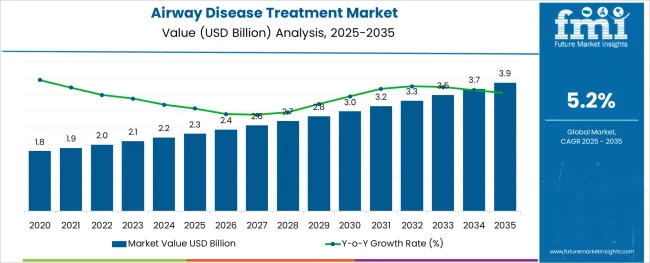
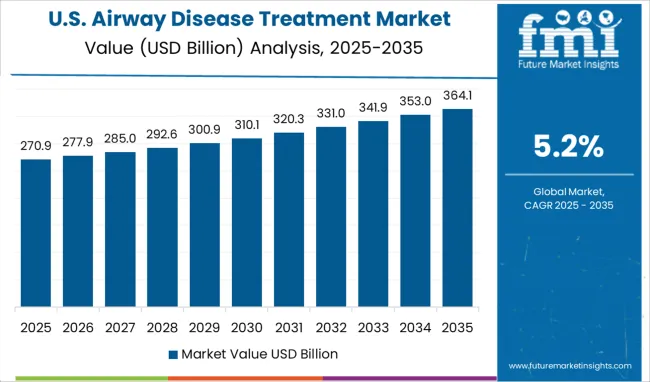
The global airway disease treatment market is expected to generate US$ 3,495.3 Million in revenue by 2032, up from US$ 1,996.1 Million in 2022, with a CAGR of 5.2% over the forecast period. The steady growth in the market is owing to:

  • An increase in focus on smart or digital inhalers for administering medications for COPD or asthma.
  • Combination therapies are more often used since they are more efficient than using a bronchodilator and a corticosteroid separately. In addition, more individuals are now being effectively treated with combination treatment.
  • The use of combination medications for airway disease treatment including asthma and COPD has received regulatory approval from organizations like the FDA, the European Commission, and the Ministry of Health, Labor, and Welfare (MHLW).
  • The expanding population is a key contributor to the increase in air pollutants, which harm human health and causes a variety of respiratory illnesses.
Report Attribute Details
Airway Disease Treatment Market Value (2022) US$ 1,996.1 Million
Airway Disease Treatment Market Anticipated Forecast Value (2032) US$ 3,495.3 Million
Airway Disease Treatment Market Projected Growth Rate (2022 to 2032) 5.2%

Don't pay for what you don't need

Customize your report by selecting specific countries or regions and save 30%!

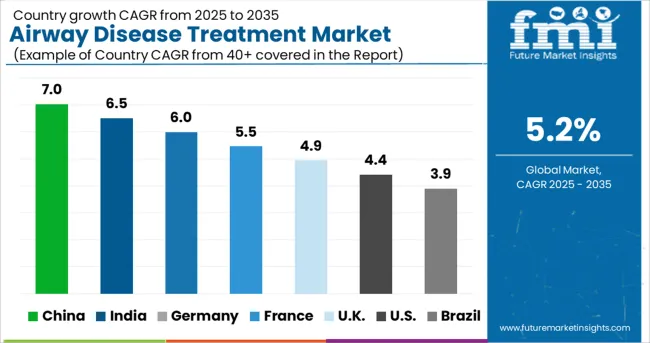
China and Japan to Dominate Asia Pacific Airway Disease Treatment Market

During the projection period, the Asia Pacific market is expected to grow at a faster rate. The growing presence of major products in the region is expected to fuel demand for asthma medications between 2022 and 2032. Due to the existence of major players, China and Japan are projected to provide considerable potential in the market. For example, the rise of Pulmicort, a crucial asthma medicine, in the area has been driven by a favorable performance in China.

This factor, together with the availability of a huge and underserved market in the region, is expected to fuel market expansion in the Asia Pacific throughout the projection period. The rest of the international market, which includes Latin America, the Middle East, and Africa, is still in its infancy. However, it is anticipated that throughout the projection period, rising chronic respiratory illness incidence and rising product introductions, especially effective generic asthma treatments, are likely to drive demand for airway disease treatments.

Globally, growing nations are opening up significant potential in the market for the treatment of respiratory disorders due to the high incidence of respiratory illnesses, increased accessibility to high-quality healthcare services, and expansion of the pharmaceutical sector. The market for airway disease treatment has numerous growth opportunities due to the quick uptake of new technology and a surge in innovation.

Opportunities and Challenges for Airway Disease Treatment Market Players

During the drug development phase, pharmaceutical companies devote a significant amount of both monetary and non-monetary resources. The companies are completely in charge of the drug's manufacture and manufacturing while they have the patents for it. The original pharmaceutical producer suffers significant losses as a result of generic drug manufacturers using the formula to produce their versions of the medications, which poses a difficult situation for the expansion of the global market.

As these businesses are positioned to acquire market share throughout the forecast period through the increased sales of their product offerings, this is anticipated to have a favorable influence on the airway disease treatment market growth.

Sabyasachi Ghosh
Sabyasachi Ghosh

Principal Consultant

Talk to Analyst

Find your sweet spots for generating winning opportunities in this market.

Competition Analysis of Airway Disease Treatment Market

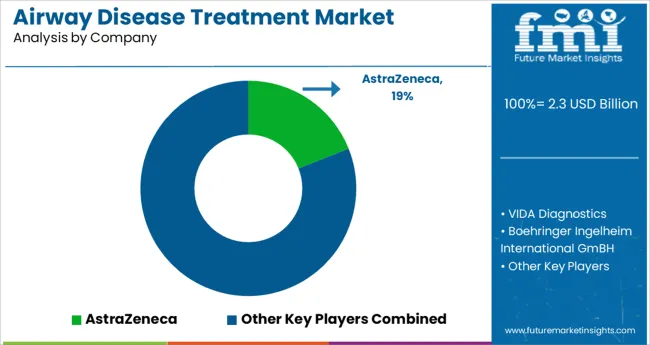
The market's competitive landscape shows a monopoly market structure with a large number of enterprises present. Due to the strength of their products in terms of asthma medications, two companies, AstraZeneca and GlaxoSmithKline dominated this industry.

The most notable products for GlaxoSmithKline were Advair and Flovent HFA/Flovent Diskus. These are the key elements that have contributed significantly to these firms' leading market positions. However, there are other well-known market participants, like Merck and Teva, which have sizable market revenue shares in the international market.

A generic asthma medication called fluticasone propionate and salmeterol inhalation powder, which is intended for the treatment of both asthma and chronic obstructive pulmonary disease, has completed phase III clinical research, according to Cipla Inc. (COPD). This potential possibility is the 100/50 mcg generic version of Advair Diskus.

Among the medications used in combination therapy for COPD are LABA-ICS, LAMA-ICS, triple therapy, and other similar drugs. Due to its superior efficacy over using a bronchodilator and a corticosteroid separately, combination therapy is becoming more popular, propelling the demand for airway disease treatment.

The airway disease treatment market growth is likely to augment owing to a rise in the number of patients who are successfully treated with combination therapy but who were not responding to bronchodilators or corticosteroid treatments. In addition, the adoption of airway disease treatment soars as the symptoms and quality of life of patients with chronic obstructive pulmonary disease can be improved more successfully with combination therapy than with monotherapy.

Combination therapy has also gained traction on account of recent regulatory approvals and a rise in the success rate of the treatment for COPD, aiding the overall market. Furthermore, the development of cutting-edge therapeutics for asthma by major market players is one of the critical factors holding sway over the airway disease treatment market trends and forecasts.

The adoption of airway disease treatment is facilitated by market characteristics such as solid and robust Research and Development efforts. One of the significant airway disease treatment market trends is the involvement of well-known pharmaceutical companies in the development of asthma medications, as asthma is a chronic disease that affects a sizable number of patients worldwide.

As part of this involvement, several promising asthma treatment candidates are currently undergoing various stages of clinical trials, influencing airway disease treatment adoption trends. For instance, in September 2019, Novartis released encouraging data from the phase III IRIDIUM study of the inhaled combination QVM149 in patients with uncontrolled asthma.

What Are The Key Airway Disease Treatment Market Dynamics?

On account of the rising prevalence of respiratory diseases such as asthma, cystic fibrosis, and COPD across the world, the demand for airway disease treatment is expected to skyrocket to a considerable extent. And the same can be primarily owed to the highly susceptible elderly people to respiratory diseases (COPD, asthma, emphysema) due to reduced immunity and blood flow.

Furthermore, the airway disease treatment market's key trends & opportunities are shaped by the introduction of advanced imaging technologies such as digital radiography and computed radiography as they render high-quality digital images.

Digital imaging systems have witnessed a low adoption rate as these are more expensive than analog imaging systems, dwindling the overall airway disease treatment market size during the forecast period. Since the pandemic and asthma are closely related to respiratory illnesses, there is an increased need for various types of asthma treatment medications, in turn, spiking the demand for airway disease treatment.

Due to rising demand and adoption of airway disease treatment, the USA FDA has granted priority regulatory approvals to several asthma medications, including important generic alternatives.

A key generic asthma treatment drug from Cipla, for example, received regulatory approval from the USA FDA in April 2020. Lupin is also expected to receive regulatory approval for a generic version of the same medication, auguring well for the airway disease treatment market's future trends.

The market is also positively impacted by the surging release of products with significant capability from well-known companies as a result of such developments and trends. Further efforts are made to prevent significant shortages of asthma medications by launching an increasing number of products.
Get the data you need at a Fraction of the cost

Personalize your report by choosing insights you need
and save 40%!

Why Is North America Likely To Lead The Airway Disease Treatment Market?

Geographically, North America is anticipated to hold a major chunk of the airway disease treatment market share accounting for 38.1% in 2022.

The dominance of North America can be attributed to the rising incidence of respiratory diseases, the popularity of portable electronics, and the rising need for equipment and services for in-home medical care.

According to the American Lung Association, COPD is the third most common cause of death in the country. Additionally, a growing need for cutting-edge and inventive products in medical facilities, diagnostic labs, and outpatient ambulatory surgery centers would drive market expansion in the region.

What Is The Growth Outlook For The Airway Disease Treatment Market?

Europe holds second place in the market for treatments for airway disease, projected to dominate a market share of 22.5% in 2022.

The region's market is being driven by a well-established healthcare system and an increase in the prevalence of chronic obstructive pulmonary disease and Asthma is the most common issue among children.

A number of technological advancements in respiratory diagnostic testing have paved the way for the market's expansion, including the use of artificial intelligence and the Internet of things (IoT), among other things.

How Is The Start-up Ecosystem In The Airway Disease Treatment Market?

A US-based start-up, Altavant Sciences, is advancing therapies for managing rare respiratory diseases. The company's lead drug candidate, rodaristat ethyl, is a small molecule inhibitor of tryptophan hydroxylase (TPH).

The medication reduces serotonin levels in conditions like PAH and idiopathic pulmonary fibrosis (IPF). The start-up is also working on medicines to treat bronchiolitis obliterans syndrome. Exvastat, a British start-up, creates a drug that is modified to treat acute respiratory distress syndrome (ARDS).

Imatinib, a medication used to treat chronic myeloid leukemia, is being reformulated by the start-up. The newly developed medication makes use of its capacity to obstruct vascular leak, a cause of pulmonary edema.
How Strong Is The Competition In The Airway Disease Treatment Market?

Currently, the global airway disease treatment market is highly competitive owing to the involvement of many established players.

Some of the key players in the global airway disease treatment market are Holaira, Inc., VIDA Diagnostics, Boehringer Ingelheim International GmBH, AstraZeneca, Teva Pharmaceuticals, GlaxoSmithKline and Novartis.

Some of the recent developments in the airway disease treatment market are:

  • Tudorza, also known as Eklira, and Duaklir distribution rights were sold by AstraZeneca for US$ 270 million to the Swiss pharmaceutical company Covis Pharma Group.

These medications are intended to treat chronic obstructive pulmonary disease (COPD).

  • The generic albuterol inhaler made by Cipla received regulatory approval from the USA FDA in response to the COVID-19 crisis-related shortages of asthma medications.

For people with asthma, this drug is frequently regarded as a last resort.

Report Scope

Report Attribute Details
Growth Rate CAGR of 5.2% from 2022 to 2032
Base Year for Estimation 2021
Historical Data 2016 to 2021
Forecast Period 2022 to 2032
Quantitative Units Revenue in USD Million and CAGR from 2022 to 2032
Report Coverage Revenue Forecast, Volume Forecast, Company Ranking, Competitive Landscape, Growth Factors, Trends, and Pricing Analysis
Segments Covered
  • Type
  • Treatment
  • End Use
  • Region
Regions Covered
  • North America
  • Latin America
  • Western Europe
  • Eastern Europe
  • Asia Pacific
  • Japan
  • The Middle East and Africa
Key Countries Profiled
  • United States of America
  • Canada
  • Brazil
  • Argentina
  • Germany
  • United Kingdom
  • France
  • Spain
  • Italy
  • Nordics
  • BENELUX
  • Australia & New Zealand
  • China
  • India
  • ASEAN
  • GCC Countries
  • South Africa
Key Companies Profiled
  • Holaira, Inc.
  • VIDA Diagnostics
  • Boehringer Ingelheim International GmBH
  • AstraZeneca
  • Teva Pharmaceuticals
  • GlaxoSmithKline
  • Novartis
Customization Available Upon Request

Key Segments Profiled In The Airway Disease Treatment Market Survey

By Type:

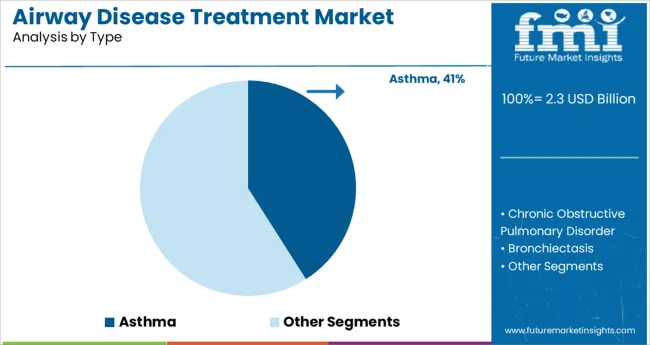
  • Asthma
  • Chronic Obstructive Pulmonary Disorder
  • Bronchiectasis

By Treatment:

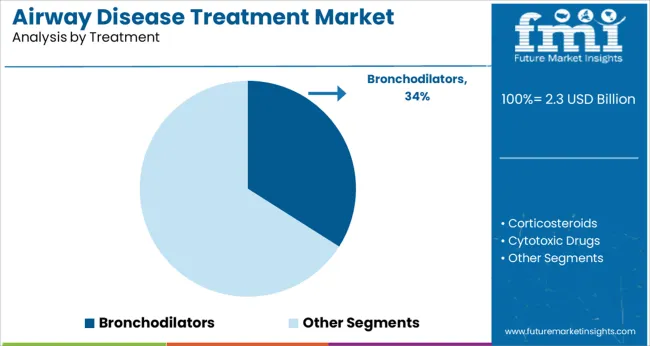
  • Bronchodilators
  • Corticosteroids
  • Cytotoxic Drugs
  • Oxygen Therapy
  • Antibiotics
  • Others

By End Use:

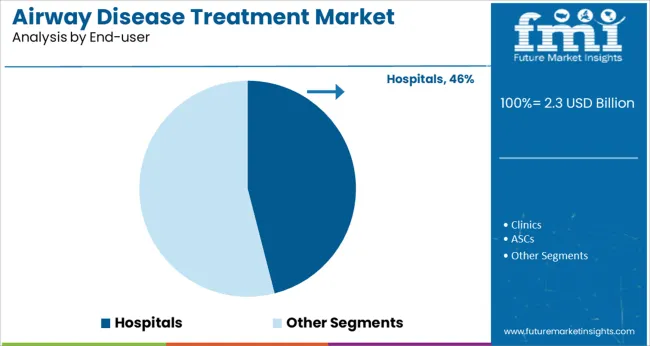
  • Hospitals
  • Clinics
  • ASCs
  • Rehabilitation Centres
  • Others

By Region:

  • North America
  • Latin America
  • Europe
  • Asia Pacific
  • Middle East and Africa

Frequently Asked Questions

What is the Growth Outlook for the Airway Disease Treatment Market?

The global airway disease treatment market is set to advance at a CAGR of 5.2% (2022 to 2032).

What is the Projected North America Airway Disease Treatment Market Share?

North America is likely to hold an airway disease treatment market share of 38.1% in 2022.

What is the Future of Airway Disease Treatment Market?

The airway disease treatment market is predicted to account for US$ 3,495.3 Million by 2032.

Table of Content

1. Executive Summary | Airway Disease Treatment Market

    1.1. Global Market Outlook

    1.2. Demand-side Trends

    1.3. Supply-side Trends

    1.4. Technology Roadmap Analysis

    1.5. Analysis and Recommendations

2. Market Overview

    2.1. Market Coverage / Taxonomy

    2.2. Market Definition / Scope / Limitations

3. Market Background

    3.1. Market Dynamics

        3.1.1. Drivers

        3.1.2. Restraints

        3.1.3. Opportunity

        3.1.4. Trends

    3.2. Scenario Forecast

        3.2.1. Demand in Optimistic Scenario

        3.2.2. Demand in Likely Scenario

        3.2.3. Demand in Conservative Scenario

    3.3. Opportunity Map Analysis

    3.4. Investment Feasibility Matrix

    3.5. PESTLE and Porter’s Analysis

    3.6. Regulatory Landscape

        3.6.1. By Key Regions

        3.6.2. By Key Countries

    3.7. Regional Parent Market Outlook

4. Global Market Analysis 2017 to 2021 and Forecast, 2022 to 2032

    4.1. Historical Market Size Value (US$ Million) Analysis, 2017 to 2021

    4.2. Current and Future Market Size Value (US$ Million) Projections, 2022 to 2032

        4.2.1. Y-o-Y Growth Trend Analysis

        4.2.2. Absolute $ Opportunity Analysis

5. Global Market Analysis 2017 to 2021 and Forecast 2022 to 2032, By Type

    5.1. Introduction / Key Findings

    5.2. Historical Market Size Value (US$ Million) Analysis By Type, 2017 to 2021

    5.3. Current and Future Market Size Value (US$ Million) Analysis and Forecast By Type, 2022 to 2032

        5.3.1. Asthma

        5.3.2. Chronic Obstructive Pulmonary Disorder

        5.3.3. Bronchiectasis

    5.4. Y-o-Y Growth Trend Analysis By Type, 2017 to 2021

    5.5. Absolute $ Opportunity Analysis By Type, 2022 to 2032

6. Global Market Analysis 2017 to 2021 and Forecast 2022 to 2032, By Treatment

    6.1. Introduction / Key Findings

    6.2. Historical Market Size Value (US$ Million) Analysis By Treatment, 2017 to 2021

    6.3. Current and Future Market Size Value (US$ Million) Analysis and Forecast By Treatment, 2022 to 2032

        6.3.1. Bronchodilators

        6.3.2. Corticosteroids

        6.3.3. Cytotoxic Drugs

        6.3.4. Oxygen Therapy

        6.3.5. Antibiotics

        6.3.6. Others

    6.4. Y-o-Y Growth Trend Analysis By Treatment, 2017 to 2021

    6.5. Absolute $ Opportunity Analysis By Treatment, 2022 to 2032

7. Global Market Analysis 2017 to 2021 and Forecast 2022 to 2032, By End-user

    7.1. Introduction / Key Findings

    7.2. Historical Market Size Value (US$ Million) Analysis By End-user, 2017 to 2021

    7.3. Current and Future Market Size Value (US$ Million) Analysis and Forecast By End-user, 2022 to 2032

        7.3.1. Hospitals

        7.3.2. Clinics

        7.3.3. ASCs

        7.3.4. Rehabilitation Centers

        7.3.5. Others

    7.4. Y-o-Y Growth Trend Analysis By End-user, 2017 to 2021

    7.5. Absolute $ Opportunity Analysis By End-user, 2022 to 2032

8. Global Market Analysis 2017 to 2021 and Forecast 2022 to 2032, By Region

    8.1. Introduction

    8.2. Historical Market Size Value (US$ Million) Analysis By Region, 2017 to 2021

    8.3. Current Market Size Value (US$ Million) Analysis and Forecast By Region, 2022 to 2032

        8.3.1. North America

        8.3.2. Latin America

        8.3.3. Europe

        8.3.4. Asia Pacific

        8.3.5. Middle East and Africa

    8.4. Market Attractiveness Analysis By Region

9. North America Market Analysis 2017 to 2021 and Forecast 2022 to 2032, By Country

    9.1. Historical Market Size Value (US$ Million) Trend Analysis By Market Taxonomy, 2017 to 2021

    9.2. Market Size Value (US$ Million) Forecast By Market Taxonomy, 2022 to 2032

        9.2.1. By Country

            9.2.1.1. United States of America

            9.2.1.2. Canada

        9.2.2. By Type

        9.2.3. By Treatment

        9.2.4. By End-user

    9.3. Market Attractiveness Analysis

        9.3.1. By Country

        9.3.2. By Type

        9.3.3. By Treatment

        9.3.4. By End-user

    9.4. Key Takeaways

10. Latin America Market Analysis 2017 to 2021 and Forecast 2022 to 2032, By Country

    10.1. Historical Market Size Value (US$ Million) Trend Analysis By Market Taxonomy, 2017 to 2021

    10.2. Market Size Value (US$ Million) Forecast By Market Taxonomy, 2022 to 2032

        10.2.1. By Country

            10.2.1.1. Brazil

            10.2.1.2. Mexico

            10.2.1.3. Rest of Latin America

        10.2.2. By Type

        10.2.3. By Treatment

        10.2.4. By End-user

    10.3. Market Attractiveness Analysis

        10.3.1. By Country

        10.3.2. By Type

        10.3.3. By Treatment

        10.3.4. By End-user

    10.4. Key Takeaways

11. Europe Market Analysis 2017 to 2021 and Forecast 2022 to 2032, By Country

    11.1. Historical Market Size Value (US$ Million) Trend Analysis By Market Taxonomy, 2017 to 2021

    11.2. Market Size Value (US$ Million) Forecast By Market Taxonomy, 2022 to 2032

        11.2.1. By Country

            11.2.1.1. Germany

            11.2.1.2. United Kingdom.

            11.2.1.3. France

            11.2.1.4. Spain

            11.2.1.5. Italy

            11.2.1.6. Rest of Europe

        11.2.2. By Type

        11.2.3. By Treatment

        11.2.4. By End-user

    11.3. Market Attractiveness Analysis

        11.3.1. By Country

        11.3.2. By Type

        11.3.3. By Treatment

        11.3.4. By End-user

    11.4. Key Takeaways

12. Asia Pacific Market Analysis 2017 to 2021 and Forecast 2022 to 2032, By Country

    12.1. Historical Market Size Value (US$ Million) Trend Analysis By Market Taxonomy, 2017 to 2021

    12.2. Market Size Value (US$ Million) Forecast By Market Taxonomy, 2022 to 2032

        12.2.1. By Country

            12.2.1.1. China

            12.2.1.2. Japan

            12.2.1.3. South Korea

            12.2.1.4. India

            12.2.1.5. Malaysia

            12.2.1.6. Singapore

            12.2.1.7. Australia

            12.2.1.8. New Zealand

            12.2.1.9. Rest of Asia-Pacific

        12.2.2. By Type

        12.2.3. By Treatment

        12.2.4. By End-user

    12.3. Market Attractiveness Analysis

        12.3.1. By Country

        12.3.2. By Type

        12.3.3. By Treatment

        12.3.4. By End-user

    12.4. Key Takeaways

13. Middle East and Africa Market Analysis 2017 to 2021 and Forecast 2022 to 2032, By Country

    13.1. Historical Market Size Value (US$ Million) Trend Analysis By Market Taxonomy, 2017 to 2021

    13.2. Market Size Value (US$ Million) Forecast By Market Taxonomy, 2022 to 2032

        13.2.1. By Country

            13.2.1.1. GCC Countries

            13.2.1.2. South Africa

            13.2.1.3. Israel

            13.2.1.4. Rest of Middle East and Africa

        13.2.2. By Type

        13.2.3. By Treatment

        13.2.4. By End-user

    13.3. Market Attractiveness Analysis

        13.3.1. By Country

        13.3.2. By Type

        13.3.3. By Treatment

        13.3.4. By End-user

    13.4. Key Takeaways

14. Key Countries Market Analysis

    14.1. United States of America

        14.1.1. Pricing Analysis

        14.1.2. Market Share Analysis, 2021

            14.1.2.1. By Type

            14.1.2.2. By Treatment

            14.1.2.3. By End-user

    14.2. Canada

        14.2.1. Pricing Analysis

        14.2.2. Market Share Analysis, 2021

            14.2.2.1. By Type

            14.2.2.2. By Treatment

            14.2.2.3. By End-user

    14.3. Brazil

        14.3.1. Pricing Analysis

        14.3.2. Market Share Analysis, 2021

            14.3.2.1. By Type

            14.3.2.2. By Treatment

            14.3.2.3. By End-user

    14.4. Mexico

        14.4.1. Pricing Analysis

        14.4.2. Market Share Analysis, 2021

            14.4.2.1. By Type

            14.4.2.2. By Treatment

            14.4.2.3. By End-user

    14.5. Germany

        14.5.1. Pricing Analysis

        14.5.2. Market Share Analysis, 2021

            14.5.2.1. By Type

            14.5.2.2. By Treatment

            14.5.2.3. By End-user

    14.6. United Kingdom.

        14.6.1. Pricing Analysis

        14.6.2. Market Share Analysis, 2021

            14.6.2.1. By Type

            14.6.2.2. By Treatment

            14.6.2.3. By End-user

    14.7. France

        14.7.1. Pricing Analysis

        14.7.2. Market Share Analysis, 2021

            14.7.2.1. By Type

            14.7.2.2. By Treatment

            14.7.2.3. By End-user

    14.8. Spain

        14.8.1. Pricing Analysis

        14.8.2. Market Share Analysis, 2021

            14.8.2.1. By Type

            14.8.2.2. By Treatment

            14.8.2.3. By End-user

    14.9. Italy

        14.9.1. Pricing Analysis

        14.9.2. Market Share Analysis, 2021

            14.9.2.1. By Type

            14.9.2.2. By Treatment

            14.9.2.3. By End-user

    14.10. China

        14.10.1. Pricing Analysis

        14.10.2. Market Share Analysis, 2021

            14.10.2.1. By Type

            14.10.2.2. By Treatment

            14.10.2.3. By End-user

    14.11. Japan

        14.11.1. Pricing Analysis

        14.11.2. Market Share Analysis, 2021

            14.11.2.1. By Type

            14.11.2.2. By Treatment

            14.11.2.3. By End-user

    14.12. South Korea

        14.12.1. Pricing Analysis

        14.12.2. Market Share Analysis, 2021

            14.12.2.1. By Type

            14.12.2.2. By Treatment

            14.12.2.3. By End-user

    14.13. Malaysia

        14.13.1. Pricing Analysis

        14.13.2. Market Share Analysis, 2021

            14.13.2.1. By Type

            14.13.2.2. By Treatment

            14.13.2.3. By End-user

    14.14. Singapore

        14.14.1. Pricing Analysis

        14.14.2. Market Share Analysis, 2021

            14.14.2.1. By Type

            14.14.2.2. By Treatment

            14.14.2.3. By End-user

    14.15. Australia

        14.15.1. Pricing Analysis

        14.15.2. Market Share Analysis, 2021

            14.15.2.1. By Type

            14.15.2.2. By Treatment

            14.15.2.3. By End-user

    14.16. New Zealand

        14.16.1. Pricing Analysis

        14.16.2. Market Share Analysis, 2021

            14.16.2.1. By Type

            14.16.2.2. By Treatment

            14.16.2.3. By End-user

    14.17. GCC Countries

        14.17.1. Pricing Analysis

        14.17.2. Market Share Analysis, 2021

            14.17.2.1. By Type

            14.17.2.2. By Treatment

            14.17.2.3. By End-user

    14.18. South Africa

        14.18.1. Pricing Analysis

        14.18.2. Market Share Analysis, 2021

            14.18.2.1. By Type

            14.18.2.2. By Treatment

            14.18.2.3. By End-user

    14.19. Israel

        14.19.1. Pricing Analysis

        14.19.2. Market Share Analysis, 2021

            14.19.2.1. By Type

            14.19.2.2. By Treatment

            14.19.2.3. By End-user

15. Market Structure Analysis

    15.1. Competition Dashboard

    15.2. Competition Benchmarking

    15.3. Market Share Analysis of Top Players

        15.3.1. By Regional

        15.3.2. By Type

        15.3.3. By Treatment

        15.3.4. By End-user

16. Competition Analysis

    16.1. Competition Deep Dive

        16.1.1. Nuvaira

            16.1.1.1. Overview

            16.1.1.2. Product Portfolio

            16.1.1.3. Profitability by Market Segments

            16.1.1.4. Sales Footprint

            16.1.1.5. Strategy Overview

                16.1.1.5.1. Marketing Strategy

        16.1.2. VIDA Diagnostics

            16.1.2.1. Overview

            16.1.2.2. Product Portfolio

            16.1.2.3. Profitability by Market Segments

            16.1.2.4. Sales Footprint

            16.1.2.5. Strategy Overview

                16.1.2.5.1. Marketing Strategy

        16.1.3. Boehringer Ingelheim International GmBH

            16.1.3.1. Overview

            16.1.3.2. Product Portfolio

            16.1.3.3. Profitability by Market Segments

            16.1.3.4. Sales Footprint

            16.1.3.5. Strategy Overview

                16.1.3.5.1. Marketing Strategy

        16.1.4. AstraZeneca

            16.1.4.1. Overview

            16.1.4.2. Product Portfolio

            16.1.4.3. Profitability by Market Segments

            16.1.4.4. Sales Footprint

            16.1.4.5. Strategy Overview

                16.1.4.5.1. Marketing Strategy

        16.1.5. Teva Pharmaceuticals

            16.1.5.1. Overview

            16.1.5.2. Product Portfolio

            16.1.5.3. Profitability by Market Segments

            16.1.5.4. Sales Footprint

            16.1.5.5. Strategy Overview

                16.1.5.5.1. Marketing Strategy

        16.1.6. GlaxoSmithKline

            16.1.6.1. Overview

            16.1.6.2. Product Portfolio

            16.1.6.3. Profitability by Market Segments

            16.1.6.4. Sales Footprint

            16.1.6.5. Strategy Overview

                16.1.6.5.1. Marketing Strategy

        16.1.7. Novartis

            16.1.7.1. Overview

            16.1.7.2. Product Portfolio

            16.1.7.3. Profitability by Market Segments

            16.1.7.4. Sales Footprint

            16.1.7.5. Strategy Overview

                16.1.7.5.1. Marketing Strategy

        16.1.8. Merck

            16.1.8.1. Overview

            16.1.8.2. Product Portfolio

            16.1.8.3. Profitability by Market Segments

            16.1.8.4. Sales Footprint

            16.1.8.5. Strategy Overview

                16.1.8.5.1. Marketing Strategy

        16.1.9. Roche

            16.1.9.1. Overview

            16.1.9.2. Product Portfolio

            16.1.9.3. Profitability by Market Segments

            16.1.9.4. Sales Footprint

            16.1.9.5. Strategy Overview

                16.1.9.5.1. Marketing Strategy

        16.1.10. Sanofi

            16.1.10.1. Overview

            16.1.10.2. Product Portfolio

            16.1.10.3. Profitability by Market Segments

            16.1.10.4. Sales Footprint

            16.1.10.5. Strategy Overview

                16.1.10.5.1. Marketing Strategy

17. Assumptions & Acronyms Used

18. Research Methodology

Don't pay for what you don't need

Customize your report by selecting specific countries or regions and save 30%!

List of Tables

Table 01: Global Market Value (US$ Million) Forecast by Region, 2017 to 2032

Table 02: Global Market Value (US$ Million) Forecast by Type, 2017 to 2032

Table 03: Global Market Value (US$ Million) Forecast by Treatment, 2017 to 2032

Table 04: Global Market Value (US$ Million) Forecast by End-user, 2017 to 2032

Table 05: North America Market Value (US$ Million) Forecast by Country, 2017 to 2032

Table 06: North America Market Value (US$ Million) Forecast by Type, 2017 to 2032

Table 07: North America Market Value (US$ Million) Forecast by Treatment, 2017 to 2032

Table 08: North America Market Value (US$ Million) Forecast by End-user, 2017 to 2032

Table 09: Latin America Market Value (US$ Million) Forecast by Country, 2017 to 2032

Table 10: Latin America Market Value (US$ Million) Forecast by Type, 2017 to 2032

Table 11: Latin America Market Value (US$ Million) Forecast by Treatment, 2017 to 2032

Table 12: Latin America Market Value (US$ Million) Forecast by End-user, 2017 to 2032

Table 13: Europe Market Value (US$ Million) Forecast by Country, 2017 to 2032

Table 14: Europe Market Value (US$ Million) Forecast by Type, 2017 to 2032

Table 15: Europe Market Value (US$ Million) Forecast by Treatment, 2017 to 2032

Table 16: Europe Market Value (US$ Million) Forecast by End-user, 2017 to 2032

Table 17: Asia Pacific Market Value (US$ Million) Forecast by Country, 2017 to 2032

Table 18: Asia Pacific Market Value (US$ Million) Forecast by Type, 2017 to 2032

Table 19: Asia Pacific Market Value (US$ Million) Forecast by Treatment, 2017 to 2032

Table 20: Asia Pacific Market Value (US$ Million) Forecast by End-user, 2017 to 2032

Table 21: Middle East and Africa Market Value (US$ Million) Forecast by Country, 2017 to 2032

Table 22: Middle East and Africa Market Value (US$ Million) Forecast by Type, 2017 to 2032

Table 23: Middle East and Africa Market Value (US$ Million) Forecast by Treatment, 2017 to 2032

Table 24: Middle East and Africa Market Value (US$ Million) Forecast by End-user, 2017 to 2032
Sabyasachi Ghosh
Sabyasachi Ghosh

Principal Consultant

Talk to Analyst

Find your sweet spots for generating winning opportunities in this market.

List of Charts

Figure 01: Global Market Value (US$ Million) by Type, 2022 to 2032

Figure 02: Global Market Value (US$ Million) by Treatment, 2022 to 2032

Figure 03: Global Market Value (US$ Million) by End-user, 2022 to 2032

Figure 04: Global Market Value (US$ Million) by Region, 2022 to 2032

Figure 05: Global Market Value (US$ Million) Analysis by Region, 2017 to 2032

Figure 06: Global Market Value Share (%) and BPS Analysis by Region, 2022 to 2032

Figure 07: Global Market Y-o-Y Growth (%) Projections by Region, 2022 to 2032

Figure 08: Global Market Value (US$ Million) Analysis by Type, 2017 to 2032

Figure 09: Global Market Value Share (%) and BPS Analysis by Type, 2022 to 2032

Figure 10: Global Market Y-o-Y Growth (%) Projections by Type, 2022 to 2032

Figure 11: Global Market Value (US$ Million) Analysis by Treatment, 2017 to 2032

Figure 12: Global Market Value Share (%) and BPS Analysis by Treatment, 2022 to 2032

Figure 13: Global Market Y-o-Y Growth (%) Projections by Treatment, 2022 to 2032

Figure 14: Global Market Value (US$ Million) Analysis by End-user, 2017 to 2032

Figure 15: Global Market Value Share (%) and BPS Analysis by End-user, 2022 to 2032

Figure 16: Global Market Y-o-Y Growth (%) Projections by End-user, 2022 to 2032

Figure 17: Global Market Attractiveness by Type, 2022 to 2032

Figure 18: Global Market Attractiveness by Treatment, 2022 to 2032

Figure 19: Global Market Attractiveness by End-user, 2022 to 2032

Figure 20: Global Market Attractiveness by Region, 2022 to 2032

Figure 21: North America Market Value (US$ Million) by Type, 2022 to 2032

Figure 22: North America Market Value (US$ Million) by Treatment, 2022 to 2032

Figure 23: North America Market Value (US$ Million) by End-user, 2022 to 2032

Figure 24: North America Market Value (US$ Million) by Country, 2022 to 2032

Figure 25: North America Market Value (US$ Million) Analysis by Country, 2017 to 2032

Figure 26: North America Market Value Share (%) and BPS Analysis by Country, 2022 to 2032

Figure 27: North America Market Y-o-Y Growth (%) Projections by Country, 2022 to 2032

Figure 28: North America Market Value (US$ Million) Analysis by Type, 2017 to 2032

Figure 29: North America Market Value Share (%) and BPS Analysis by Type, 2022 to 2032

Figure 30: North America Market Y-o-Y Growth (%) Projections by Type, 2022 to 2032

Figure 31: North America Market Value (US$ Million) Analysis by Treatment, 2017 to 2032

Figure 32: North America Market Value Share (%) and BPS Analysis by Treatment, 2022 to 2032

Figure 33: North America Market Y-o-Y Growth (%) Projections by Treatment, 2022 to 2032

Figure 34: North America Market Value (US$ Million) Analysis by End-user, 2017 to 2032

Figure 35: North America Market Value Share (%) and BPS Analysis by End-user, 2022 to 2032

Figure 36: North America Market Y-o-Y Growth (%) Projections by End-user, 2022 to 2032

Figure 37: North America Market Attractiveness by Type, 2022 to 2032

Figure 38: North America Market Attractiveness by Treatment, 2022 to 2032

Figure 39: North America Market Attractiveness by End-user, 2022 to 2032

Figure 40: North America Market Attractiveness by Country, 2022 to 2032

Figure 41: Latin America Market Value (US$ Million) by Type, 2022 to 2032

Figure 42: Latin America Market Value (US$ Million) by Treatment, 2022 to 2032

Figure 43: Latin America Market Value (US$ Million) by End-user, 2022 to 2032

Figure 44: Latin America Market Value (US$ Million) by Country, 2022 to 2032

Figure 45: Latin America Market Value (US$ Million) Analysis by Country, 2017 to 2032

Figure 46: Latin America Market Value Share (%) and BPS Analysis by Country, 2022 to 2032

Figure 47: Latin America Market Y-o-Y Growth (%) Projections by Country, 2022 to 2032

Figure 48: Latin America Market Value (US$ Million) Analysis by Type, 2017 to 2032

Figure 49: Latin America Market Value Share (%) and BPS Analysis by Type, 2022 to 2032

Figure 50: Latin America Market Y-o-Y Growth (%) Projections by Type, 2022 to 2032

Figure 51: Latin America Market Value (US$ Million) Analysis by Treatment, 2017 to 2032

Figure 52: Latin America Market Value Share (%) and BPS Analysis by Treatment, 2022 to 2032

Figure 53: Latin America Market Y-o-Y Growth (%) Projections by Treatment, 2022 to 2032

Figure 54: Latin America Market Value (US$ Million) Analysis by End-user, 2017 to 2032

Figure 55: Latin America Market Value Share (%) and BPS Analysis by End-user, 2022 to 2032

Figure 56: Latin America Market Y-o-Y Growth (%) Projections by End-user, 2022 to 2032

Figure 57: Latin America Market Attractiveness by Type, 2022 to 2032

Figure 58: Latin America Market Attractiveness by Treatment, 2022 to 2032

Figure 59: Latin America Market Attractiveness by End-user, 2022 to 2032

Figure 60: Latin America Market Attractiveness by Country, 2022 to 2032

Figure 61: Europe Market Value (US$ Million) by Type, 2022 to 2032

Figure 62: Europe Market Value (US$ Million) by Treatment, 2022 to 2032

Figure 63: Europe Market Value (US$ Million) by End-user, 2022 to 2032

Figure 64: Europe Market Value (US$ Million) by Country, 2022 to 2032

Figure 65: Europe Market Value (US$ Million) Analysis by Country, 2017 to 2032

Figure 66: Europe Market Value Share (%) and BPS Analysis by Country, 2022 to 2032

Figure 67: Europe Market Y-o-Y Growth (%) Projections by Country, 2022 to 2032

Figure 68: Europe Market Value (US$ Million) Analysis by Type, 2017 to 2032

Figure 69: Europe Market Value Share (%) and BPS Analysis by Type, 2022 to 2032

Figure 70: Europe Market Y-o-Y Growth (%) Projections by Type, 2022 to 2032

Figure 71: Europe Market Value (US$ Million) Analysis by Treatment, 2017 to 2032

Figure 72: Europe Market Value Share (%) and BPS Analysis by Treatment, 2022 to 2032

Figure 73: Europe Market Y-o-Y Growth (%) Projections by Treatment, 2022 to 2032

Figure 74: Europe Market Value (US$ Million) Analysis by End-user, 2017 to 2032

Figure 75: Europe Market Value Share (%) and BPS Analysis by End-user, 2022 to 2032

Figure 76: Europe Market Y-o-Y Growth (%) Projections by End-user, 2022 to 2032

Figure 77: Europe Market Attractiveness by Type, 2022 to 2032

Figure 78: Europe Market Attractiveness by Treatment, 2022 to 2032

Figure 79: Europe Market Attractiveness by End-user, 2022 to 2032

Figure 80: Europe Market Attractiveness by Country, 2022 to 2032

Figure 81: Asia Pacific Market Value (US$ Million) by Type, 2022 to 2032

Figure 82: Asia Pacific Market Value (US$ Million) by Treatment, 2022 to 2032

Figure 83: Asia Pacific Market Value (US$ Million) by End-user, 2022 to 2032

Figure 84: Asia Pacific Market Value (US$ Million) by Country, 2022 to 2032

Figure 85: Asia Pacific Market Value (US$ Million) Analysis by Country, 2017 to 2032

Figure 86: Asia Pacific Market Value Share (%) and BPS Analysis by Country, 2022 to 2032

Figure 87: Asia Pacific Market Y-o-Y Growth (%) Projections by Country, 2022 to 2032

Figure 88: Asia Pacific Market Value (US$ Million) Analysis by Type, 2017 to 2032

Figure 89: Asia Pacific Market Value Share (%) and BPS Analysis by Type, 2022 to 2032

Figure 90: Asia Pacific Market Y-o-Y Growth (%) Projections by Type, 2022 to 2032

Figure 91: Asia Pacific Market Value (US$ Million) Analysis by Treatment, 2017 to 2032

Figure 92: Asia Pacific Market Value Share (%) and BPS Analysis by Treatment, 2022 to 2032

Figure 93: Asia Pacific Market Y-o-Y Growth (%) Projections by Treatment, 2022 to 2032

Figure 94: Asia Pacific Market Value (US$ Million) Analysis by End-user, 2017 to 2032

Figure 95: Asia Pacific Market Value Share (%) and BPS Analysis by End-user, 2022 to 2032

Figure 96: Asia Pacific Market Y-o-Y Growth (%) Projections by End-user, 2022 to 2032

Figure 97: Asia Pacific Market Attractiveness by Type, 2022 to 2032

Figure 98: Asia Pacific Market Attractiveness by Treatment, 2022 to 2032

Figure 99: Asia Pacific Market Attractiveness by End-user, 2022 to 2032

Figure 100: Asia Pacific Market Attractiveness by Country, 2022 to 2032

Figure 101: Middle East and Africa Market Value (US$ Million) by Type, 2022 to 2032

Figure 102: Middle East and Africa Market Value (US$ Million) by Treatment, 2022 to 2032

Figure 103: Middle East and Africa Market Value (US$ Million) by End-user, 2022 to 2032

Figure 104: Middle East and Africa Market Value (US$ Million) by Country, 2022 to 2032

Figure 105: Middle East and Africa Market Value (US$ Million) Analysis by Country, 2017 to 2032

Figure 106: Middle East and Africa Market Value Share (%) and BPS Analysis by Country, 2022 to 2032

Figure 107: Middle East and Africa Market Y-o-Y Growth (%) Projections by Country, 2022 to 2032

Figure 108: Middle East and Africa Market Value (US$ Million) Analysis by Type, 2017 to 2032

Figure 109: Middle East and Africa Market Value Share (%) and BPS Analysis by Type, 2022 to 2032

Figure 110: Middle East and Africa Market Y-o-Y Growth (%) Projections by Type, 2022 to 2032

Figure 111: Middle East and Africa Market Value (US$ Million) Analysis by Treatment, 2017 to 2032

Figure 112: Middle East and Africa Market Value Share (%) and BPS Analysis by Treatment, 2022 to 2032

Figure 113: Middle East and Africa Market Y-o-Y Growth (%) Projections by Treatment, 2022 to 2032

Figure 114: Middle East and Africa Market Value (US$ Million) Analysis by End-user, 2017 to 2032

Figure 115: Middle East and Africa Market Value Share (%) and BPS Analysis by End-user, 2022 to 2032

Figure 116: Middle East and Africa Market Y-o-Y Growth (%) Projections by End-user, 2022 to 2032

Figure 117: Middle East and Africa Market Attractiveness by Type, 2022 to 2032

Figure 118: Middle East and Africa Market Attractiveness by Treatment, 2022 to 2032

Figure 119: Middle East and Africa Market Attractiveness by End-user, 2022 to 2032

Figure 120: Middle East and Africa Market Attractiveness by Country, 2022 to 2032

Recommendations

Healthcare

Cancer Diagnostics Market

Published : August 2023

Healthcare

Lung Disease Therapeutics Market

Published : July 2023

Healthcare

Lung Cancer Surgery Market

Published : June 2022

Healthcare

Lung Cancer Therapeutics Market

Published : June 2022

Explore Healthcare Insights

View Reports

Airway Disease Treatment Market