The global rare neurological disease treatment market is worth USD 20.0 billion in 2025 and is anticipated to reach a value of USD 40.7 billion by 2035. Sales are projected to rise at a CAGR of 7.4% over the forecast period between 2025 and 2035. The revenue generated by rare neurological disease treatment in 2024 was USD 18,746.5 million.
The market for rare neurological disease treatment is expected to see remarkable progress with the advent of gene therapy, usage of precision medicine and innovation in biopharmaceutical manufacturing. Orphan drug designations, fast tracking regulatory approvals along with expanded clinical trials are accelerating the approval and commercialization of novel therapies.
CRISPR-based gene editing, monoclonal antibodies as well as RNA-based therapies are expected to change the treatment landscape, offering targeted therapy and disease-modifying solutions. With the increasing investment towards drug discovery for orphan drugs, strategic collaborations, and efforts by patient advocacy, the market is expected to be driven further. As early diagnosis and personalized medicine gain traction, the future of rare neurological disease therapies looks promising with improved patient outcomes and expanded treatment access.
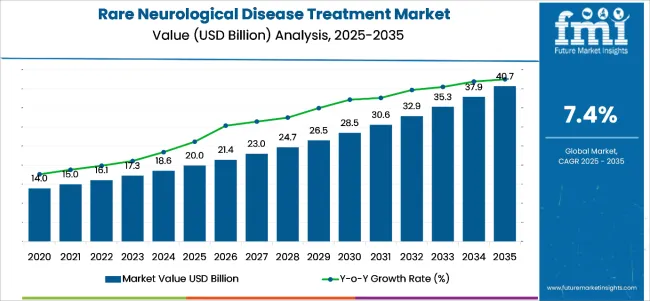
| Metrics | Value |
|---|---|
| Industry Size (2025E) | USD 20.0 billion |
| Industry Value (2035F) | USD 40.7 billion |
| CAGR (2025 to 2035) | 7.4% |
Advances in technology regarding gene therapy and biologics have opened broad avenues to look at the source causes of various rare neurological conditions. CRISPR gene-edited tools, RNA-based therapeutics, and creative delivery systems, for example, are creating fresh opportunities for a new wave of treatments. So are partnerships by biotech companies, research outfits, and multinational pharmaceutical companies pushing progress.
While the future outlook appears promising, barriers including high treatment costs, limited access to patients, and the relatively small pool of patients for clinical trials restrict widespread growth of the market.
Instead, growth is expected to be maintained at a healthy pace during the forecast period with rising public-private collaborations, new personalized medicine breakthroughs, and growing attention to rare diseases in emerging markets. The market will grow significantly by 2035 with continuous innovation and an expanding pipeline of targeted therapies.
Another incentive is regulatory. Regulatory incentives are further extended through extended market exclusivity and tax benefits under acts such as the USA Orphan Drug Act and similar regulations in the European Union. It encourages drugs companies to invest more in drugs for rare diseases, in order not to lead to an economically unviable scenario, considering the small number of patients.
In conclusion, despite the great promise, markets still face huge challenges, especially in terms of the high price of therapies; limited access within low- and middle-income countries; and conducting clinical trials is logistically difficult for rare diseases. The improving landscape, though, is what is happening, with public-private collaborations, patients with advocacy groups, and innovative pricing models developed to improve the access to the therapies.
Although each rare neurological disease (RND) is individually uncommon, their combined burden is substantial. Rare diseases overall affect between 3.5 and 5.9 percent of the global population, translating to roughly 260 to 450 million people worldwide, according to multiple studies. Nearly half of these conditions have a neurological basis, underscoring the scale of the challenge for health systems.
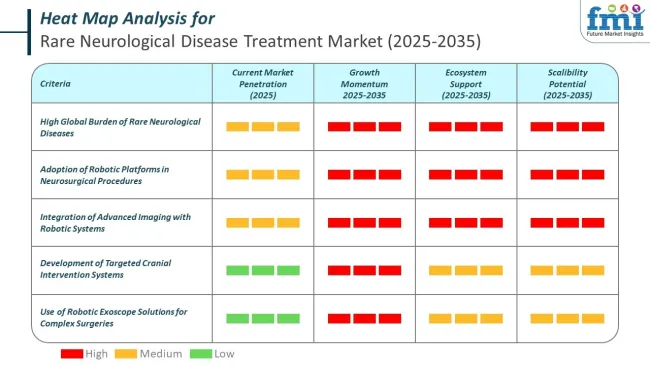
Medtronic is at the forefront with its StealthStation™ platform and robotic-assisted deep brain stimulation (DBS) systems, which support accurate targeting in complex procedures for conditions like dystonia and refractory epilepsy. Zimmer Biomet's ROSA® Brain platform enables stereotactic neurosurgery with submillimeter precision and is increasingly adopted in pediatric neurology centers.
Synaptive Medical offers the Modus V™ robotic exoscope, enhancing visualization during rare brain tumor surgeries and vascular anomalies. Renishaw’s neuromate® system provides automated robotic assistance for targeted cranial interventions, especially in rare neurodegenerative conditions such as Rett syndrome.
The global rare neurological disease treatment market compound annual growth rate (CAGR) for the first half of 2024 and 2025 is compared in the table below. This analysis provides important insights into the performance of the industry by highlighting significant shifts and trends in revenue generation.
The first half (H1) is the period from January to June, and the second half (H2) is July to December. In the first half (H1) of the decade from 2024 to 2034, the business is predicted to surge at a CAGR of 8.5%, followed by a slightly lower growth rate of 7.9% in the second half (H2) of the same decade.
| Particular | Value CAGR |
|---|---|
| H1 (2024 to 2034) | 8.5% |
| H2 (2024 to 2034) | 7.9% |
| H1 (2025 to 2035) | 7.4% |
| H2 (2025 to 2035) | 7.0% |
Moving into the subsequent period, from H1 2025 to H2 2035, the CAGR is projected to decrease slightly to 7.4% in the first half and remain relatively lower at 7.0% in the second half. In the first half (H1) the industry witnessed a decrease of 110 BPS while in the second half (H2), the industry witnessed a decrease of 90 BPS.
The rare neurological disease treatment market is segmented by drug class into anti-depressants, anti-psychotics, cholinesterase inhibitors, antagonists, immunomodulators, and others. By route of administration, the market is categorized into oral and injectables.
In terms of indication, it covers spinal muscular atrophy (SMA), amyotrophic lateral sclerosis (ALS), narcolepsy, chronic inflammatory demyelinating polyneuropathy, Huntington's disease, and others. Based on distribution channel, the market is divided into hospital pharmacies, retail pharmacies, mail order pharmacies, and drug stores. Regionally, the market is analyzed across North America, Latin America, Western Europe, Eastern Europe, South Asia & Pacific, East Asia, and the Middle East & Africa.
Among the various drug classes used in rare neurological disease treatment, anti-depressants are projected to remain the most lucrative segment, accounting for a prominent 26% market share in 2025. This segment is expected to grow at a CAGR of 7.8% from 2025 to 2035. These drugs are widely used for symptom management in conditions like Huntington’s disease, multiple sclerosis, and ALS, where psychological comorbidities such as depression and anxiety are prevalent.
Their broad applicability across indications and proven efficacy in improving patients’ quality of life drive strong demand. The segment benefits from a rich pipeline including SSRIs, SNRIs, and novel agents under development.
The others category typically includes anticonvulsants, sedatives, and experimental agents like RNA-based neuromodulators, which are in earlier stages of adoption. While innovation continues in these adjacent areas, anti-depressants remain the core therapeutic class due to established safety profiles, flexibility in prescribing, and rising psychiatric diagnosis rates.
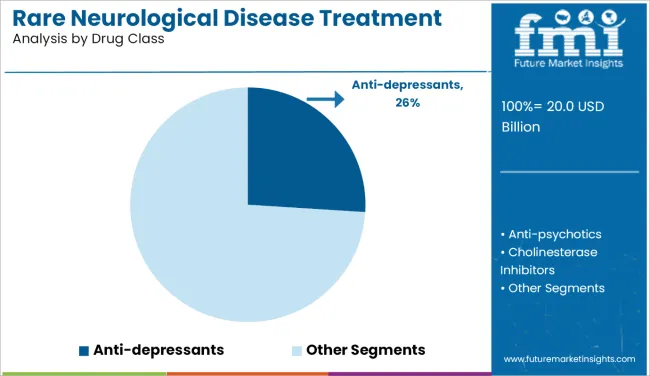
| Drug Class | CAGR (2025 to 2035) |
|---|---|
| Anti-depressants | 7.8% |
The oral route of administration is projected to hold the prominent share in the rare neurological disease treatment market, accounting for 72% in 2025. The oral segment is expected to grow at a CAGR of 7.9% through 2035, with growing pharmaceutical focus on patient-centric drug delivery.
Oral formulations are preferred due to their ease of use, high patient compliance, and widespread availability across therapeutic settings. Patients with rare neurological conditions often require long-term and daily medication regimens, making oral delivery a practical and less invasive option. Moreover, oral drugs eliminate the need for hospitalization or clinical administration, reducing treatment-associated costs and logistical burdens.
They are especially critical in low- and middle-income countries, where access to specialized infusion centers is limited. The increasing development of novel oral agents, particularly in anti-depressants and gene-targeted therapies, is further expanding this segment’s pipeline.
Compared to injectables, oral formulations also benefit from easier storage and transport. With growing pharmaceutical focus on patient-centric drug delivery, the oral segment is expected to grow at a CAGR of 7.9% through 2035.
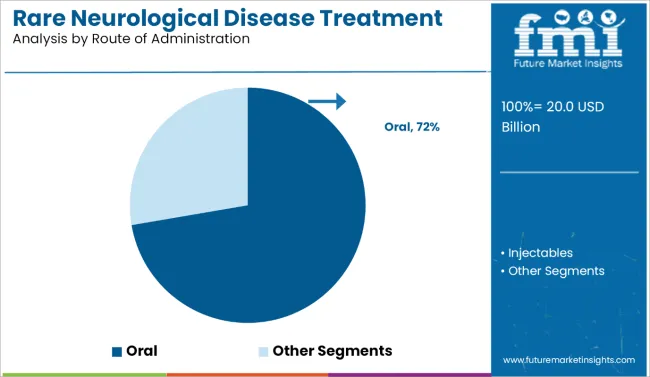
| Route of Administration | Market Share (2025) |
|---|---|
| Oral | 72% |
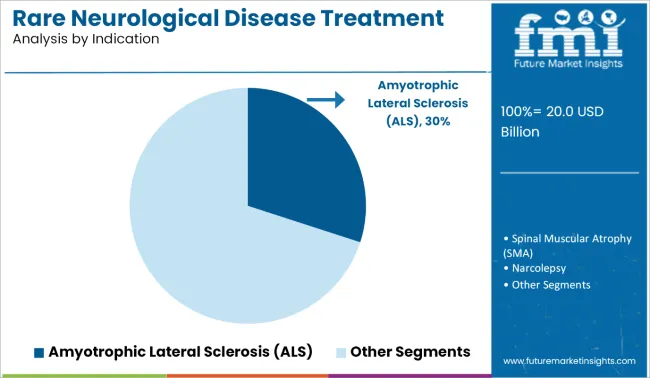
The amyotrophic lateral sclerosis segment accounts for 30% share. Cases of Amyotrophic Lateral Sclerosis (ALS) are rising due to a combination of factors, primarily linked to aging populations and improved diagnostic awareness. ALS is more common in individuals over the age of 60, and as global life expectancy increases, so does the incidence of age-related neurological disorders.
Additionally, advancements in medical technology and better access to healthcare have led to earlier and more accurate diagnoses. Environmental factors, genetic predispositions, and potential links to lifestyle or occupational exposures are also being studied as possible contributors. The growing awareness and tracking of ALS cases have further contributed to reported increases worldwide.
| Indication Segment | Market Share (2025) |
|---|---|
| Amyotrophic Lateral Sclerosis | 30% |
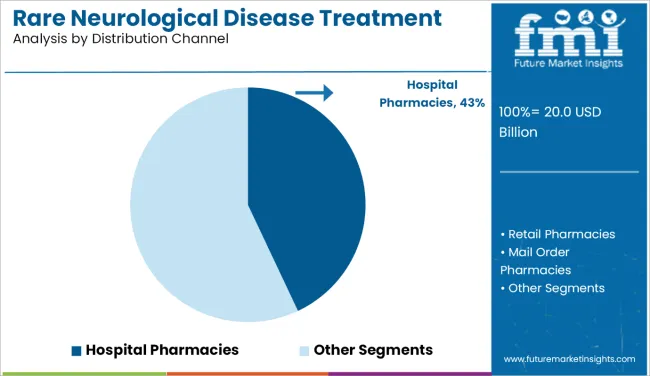
hospital-based distribution is set to remain lucrative and is projected to grow at a CAGR of 7.7% between 2025 and 2035. Hospital pharmacies are expected to capture the largest revenue share in the distribution of rare neurological disease treatments, owing to their critical role in managing complex, high-cost therapies.
These include gene therapies, monoclonal antibodies, and injectable biologics, which often require specialized storage, administration, and monitoring-all of which are handled most effectively in hospital settings. Many rare neurological conditions involve progressive deterioration and require coordinated care, including inpatient services, making hospitals a primary treatment center.
Hospital pharmacies ensure strict regulatory compliance, dosing accuracy, and support from clinical pharmacists who specialize in rare disease management. Additionally, reimbursement pathways are better structured in hospital systems, especially in the USA and Europe, where insurance coverage is tied to accredited healthcare institutions.
| Distribution Channel | CAGR (2025 to 2035) |
|---|---|
| Hospital Pharmacies | 7.7% |
Emergence of genomic medicine has transformed rare neurological diseases because it can very specifically identify disease-causing genetic mutations. Precision medicine, where each patient's response to a disease is unique and forms the basis of treatment, thus opens new paths for targeted therapy.
Technologies that include CRISPR-Cas9 gene editing and antisense oligonucleotides, or ASOs, have created the possibility to develop therapies with the goal of correcting or silencing specific defects in genes. Indeed, with the approval of therapies such as Spinraza in the treatment of SMA, it has been demonstrated that precision medicine is applicable in managing rare neurological diseases. Even advanced diagnosing tools such as whole-genome sequencing and NGS have been applied massively, making early and accurate diagnosis, while treatment is offered early.
Global regulatory frameworks have significantly fast-tracked therapies for rare neurological diseases. In the United States, that is the Orphan Drug Act, and, in Europe, that is through the Orphan Medicinal Product Regulation of the EMA, awarding pharmaceuticals with benefits in the form of tax credits, waived fees, and market exclusivity to encourage an investment of efforts in these drugs.
Since these incentives were put in place, orphan drug designations and approvals have multiplied, thus mitigating the financial risks of treatment development in relation to small patient populations. In addition, expediting approval pathways and breakthrough designations initiated by regulatory authorities have reduced time-to-market for innovatively designed treatments.
Rare neurological diseases received little attention during the past when the prevalence and cost of therapy development were pretty low. There are several other reasons that highlight regulatory frameworks have been the dominant forces behind these developments.
Particularly, the Orphan Drug Act of 1983 in the USA and the Orphan Medicinal Product Regulation of the European Medicines Agency, initiated in 2000, have set the grounds by providing the pharmaceutical companies with financial and operational incentives.
As far as this matter is concerned, these frameworks alleviate the difficulties experienced while treating smaller populations of patients while mechanisms are developed that reduce economic risks associated with the development of such therapies for rare diseases.
Gene therapy opens a whole new window of opportunities in the treatment of rare neurological disorders, namely to attack the underlying causes of the conditions. Gene delivery techniques have been advanced and have improved safety and efficacy significantly.. Numbered among these promising candidates at late stages of development for late-stage clinical trials are ALS and Duchenne muscular dystrophy.
The growing number of biotech companies involved in gene therapy and strategic collaborations with drug manufacturers will accelerate the early commercialization of these therapies. Other innovative technologies, like mRNA-based therapies and nanotechnology-driven delivery systems, will further expand the applications of gene therapy.
One of the greatest challenges is that therapies for rare neurological diseases are quite expensive to develop. For instance, Zolgensma treatment, which costs millions of dollars per patient, demonstrates the affordability hurdle both for health care systems and patients.
Costs are usually dictated by the employment of state-of-the-art technologies, long development cycles, and the low number of patients involved that limit economies of scale. This access is most restricted in low- and middle-income countries due to the weakness of health infrastructures and low insurance coverage. The challenges for addressing these can only be done with innovative pricing, such as through outcome-based reimbursement models, and global collaboration for equitable access.
Tier 1 companies are the industry leaders with 52.2% of the global industry. These companies stand out for having a large product portfolio and a high production capacity. These industry leaders also stand out for having a wide geographic reach, a strong customer base, and substantial experience in manufacturing and having enough financial resources, which enables them to enhance their research and development efforts and expand into new industries.
The companies within tier 1 have a good reputation and high brand value. Prominent companies within tier 1 include Pfizer, Inc., Novartis Pharmaceuticals Corp., Merck & Co., and Johnson & Johnson Services, Inc.
Tier 2 companies are relatively smaller as compared with tier 1 players. The tier 2 companies hold a market share of 29.4% worldwide. These firms may not have cutting-edge technology or a broad global reach, but they do ensure regulatory compliance and have good technology.
The players are more competitive when it comes to pricing and target niche markets. Key Companies under this category include Bayer AG, GlaxoSmithKline, Inc., Sanofi S.A., AbbVie Inc. (Allergan, Inc.) among others
Compared to Tiers 1 and 2, Tier 3 companies offer outsourced testing services, but with smaller revenue spouts and less influence. These companies mostly operate in one or two countries and have limited customer base. They specialize in specific products and cater to niche markets, adding diversity to the industry.
The market analysis for rare neurological disease treatment in various nations is covered in the section below. An analysis of important nations in North America, Latin America, Western Europe, Eastern Europe, East Asia, South Asia & Pacific, and Middle East & Africa of the world has been mentioned below.
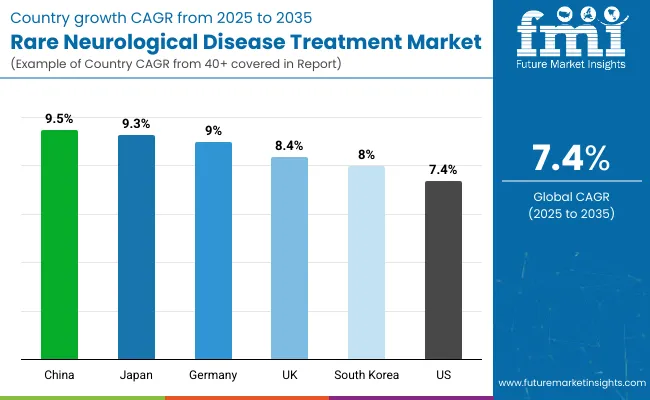
It is projected that the United States will maintain its leading position in North America through 2035, holding a value share of 93.8%. By 2035, China is expected to experience a CAGR of 9.5% in the Asia-Pacific region.
| Countries | Value CAGR (2025 to 2035) |
|---|---|
| United States | 7.4% |
| Germany | 9.0% |
| Japan | 9.3% |
| South Korea | 8.0% |
| UK | 8.4% |
| China | 9.5% |
Germany is an innovation and research hub, which makes it a significant market for rare neurological disease treatments. Home to some of the best research institutions in the world, such as the Max Planck Institute and Fraunhofer Society, it also has well-developed pharmaceutical industries, including global industry leaders, such as Bayer and Boehringer Ingelheim. These companies invest in developing advanced therapies, further developing on the strong scientific tradition in Germany.
It can be seen how government funding catalyzes the innovation process. The German Research Foundation (DFG) program and public-private partnerships under the Federal Ministry of Education and Research (BMBF) all ensure a sustainable flow of finances towards cutting-edge research. Precision medicine is a leading focus area for Germany. Here, targeting a specific genetic or molecular mechanism leading to a condition is in good alignment with treatment for rare neurological diseases.
The USA has dominated the market in terms of rare treatments for neurological disorders due to extensive investment in research and development, the stringent regulatory setup, and the strength of its pharmaceutical sector.
The Orphan Drug Act in 1983 proved to be a boon to pharmaceutical companies in prioritizing treatments for rare diseases as tax credits, market exclusivity, and speedy approval were incentives provided to pharmaceutical companies. This legislation has brought a resulting explosion in orphan drug designations and approvals, many for rare neurological conditions like ALS, SMA, and Huntington's disease.
A significant presence of biotech and pharmaceutical leaders, such as Biogen, Novartis, Pfizer, and Vertex Pharmaceuticals, which invest a lot in innovation, poses a plus factor for the USA The country also has a thriving ecosystem of academic research, including the National Institutes of Health (NIH) and strong universities, that forms critical funding and resources for groundbreaking studies. For example, the NIH BRAIN Initiative and gene therapy research funding have significantly advanced treatments in neurological conditions.
Government programs also play a very important role in market growth. For example, programs such as the National Health Mission aim to increase healthcare access and gain momentum. Some specialized programs are targeted towards rare diseases.
For example, the National Policy for Rare Diseases of 2021 aims to enhance funding for the treatment of rare conditions and support research and development of therapies. Establishing rare disease centers at all major hospitals across the nation has further strengthened diagnostics and care delivery.
India's biotech industry is also driving the growth in the country's market. Players like Biocon, Bharat Biotech, and Dr. Reddy's Laboratories are concentrating much on low-cost offerings for a domestic clientele. All this is achieved due to strong local manufacturing.
Thus, India is able to produce high-quality therapies at costs that are significantly lower than offered in the global markets. This is because out-of-pocket healthcare expense remains very significant within the country.
In terms of this market, the companies involved are resorting to multiple strategies to retain a competitive position. Geographical expansion into the emerging markets, particularly United States and Asia Pacific countries, has been another strategic priority for these companies, where growth in the healthcare infrastructure and awareness is strong.
| Report Attributes | Details |
|---|---|
|
Current Total Market Size (2025) |
USD 20.0 billion |
|
Projected Market Size (2035) |
USD 40.7 billion |
|
CAGR (2025 to 2035) |
7.4% |
|
Base Year for Estimation |
2024 |
|
Historical Period |
2020 to 2024 |
|
Projections Period |
2025 to 2035 |
|
Market Analysis Parameter |
Revenue in USD Billion |
|
By Drug Class |
Anti-depressants, Anti-psychotics, Cholinesterase Inhibitors, Antagonists, Immunomodulators, Others |
|
By Route of Administration |
Oral, Injectables |
|
By Indication |
Spinal Muscular Atrophy (SMA), Amyotrophic Lateral Sclerosis (ALS), Narcolepsy, Chronic Inflammatory Demyelinating Polyneuropathy, Huntington's Disease, Others |
|
By Distribution Channel |
Hospital Pharmacies, Retail Pharmacies, Mail Order Pharmacies, Drug Stores |
|
Regions Covered |
North America, Latin America, Western Europe, Eastern Europe, South Asia & Pacific, East Asia, Middle East & Africa |
|
Countries Covered |
United States, Japan, Germany, India, United Kingdom, France, Italy, Brazil, Canada, South Korea, Australia, Spain, Netherlands, Saudi Arabia, Switzerland |
|
Key Players |
Pfizer, Inc, Novartis Pharmaceuticals Corp., Merck & Co., Johnson & Johnson Services, Inc., Bayer AG, GlaxoSmithKline, Inc., Sanofi S.A., AbbVie Inc. (Allergan, Inc.), Teva Pharmaceuticals, F. Hoffmann-La Roche Ltd., Others |
|
Additional Attributes |
Rising prevalence of rare neurological disorders, increased R&D investment, supportive regulatory frameworks, growing gene therapy adoption |
|
Customization and Pricing |
Available upon request |
In terms of drug class, the industry is divided into anti-depressants, anti-psychotics, cholinesterase inhibitors, antagonists, and immunomodulators among others
In terms of route of administration, the industry is segregated into oral and injectables.
In terms of indication, the industry is segregated into spinal muscular atrophy (SMA), amyotrophic lateral sclerosis (ALS), narcolepsy, chronic inflammatory demyelinating polyneuropathy, Huntington’s disease among others.
In terms of distribution channel, the industry is divided into hospital pharmacies, retail pharmacies, mail order pharmacies and drug stores.
Key countries of North America, Latin America, East Asia, South Asia & Pacific, Western Europe, Eastern Europe and Middle East and Africa (MEA) have been covered in the report.
The global rare neurological disease treatment industry is projected to witness CAGR of 7.4% between 2025 and 2035.
The global rare neurological disease treatment industry stood at USD 18,746.5 million in 2024.
The global rare neurological disease treatment industry is anticipated to reach USD 40.7 billion by 2035 end.
China is expected to show a CAGR of 9.5% in the assessment period.
The key players operating in the global rare neurological disease treatment industry are Pfizer, Inc, Novartis Pharmaceuticals Corp., Merck & Co., Johnson & Johnson Services, Inc., Bayer AG, GlaxoSmithKline , Inc., Sanofi S.A., AbbVie Inc. (Allergan, Inc.) , Teva Pharmaceuticals, F. Hoffmann-La Roche Ltd. among others.
Table 01: Global Market Value (US$ Million), 2017 to 2021
Table 02: Global Market Value (US$ Million), 2022 to 2032
Table 03: Global Market Value (US$ Million) and Y-o-Y, 2022 to 2032
Table 04: Global Alzheimer’s Disease Segment Value (US$ Million), By Region 2017 to 2021
Table 05: Global Alzheimer’s Disease Segment Value (US$ Million), By Region 2022 to 2032
Table 06: Global Alzheimer’s Disease Segment Market Share, By Region 2017 to 2021
Table 07: Global Alzheimer’s Disease Segment Market Share, By Region 2022 to 2032
Table 08: Global Alzheimer’s Disease Segment Y-o-Y, By Region 2022 to 2032
Table 09: Global Narcolepsy Segment Value (US$ Million), By Region 2017 to 2021
Table 10: Global Narcolepsy Segment Value (US$ Million), By Region 2022 to 2032
Table 11: Global Narcolepsy Segment Market Share, By Region 2017 to 2021
Table 12: Global Narcolepsy Segment Market Share, By Region 2022 to 2032
Table 13: Global Narcolepsy Segment Y-o-Y, By Region 2022 to 2032
Table 14: Global Multiple Sclerosis Segment Value (US$ Million), By Region 2017 to 2021
Table 15: Global Multiple Sclerosis Segment Value (US$ Million), By Region 2022 to 2032
Table 16: Global Multiple Sclerosis Segment Market Share, By Region 2017 to 2021
Table 17: Global Multiple Sclerosis Segment Market Share, By Region 2022 to 2032
Table 18: Global Multiple Sclerosis Segment Y-o-Y, By Region 2022 to 2032
Table 19: Global Amyotrophic Lateral Sclerosis Segment Value (US$ Million), By Region 2017 to 2021
Table 20: Global Amyotrophic Lateral Sclerosis Segment Value (US$ Million), By Region 2022 to 2032
Table 21: Global Amyotrophic Lateral Sclerosis Segment Market Share, By Region 2017 to 2021
Table 22: Global Amyotrophic Lateral Sclerosis Segment Market Share, By Region 2022 to 2032
Table 23: Global Amyotrophic Lateral Sclerosis Segment Y-o-Y, By Region 2022 to 2032
Table 24: Global Other Indications Segment Value (US$ Million), By Region 2017 to 2021
Table 25: Global Other Indications Segment Value (US$ Million), By Region 2022 to 2032
Table 26: Global Other Indications Segment Market Share, By Region 2017 to 2021
Table 27: Global Other Indications Segment Market Share, By Region 2022 to 2032
Table 28: Global Other Indications Segment Y-o-Y, By Region 2022 to 2032
Table 29: Global Biologics Segment Value (US$ Million), By Region 2017 to 2021
Table 30: Global Biologics Segment Value (US$ Million), By Region 2022 to 2032
Table 31: Global Biologics Segment Market Share, By Region 2017 to 2021
Table 32: Global Biologics Segment Market Share, By Region 2022 to 2032
Table 33: Global Biologics Segment Y-o-Y, By Region 2022 to 2032
Table 34: Global Organic Compounds Segment Value (US$ Million), By Region 2017 to 2021
Table 35: Global Organic Compounds Segment Value (US$ Million), By Region 2022 to 2032
Table 36: Global Organic Compounds Segment Market Share, By Region 2017 to 2021
Table 37: Global Organic Compounds Segment Market Share, By Region 2022 to 2032
Table 38: Global Organic Compounds Segment Y-o-Y, By Region 2022 to 2032
Table 39: Global Injectables Segment Value (US$ Million), By Region 2017 to 2021
Table 40: Global Injectables Segment Value (US$ Million), By Region 2022 to 2032
Table 41: Global Injectables Segment Market Share, By Region 2017 to 2021
Table 42: Global Injectables Segment Market Share, By Region 2022 to 2032
Table 43: Global Injectables Segment Y-o-Y, By Region 2022 to 2032
Table 44: Global Oral Segment Value (US$ Million), By Region 2017 to 2021
Table 45: Global Oral Segment Value (US$ Million), By Region 2022 to 2032
Table 46: Global Oral Segment Market Share, By Region 2017 to 2021
Table 47: Global Oral Segment Market Share, By Region 2022 to 2032
Table 48: Global Oral Segment Y-o-Y, By Region 2022 to 2032
Table 49: Global Others Segment Value (US$ Million), By Region 2017 to 2021
Table 50: Global Others Segment Value (US$ Million), By Region 2022 to 2032
Table 51: Global Others Segment Market Share, By Region 2017 to 2021
Table 52: Global Others Segment Market Share, By Region 2022 to 2032
Table 53: Global Others Segment Y-o-Y, By Region 2022 to 2032
Table 54: Global Hospital Pharmacies Segment Value (US$ Million), By Region 2017 to 2021
Table 55: Global Hospital Pharmacies Segment Value (US$ Million), By Region 2022 to 2032
Table 56: Global Hospital Pharmacies Segment Market Share, By Region 2017 to 2021
Table 57: Global Hospital Pharmacies Segment Market Share, By Region 2022 to 2032
Table 58: Global Hospital Pharmacies Segment Y-o-Y, By Region 2022 to 2032
Table 59: Global Retail Pharmacies Segment Value (US$ Million), By Region 2017 to 2021
Table 60: Global Retail Pharmacies Segment Value (US$ Million), By Region 2022 to 2032
Table 61: Global Retail Pharmacies Segment Market Share, By Region 2017 to 2021
Table 62: Global Retail Pharmacies Segment Market Share, By Region 2022 to 2032
Table 63: Global Retail Pharmacies Segment Y-o-Y, By Region 2022 to 2032
Table 64: Global Online Pharmacies Segment Value (US$ Million), By Region 2017 to 2021
Table 65: Global Online Pharmacies Segment Value (US$ Million), By Region 2022 to 2032
Table 66: Global Online Pharmacies Segment Market Share, By Region 2017 to 2021
Table 67: Global Online Pharmacies Segment Market Share, By Region 2022 to 2032
Table 68: Global Online Pharmacies Segment Y-o-Y, By Region 2022 to 2032
Table 69: North America Market Value (US$ Million), By Country 2017 to 2021
Table 70: North America Market Value (US$ Million), By Country 2022 to 2032
Table 70: North America Market Value (US$ Million), By Indication 2017 to 2021
Table 72: North America Market Value (US$ Million), By Indication 2022 to 2032
Table 73: North America Market Value (US$ Million), By Drug Type 2017 to 2021
Table 74: North America Market Value (US$ Million), By Drug Type 2022 to 2032
Table 75: North America Market Value (US$ Million), By Mode of Administration 2017 to 2021
Table 76: North America Market Value (US$ Million), By Mode of Administration 2022 to 2032
Table 77: North America Market Value (US$ Million), By Distribution Channel 2017 to 2021
Table 78: North America Market Value (US$ Million), By Distribution Channel 2022 to 2032
Table 79: Latin America Market Value (US$ Million), By Country 2017 to 2021
Table 80: Latin America Market Value (US$ Million), By Country 2022 to 2032
Table 81: Latin America Market Value (US$ Million), By Indication 2017 to 2021
Table 82: Latin America Market Value (US$ Million), By Indication 2022 to 2032
Table 83: Latin America Market Value (US$ Million), By Drug Type 2017 to 2021
Table 84: Latin America Market Value (US$ Million), By Drug Type 2022 to 2032
Table 85: Latin America Market Value (US$ Million), By Mode of Administration 2017 to 2021
Table 86: Latin America Market Value (US$ Million), By Mode of Administration 2022 to 2032
Table 87: Latin America Market Value (US$ Million), By Distribution Channel 2017 to 2021
Table 88: Latin America Market Value (US$ Million), By Distribution Channel 2022 to 2032
Table 89: Europe Market Value (US$ Million), By Country 2017 to 2021
Table 90: Europe Market Value (US$ Million), By Country 2022 to 2032
Table 91: Europe Market Value (US$ Million), By Indication 2017 to 2021
Table 92: Europe Market Value (US$ Million), By Indication 2022 to 2032
Table 93: Europe Market Value (US$ Million), By Drug Type 2017 to 2021
Table 94: Europe Market Value (US$ Million), By Drug Type 2022 to 2032
Table 95: Europe Market Value (US$ Million), By Mode of Administration 2017 to 2021
Table 96: Europe Market Value (US$ Million), By Mode of Administration 2022 to 2032
Table 97: Europe Market Value (US$ Million), By Distribution Channel 2017 to 2021
Table 98: Europe Market Value (US$ Million), By Distribution Channel 2022 to 2032
Table 99: Japan Market Value (US$ Million), By Country 2017 to 2021
Table 100: Japan Market Value (US$ Million), By Country 2022 to 2032
Table 101: Japan Market Value (US$ Million), By Indication 2017 to 2021
Table 102: Japan Market Value (US$ Million), By Indication 2022 to 2032
Table 103: Japan Market Value (US$ Million), By Drug Type 2017 to 2021
Table 104: Japan Market Value (US$ Million), By Drug Type 2022 to 2032
Table 105: Japan Market Value (US$ Million), By Mode of Administration 2017 to 2021
Table 106: Japan Market Value (US$ Million), By Mode of Administration 2022 to 2032
Table 107: Japan Market Value (US$ Million), By Distribution Channel 2017 to 2021
Table 108: Japan Market Value (US$ Million), By Distribution Channel 2022 to 2032
Table 109: APEJ Market Value (US$ Million), By Country 2017 to 2021
Table 110: APEJ Market Value (US$ Million), By Country 2022 to 2032
Table 111: APEJ Market Value (US$ Million), By Indication 2017 to 2021
Table 112: APEJ Market Value (US$ Million), By Indication 2022 to 2032
Table 113: APEJ Market Value (US$ Million), By Drug Type 2017 to 2021
Table 114: APEJ Market Value (US$ Million), By Drug Type 2022 to 2032
Table 115: APEJ Market Value (US$ Million), By Mode of Administration 2017 to 2021
Table 116: APEJ Market Value (US$ Million), By Mode of Administration 2022 to 2032
Table 117: APEJ Market Value (US$ Million), By Distribution Channel 2017 to 2021
Table 118: APEJ Market Value (US$ Million), By Distribution Channel 2022 to 2032
Table 119: MEA Market Value (US$ Million), By Country 2017 to 2021
Table 120: MEA Market Value (US$ Million), By Country 2022 to 2032
Table 121: MEA Market Value (US$ Million), By Indication 2017 to 2021
Table 122: MEA Market Value (US$ Million), By Indication 2022 to 2032
Table 123: MEA Market Value (US$ Million), By Drug Type 2017 to 2021
Table 124: MEA Market Value (US$ Million), By Drug Type 2022 to 2032
Table 125: MEA Market Value (US$ Million), By Mode of Administration 2017 to 2021
Table 126: MEA Market Value (US$ Million), By Mode of Administration 2022 to 2032
Table 127: MEA Market Value (US$ Million), By Distribution Channel 2017 to 2021
Table 128: MEA Market Value (US$ Million), By Distribution Channel 2022 to 2032
Figure 01: Global Market Value (US$ Million), 2017 to 2021
Figure 02: Global Market Value (US$ Million) Forecast, 2022 to 2032
Figure 03: Global Market Value (US$ Million) and Y-o-Y, 2022 to 2032
Figure 04: Global Alzheimer’s Disease Segment Market Value (US$ Million) By Region, 2017 to 2021
Figure 05: Global Alzheimer’s Disease Segment Market Value (US$ Million) By Region, 2022 to 2032
Figure 06: Global Alzheimer’s Disease Segment Y-o-Y Growth Rate, By Region, 2022 to 2032
Figure 07: Global Narcolepsy Segment Market Value (US$ Million) By Region, 2017 to 2021
Figure 08: Global Narcolepsy Segment Market Value (US$ Million) By Region, 2022 to 2032
Figure 09: Global Narcolepsy Segment Y-o-Y Growth Rate, By Region, 2022 to 2032
Figure 10: Global Multiple Sclerosis Segment Market Value (US$ Million) By Region, 2017 to 2021
Figure 11: Global Multiple Sclerosis Segment Market Value (US$ Million) By Region, 2022 to 2032
Figure 12: Global Multiple Sclerosis Segment Y-o-Y Growth Rate, By Region, 2022 to 2032
Figure 13: Global Amyotrophic Lateral Sclerosis Segment Market Value (US$ Million) By Region, 2017 to 2021
Figure 14: Global Amyotrophic Lateral Sclerosis Segment Market Value (US$ Million) By Region, 2022 to 2032
Figure 15: Global Amyotrophic Lateral Sclerosis Segment Y-o-Y Growth Rate, By Region, 2022 to 2032
Figure 16: Global Other Indications Segment Market Value (US$ Million) By Region, 2017 to 2021
Figure 17: Global Other Indications Segment Market Value (US$ Million) By Region, 2022 to 2032
Figure 18: Global Other Indications Segment Y-o-Y Growth Rate, By Region, 2022 to 2032
Figure 19: Global Biologics Segment Market Value (US$ Million) By Region, 2017 to 2021
Figure 20: Global Biologics Segment Market Value (US$ Million) By Region, 2022 to 2032
Figure 21: Global Biologics Segment Y-o-Y Growth Rate, By Region, 2022 to 2032
Figure 22: Global Organic Compounds Segment Market Value (US$ Million) By Region, 2017 to 2021
Figure 23: Global Organic Compounds Segment Market Value (US$ Million) By Region, 2022 to 2032
Figure 24: Global Organic Compounds Segment Y-o-Y Growth Rate, By Region, 2022 to 2032
Figure 25: Global Injectables Segment Market Value (US$ Million) By Region, 2017 to 2021
Figure 26: Global Injectables Segment Market Value (US$ Million) By Region, 2022 to 2032
Figure 27: Global Injectables Segment Y-o-Y Growth Rate, By Region, 2022 to 2032
Figure 28: Global Oral Segment Market Value (US$ Million) By Region, 2017 to 2021
Figure 29: Global Oral Segment Market Value (US$ Million) By Region, 2022 to 2032
Figure 30: Global Oral Segment Y-o-Y Growth Rate, By Region, 2022 to 2032
Figure 31: Global Others Segment Market Value (US$ Million) By Region, 2017 to 2021
Figure 32: Global Others Segment Market Value (US$ Million) By Region, 2022 to 2032
Figure 33: Global Others Segment Y-o-Y Growth Rate, By Region, 2022 to 2032
Figure 34: Global Hospital Pharmacies Segment Market Value (US$ Million) By Region, 2017 to 2021
Figure 35: Global Hospital Pharmacies Segment Market Value (US$ Million) By Region, 2022 to 2032
Figure 36: Global Hospital Pharmacies Segment Y-o-Y Growth Rate, By Region, 2022 to 2032
Figure 37: Global Retail Pharmacies Segment Market Value (US$ Million) By Region, 2017 to 2021
Figure 38: Global Retail Pharmacies Segment Market Value (US$ Million) By Region, 2022 to 2032
Figure 39: Global Retail Pharmacies Segment Y-o-Y Growth Rate, By Region, 2022 to 2032
Figure 40: Global Online Pharmacies Segment Market Value (US$ Million) By Region, 2017 to 2021
Figure 41: Global Online Pharmacies Segment Market Value (US$ Million) By Region, 2022 to 2032
Figure 42: Global Online Pharmacies Segment Y-o-Y Growth Rate, By Region, 2022 to 2032
Figure 43: North America Market Value (US$ Million), By Country 2017 to 2021
Figure 44: North America Market Value (US$ Million), By Country 2022 to 2032
Figure 45: North America Market Value (US$ Million), By Indication 2017 to 2021
Figure 46: North America Market Value (US$ Million), By Indication 2022 to 2032
Figure 47: North America Market Value (US$ Million), By Drug Type 2017 to 2021
Figure 48: North America Market Value (US$ Million), By Drug Type 2022 to 2032
Figure 49: North America Market Value (US$ Million), By Mode of Administration 2017 to 2021
Figure 50: North America Market Value (US$ Million), By Mode of Administration 2022 to 2032
Figure 51: North America Market Value (US$ Million), By Distribution Channel 2017 to 2021
Figure 52: North America Market Value (US$ Million), By Distribution Channel 2022 to 2032
Figure 53: Latin America Market Value (US$ Million), By Country 2017 to 2021
Figure 54: Latin America Market Value (US$ Million), By Country 2022 to 2032
Figure 55: Latin America Market Value (US$ Million), By Indication 2017 to 2021
Figure 56: Latin America Market Value (US$ Million), By Indication 2022 to 2032
Figure 57: Latin America Market Value (US$ Million), By Drug Type 2017 to 2021
Figure 58: Latin America Market Value (US$ Million), By Drug Type 2022 to 2032
Figure 59: Latin America Market Value (US$ Million), By Mode of Administration 2017 to 2021
Figure 60: Latin America Market Value (US$ Million), By Mode of Administration 2022 to 2032
Figure 61: Latin America Market Value (US$ Million), By Distribution Channel 2017 to 2021
Figure 62: Latin America Market Value (US$ Million), By Distribution Channel 2022 to 2032
Figure 63: Europe Market Value (US$ Million), By Country 2017 to 2021
Figure 64: Europe Market Value (US$ Million), By Country 2022 to 2032
Figure 65: Europe Market Value (US$ Million), By Indication 2017 to 2021
Figure 66: Europe Market Value (US$ Million), By Indication 2022 to 2032
Figure 67: Europe Market Value (US$ Million), By Drug Type 2017 to 2021
Figure 68: Europe Market Value (US$ Million), By Drug Type 2022 to 2032
Figure 69: Europe Market Value (US$ Million), By Mode of Administration 2017 to 2021
Figure 70: Europe Market Value (US$ Million), By Mode of Administration 2022 to 2032
Figure 71: Europe Market Value (US$ Million), By Distribution Channel 2017 to 2021
Figure 72: Europe Market Value (US$ Million), By Distribution Channel 2022 to 2032
Figure 73: Japan Market Value (US$ Million), By Country 2017 to 2021
Figure 74: Japan Market Value (US$ Million), By Country 2022 to 2032
Figure 75: Japan Market Value (US$ Million), By Indication 2017 to 2021
Figure 76: Japan Market Value (US$ Million), By Indication 2022 to 2032
Figure 77: Japan Market Value (US$ Million), By Mode of Administration 2017 to 2021
Figure 78: Japan Market Value (US$ Million), By Drug Type 2022 to 2032
Figure 79: Japan Market Value (US$ Million), By Mode of Administration 2017 to 2021
Figure 80: Japan Market Value (US$ Million), By Mode of Administration 2022 to 2032
Figure 81: Japan Market Value (US$ Million), By Distribution Channel 2017 to 2021
Figure 82: Japan Market Value (US$ Million), By Distribution Channel 2022 to 2032
Figure 83: APEJ Market Value (US$ Million), By Country 2017 to 2021
Figure 84: APEJ Market Value (US$ Million), By Country 2022 to 2032
Figure 85: APEJ Market Value (US$ Million), By Indication 2017 to 2021
Figure 86: APEJ Market Value (US$ Million), By Indication 2022 to 2032
Figure 87: APEJ Market Value (US$ Million), By Drug Type 2017 to 2021
Figure 88: APEJ Market Value (US$ Million), By Drug Type 2022 to 2032
Figure 89: APEJ Market Value (US$ Million), By Mode of Administration 2017 to 2021
Figure 90: APEJ Market Value (US$ Million), By Mode of Administration 2022 to 2032
Figure 91: APEJ Market Value (US$ Million), By Distribution Channel 2017 to 2021
Figure 92: APEJ Market Value (US$ Million), By Distribution Channel 2022 to 2032
Figure 93: MEA Market Value (US$ Million), By Country 2017 to 2021
Figure 94: MEA Market Value (US$ Million), By Country 2022 to 2032
Figure 95: MEA Market Value (US$ Million), By Indication 2017 to 2021
Figure 96: MEA Market Value (US$ Million), By Indication 2022 to 2032
Figure 97: MEA Market Value (US$ Million), By Drug Type 2017 to 2021
Figure 98: MEA Market Value (US$ Million), By Drug Type 2022 to 2032
Figure 99: MEA Market Value (US$ Million), By Mode of Administration 2017 to 2021
Figure 100: MEA Market Value (US$ Million), By Mode of Administration 2022 to 2032
Figure 101: MEA Market Value (US$ Million), By Distribution Channel 2017 to 2021
Figure 102: MEA Market Value (US$ Million), By Distribution Channel 2022 to 2032


Full Research Suite comprises of:
Market outlook & trends analysis
Interviews & case studies
Strategic recommendations
Vendor profiles & capabilities analysis
5-year forecasts
8 regions and 60+ country-level data splits
Market segment data splits
12 months of continuous data updates
DELIVERED AS:
PDF EXCEL ONLINE
Industry Share Analysis for Rare Neurological Disease Treatment Providers
Rare-earth Barium Copper Oxide (REBCO) Wire Market Size and Share Forecast Outlook 2025 to 2035
Rare Gas Market Size and Share Forecast Outlook 2025 to 2035
Rare Sugar Market Size and Share Forecast Outlook 2025 to 2035
Rare NRG1 Fusion Market Size and Share Forecast Outlook 2025 to 2035
Competitive Overview of Rare Earth Elements Companies
Rare Earth Metals Market Demand & Trends 2024-2034
Rare Disease Clinical Trials Market Size and Share Forecast Outlook 2025 to 2035
Rare Disease Gene Therapy Market
Rare Inflammatory Disease Treatment Market Size and Share Forecast Outlook 2025 to 2035
Rare Gastrointestinal Diseases Treatment Market Trends and Forecast 2025 to 2035
Infrared Heating Pad Market Size and Share Forecast Outlook 2025 to 2035
Infrared Thermography Market Size and Share Forecast Outlook 2025 to 2035
Infrared Thermometer Market Growth – Trends & Forecast 2025 to 2035
Infrared Search and Track (IRST) Systems Market Analysis - Growth & Forecast 2025 to 2035
Infrared Sensors Market Analysis – Growth & Trends 2025 to 2035
Infrared (IR) LEDs Market by Component by Application & Region Forecast till 2035
Infrared Imaging Market
Mid-infrared Lasers Market Analysis - Growth & Trends 2025 to 2035
Near Infrared Absorbing Material Market Growth – Trends & Forecast 2024-2034

Thank you!
You will receive an email from our Business Development Manager. Please be sure to check your SPAM/JUNK folder too.
Chat With
MaRIA