The rare gas market is projected to grow from USD 4.1 billion in 2025 to USD 6.8 billion by 2035, registering a CAGR of 5.2%. The market is driven by increasing adoption of high-purity specialty gases and critical industrial gas solutions, particularly across metal fabrication, electronics assembly, and healthcare diagnostics. Argon will dominate, with a 44.0% market share, while the manufacturing sector leads the end-use segment with 38.0% of the market.
The demand for argon is largely driven by its use in welding and metal fabrication, essential for automotive, aerospace, and general manufacturing. Additionally, electronics manufacturing, including semiconductor fabrication and display manufacturing, drives significant growth, particularly for gases like neon and helium. Helium remains critical for MRI systems in healthcare, contributing to 18.0% of demand.
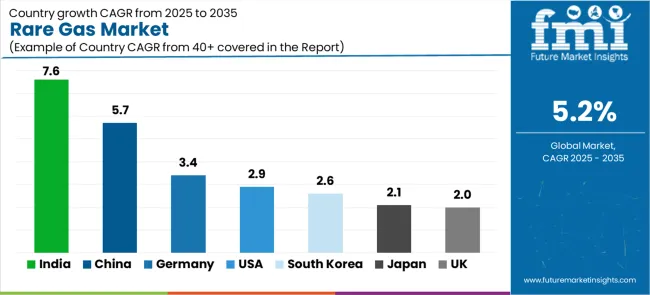
Asia Pacific leads the market, with India (7.6% CAGR) and China (5.7% CAGR) driving growth, especially in electronics manufacturing and automotive welding. Germany and the United States show steady growth driven by established semiconductor industries and healthcare infrastructure.
A primary driver of growth in the rare gas market is the increasing demand from the electronics industry, particularly in the production of semiconductors and flat-panel displays. Helium, for example, is widely used in cryogenic cooling systems to cool superconducting magnets, vital in the production of MRI scanners, as well as in semiconductor manufacturing processes. As the global demand for electronic devices such as smartphones, tablets, and televisions continues to rise, the need for high-purity rare gases to ensure the efficient and reliable operation of these devices is also increasing. The growth of industries such as 5G telecommunications and data centers further fuels demand for rare gases in cooling and manufacturing applications.
Opportunities for market growth remain robust as industries continue to innovate and expand. The increasing demand for advanced technologies in electronics, healthcare, aerospace, and energy will continue to drive the need for rare gases. Innovations in gas production methods, including the use of alternative sources and improved extraction techniques, will help ensure a steady supply of rare gases while reducing costs. Furthermore, the continued development of new applications in emerging sectors such as renewable energy, quantum computing, and space exploration is expected to create new avenues for growth in the rare gas market.
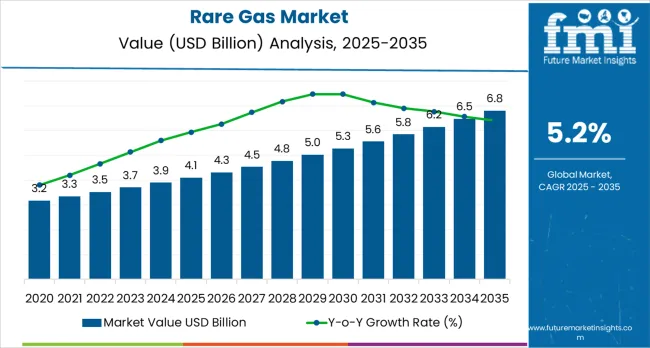
The Rare Gas market demonstrates distinct growth phases with varying market characteristics and competitive dynamics. Between 2025 and 2030, the market progresses through its technology adoption phase, expanding from USD 4.1 billion to USD 5.2 billion with steady annual increments averaging 5.2% growth. This period showcases the transition from conventional cylinder supply to advanced on-site generation systems with enhanced purity capabilities and integrated monitoring becoming mainstream features.
The 2025-2030 phase adds USD 1.1 billion to market value, representing 41% of total decade expansion. Market maturation factors include standardization of electronics manufacturing protocols, declining costs for gas purification systems, and increasing semiconductor industry awareness of ultra-high purity benefits reaching 99.9999% purity effectiveness in advanced chip fabrication applications.
Competitive landscape evolution during this period features established industrial gas companies like Linde and Air Liquide expanding their rare gas portfolios while specialty suppliers focus on electronics-grade development and enhanced purification capabilities.
From 2030 to 2035, market dynamics shift toward advanced supply integration and global electronics expansion, with growth continuing from USD 5.2 billion to USD 6.8 billion, adding USD 1.6 billion or 59% of total expansion.
This phase transition centers on specialized ultra-high purity systems, integration with automated semiconductor fabrication networks, and deployment across diverse manufacturing scenarios, becoming standard rather than specialized applications. The competitive environment matures with focus shifting from basic gas supply to comprehensive manufacturing optimization systems and integration with real-time quality monitoring platforms.
The market demonstrates strong fundamentals with argon systems capturing a dominant share through versatile industrial applications and welding optimization capabilities. Cylinder supply mode drives primary distribution, supported by established logistics infrastructure and flexible delivery requirements.
Manufacturing end-use leads demand through metal fabrication, automotive production, and industrial welding technology requirements. Geographic expansion remains concentrated in developed markets with established industrial infrastructure, while emerging economies show accelerating adoption rates driven by electronics manufacturing expansion and rising semiconductor production standards.
At-a-Glance Metrics
| Metric | Value |
|---|---|
| Market Value (2025) | USD 4.1 billion |
| Market Forecast (2035) | USD 6.8 billion |
| Growth Rate | 5.2% CAGR |
| Leading Technology | Argon Gas Type |
| Primary Supply Mode | Cylinders Segment |
| Primary End Use | Manufacturing Segment |
Market expansion rests on three fundamental shifts driving adoption across manufacturing and electronics sectors. First, semiconductor fabrication demand creates compelling operational advantages through ultra-high purity rare gases that provide immediate process chamber atmosphere control without contamination, enabling chip manufacturers to meet yield standards while maintaining production throughput and reducing defect rates. Second, industrial welding modernization accelerates as metal fabricators worldwide seek advanced shielding gases that complement automated welding processes, enabling precise arc stability and weld quality that align with automotive and aerospace manufacturing standards.
Third, medical imaging enhancement drives adoption from healthcare facilities requiring reliable helium supply that minimizes MRI system downtime while maintaining operational productivity during diagnostic imaging and patient care operations. However, growth faces headwinds from helium supply constraints that vary across extraction sources regarding geopolitical availability and production economics, which may limit supply reliability in certain regions. Specialty gas price volatility also persists regarding neon sourcing and krypton availability that may increase operational costs for electronics manufacturers, affecting process economics and competitiveness.
The rare gas market represents a critical industrial materials opportunity driven by expanding semiconductor manufacturing, advanced welding technology adoption, and medical imaging infrastructure modernization. As electronics manufacturers seek ultra-high purity process gases, metal fabricators require reliable shielding gas supply, and healthcare facilities demand consistent helium availability, rare gases are evolving from commodity industrial inputs to strategic materials ensuring production quality and operational reliability.
The market's growth trajectory from USD 4.1 billion in 2025 to USD 6.8 billion by 2035 at a 5.2% CAGR reflects fundamental shifts in electronics manufacturing requirements and industrial production standards. Geographic expansion opportunities are pronounced in Asia Pacific markets, while the dominance of argon (44.0% market share), cylinders supply (67.3% share), and manufacturing applications (38.7% share) provides clear strategic focus areas.
Strengthening the dominant argon segment (44.0% market share) through enhanced purification capabilities, optimized welding formulations, and integration with automated metal fabrication infrastructure. This pathway focuses on shielding gas performance optimization, metal transfer stability improvement, extending weld quality to aerospace and automotive specifications, and developing specialized mixtures for diverse alloy welding applications. Market leadership consolidation through production scale advantages and distribution network density enables competitive positioning while defending against regional specialty gas suppliers. Expected revenue pool: USD 85-115 million
Rapid industrial growth across India (7.6% CAGR) and China (5.7% CAGR) creates substantial opportunities through semiconductor fabrication capacity, electronics assembly expansion, and automotive component welding requiring diverse rare gas supply. Growing fab investments, display manufacturing, and industrial production drive sustained demand for high-purity argon, neon, and specialty gases. Regional supply infrastructure optimization reduces logistics costs while enabling responsive technical service. Expected revenue pool: USD 75-105 million
Expansion within helium segment (26.0% market share) through MRI system supply agreements, aerospace application development, and specialty cooling requirements addressing medical imaging reliability and scientific research demands. This pathway encompasses long-term healthcare facility contracts, recycling system integration, and comprehensive supply security programs for critical helium applications. Premium positioning reflects supply scarcity and comprehensive logistics support. Expected revenue pool: USD 65-90 million
Strategic expansion of neon segment (12.0% market share) requires ultra-high purification technologies, Ukrainian supply diversification, and specialized production systems addressing excimer laser lithography in advanced semiconductor nodes. This pathway encompasses alternative sourcing strategies, purification facility investments, and long-term fab supply agreements for critical photolithography applications. Premium pricing reflects supply constraints and semiconductor criticality. Expected revenue pool: USD 55-80 million
Strengthening cylinder supply mode (67.3% market share) through logistics efficiency improvements, cylinder fleet management optimization, and last-mile delivery capabilities addressing diverse customer requirements across industrial, electronics, and healthcare sectors. This pathway encompasses digital tracking systems, automated refilling networks, and comprehensive cylinder maintenance supporting flexible gas delivery. Competitive positioning reflects distribution density advantages and customer service capabilities. Expected revenue pool: USD 50-70 million
Development of on-site and bulk supply modes (26.7% combined share) addressing large-volume manufacturing facilities, semiconductor fabs, and industrial complexes requiring dedicated gas production and supply infrastructure. This pathway encompasses build-own-operate agreements, cryogenic bulk storage, and micro-bulk distribution systems for medium-volume customers. Premium positioning reflects long-term contract structures and capital investment requirements supporting dedicated supply infrastructure. Expected revenue pool: USD 45-65 million
Expansion into krypton (10.0% share) and xenon (8.0% share) applications through specialty lighting, laser technology, and advanced semiconductor processes requiring ultra-rare gases with unique properties. This pathway encompasses ion propulsion systems, medical imaging contrast agents, and high-efficiency lighting demanding premium-grade rare gases. Technology differentiation through specialized purification and handling enables diversified revenue streams while accessing high-value niche applications. Expected revenue pool: USD 40-55 million
Primary Classification: The market segments by rare gas type into Argon, Helium, Neon, Krypton, and Xenon categories, representing the evolution from basic industrial shielding gases to ultra-rare specialty gases for comprehensive high-technology applications.
Secondary Classification: Supply mode segmentation divides the market into Cylinders, Bulk &Micro-bulk, Drum Tanks, and On-site categories, reflecting distinct requirements for volume capacity, delivery logistics, and customer infrastructure.
Tertiary Classification: End-use segmentation covers Manufacturing, Electronics, Healthcare, Laser, and Lighting sectors, addressing specific industry requirements and application characteristics.
Regional Classification: Geographic distribution spans Asia Pacific, Europe, North America, and other regions, with developing markets leading growth while mature economies show steady expansion driven by advanced manufacturing and healthcare infrastructure.
The segmentation structure reveals technology progression from standard welding gases toward ultra-high purity systems for semiconductor fabrication and medical imaging, while supply diversity spans from flexible cylinder delivery to dedicated on-site generation requiring substantial infrastructure investment.
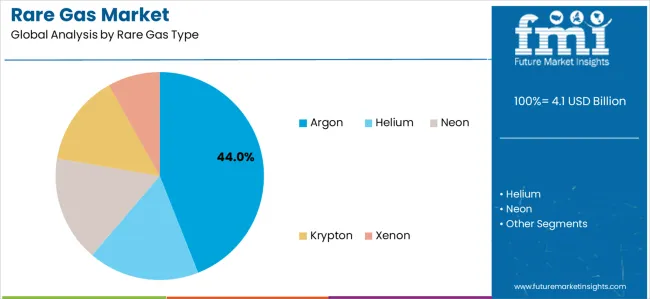
Market Position: Argon systems command the leading position in the Rare Gas market with approximately 44.0% market share through versatile industrial applications, including excellent shielding properties, cost-effective availability, and chemical inertness that enable manufacturers to achieve optimal welding quality across diverse metal fabrication and manufacturing environments.
Value Drivers: The segment benefits from industrial preference for reliable shielding gases that provide consistent arc stability, reduced oxidation, and manufacturing efficiency optimization without requiring exotic gas mixtures. Broad application compatibility enables usage across TIG welding, MIG processes, and plasma cutting, where cost-effectiveness and reliable performance represent critical operational requirements for metal fabrication and automotive production.
Competitive Advantages: Argon systems differentiate through abundant natural supply from air separation, established production infrastructure, and compatibility with diverse welding technologies that enhance manufacturing flexibility while maintaining optimal weld quality suitable for automotive, aerospace, and general fabrication applications.
Key market characteristics:
Helium maintains a significant 26.0% market share through critical MRI cooling applications, leak detection requirements, and aerospace uses. Neon captures 12.0% through semiconductor excimer laser lithography and specialty lighting applications. Krypton accounts for 10.0% through high-efficiency lighting and laser technology, while xenon maintains 8.0% through specialty lighting, ion propulsion, and medical imaging contrast applications.
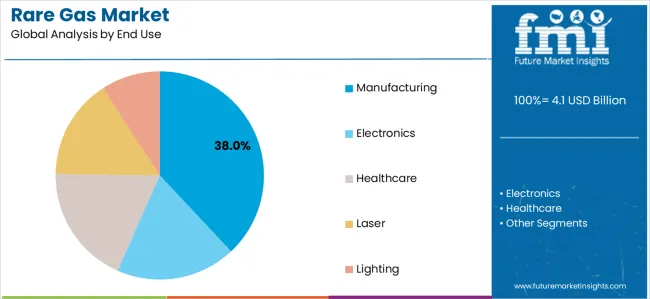
Market Context: Manufacturing end-use applications lead with approximately 38.7% market share driven by metal fabrication operations, automotive component production, and industrial welding applications that emphasize reliable shielding gas supply ensuring weld quality and production efficiency in diverse metal manufacturing facilities worldwide.
Appeal Factors: Metal fabricators prioritize argon supply reliability, technical support for welding optimization, and cost-effective gas delivery critical to production operations. The segment benefits from substantial automotive and aerospace manufacturing investment driving sustained demand for welding shielding gases and metal processing applications.
Growth Drivers: Automotive production expansion creates sustained demand for argon welding gases, while advanced manufacturing automation and aerospace component fabrication provide diversified consumption channels supporting market growth.
Market Challenges: Cyclical manufacturing activity and economic fluctuations may create periodic demand variations affecting supply contract stability.
End-use dynamics include:
Electronics end-use captures approximately 24.0% market share through semiconductor fabrication, display manufacturing, and electronics assembly requiring ultra-high purity argon, neon, and specialty gases. Healthcare accounts for 18.0% through MRI helium cooling and medical gas applications. Laser applications maintain 10.0% through industrial cutting and specialty laser technology, while lighting captures 9.3% through high-efficiency bulbs and specialty illumination requiring krypton and xenon gases.
Growth Accelerators: Semiconductor fabrication expansion drives primary adoption as ultra-high purity rare gases provide critical process atmosphere control enabling chip manufacturers to meet yield standards without contamination-related defects, supporting advanced node production and electronics missions that require stringent purity specifications for photolithography and deposition processes.
Industrial manufacturing modernization accelerates market expansion as metal fabricators seek reliable argon shielding gases that minimize oxidation while maintaining weld quality during automated welding and robotic assembly operations requiring consistent arc stability and metal transfer characteristics.
Healthcare infrastructure investment increases worldwide, creating sustained demand for helium supply that complements MRI system operations and provides operational reliability in medical imaging facilities requiring consistent cooling gas supply for superconducting magnet systems.
Growth Inhibitors: Helium supply constraints vary across natural gas processing facilities regarding extraction economics and geopolitical availability, which may create price volatility and supply reliability concerns in regions dependent on limited helium sources or experiencing export restrictions.
Neon supply concentration in specific geographic regions creates vulnerability to geopolitical disruptions affecting semiconductor manufacturing supply chains, particularly for excimer laser lithography applications requiring ultra-high purity neon. Capital-intensive infrastructure requirements for on-site generation and bulk supply systems may limit adoption in small and medium enterprises lacking investment capacity for dedicated gas production facilities.
Market Evolution Patterns: Adoption accelerates in semiconductor manufacturing and advanced welding sectors where purity requirements justify premium costs, with geographic concentration in Asia Pacific transitioning toward capacity expansion in North America and Europe driven by semiconductor onshoring and supply chain diversification programs.
Technology development focuses on enhanced purification techniques, helium recovery and recycling systems, and alternative neon sourcing strategies that optimize supply security and environmental sustainability for critical rare gas applications. Supply chain resilience initiatives intensify as semiconductor manufacturers pursue source diversification for critical gases including neon from Ukrainian production and helium from emerging LNG facilities in Africa and Middle East, while industrial customers increasingly adopt gas recycling systems reducing consumption and improving cost-effectiveness.
The market faces potential disruption if quantum computing or alternative semiconductor architectures significantly alter rare gas requirements, or if synthetic helium production becomes economically viable at scale, though current technology roadmaps continue to support strong demand trajectories across electronics, manufacturing, and healthcare applications where rare gas properties remain irreplaceable for critical processes requiring inert atmospheres, ultra-low temperatures, or specific optical and physical characteristics supporting diverse industrial and scientific applications across global manufacturing value chains requiring reliable specialty gas supply.
| Country | CAGR (2025-2035) |
|---|---|
| India | 7.6% |
| China | 5.7% |
| Germany | 3.4% |
| United States | 2.9% |
| South Korea | 2.6% |
| Japan | 2.1% |
| United Kingdom | 2.0% |
The Rare Gas market demonstrates varied regional dynamics with Growth Leaders including India (7.6% CAGR) and China (5.7% CAGR) driving expansion through electronics manufacturing capacity and automotive component welding.
Steady Performers encompass Germany (3.4% CAGR), the United States (2.9% CAGR), and South Korea (2.6% CAGR), benefiting from established semiconductor industries and advanced manufacturing adoption. Mature Markets feature Japan (2.1% CAGR) and the United Kingdom (2.0% CAGR), where precision manufacturing and healthcare infrastructure support consistent growth patterns.
Regional synthesis reveals Asia Pacific markets leading adoption through semiconductor fabrication expansion and industrial manufacturing infrastructure development, while developed economies maintain steady expansion supported by advanced manufacturing technology and healthcare infrastructure modernization. Emerging markets show accelerating growth driven by electronics assembly capacity and automotive production investments.
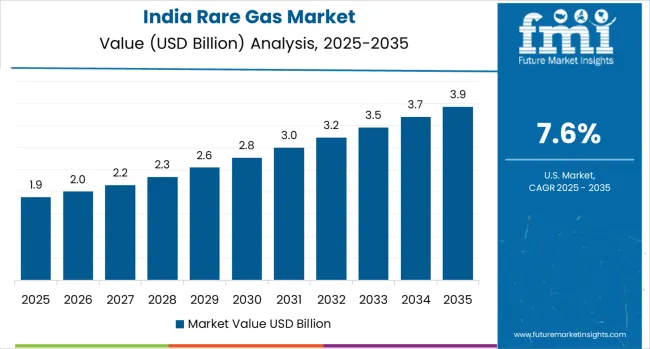
India demonstrates highest growth momentum with a 7.6% CAGR, driven by capacity additions in electronics assembly, automotive component welding operations, and airport expansion boosting helium and argon demand across major industrial centers including Bangalore, Chennai, and Gujarat. Government manufacturing incentive programs and electronics production capacity expansion create sustained demand for industrial gases supporting metal fabrication and electronics assembly, while growing healthcare infrastructure drives helium requirements for MRI installations. Airport development programs expand aviation infrastructure requiring helium and specialty gas supply.
Electronics manufacturing acceleration drives primary demand as India establishes comprehensive assembly operations for smartphones, components, and devices requiring argon and nitrogen atmospheres. Automotive sector growth creates sustained consumption through component welding, robotic assembly, and metal fabrication operations. Market expansion benefits from favorable government policies supporting domestic manufacturing through production-linked incentives and infrastructure investments positioning India as emerging rare gas consumption market.
Strategic Market Indicators:
China maintains dominant market position through massive semiconductor fabrication capacity, display manufacturing operations, and comprehensive industrial welding infrastructure representing world's largest rare gas consumer. The country demonstrates strong 5.7% CAGR growth through memory fab expansions, OLED display investments, and industrial equipment manufacturing requiring diverse rare gas supply. Major industrial centers, including Jiangsu, Guangdong, and Shanghai, showcase integrated semiconductor-to-industrial manufacturing ecosystems consuming substantial argon, neon, and specialty gas volumes.
Chinese manufacturers are developing comprehensive rare gas supply capabilities combining domestic air separation with imported neon for semiconductor applications, including ultra-high purity argon for electronics, neon for excimer lasers, and helium for cooling applications. Distribution channels through industrial gas suppliers and semiconductor material distributors expand market access, while government support for semiconductor self-sufficiency and advanced manufacturing drives sustained gas consumption across electronics and industrial applications.
Market Intelligence Brief:
Germany demonstrates steady expansion at 3.4% CAGR through automotive and machinery export production, optics and laser technology clusters, and precision manufacturing requiring consistent rare gas supply across Bavaria, Baden-Württemberg, and North Rhine-Westphalia. Automotive industry leadership drives sustained argon consumption for robotic welding and component assembly, while specialty optics and laser manufacturing create demand for krypton and xenon gases. German engineering excellence supports premium gas quality requirements and comprehensive technical service expectations.
Automotive manufacturing drives primary demand as German producers utilize argon shielding gases for automated welding operations and aluminum component fabrication supporting export-oriented production. Laser technology and precision optics clusters consume specialty gases for cutting systems and optical manufacturing. Market benefits from established industrial gas infrastructure and willingness to invest in high-purity gas systems supporting manufacturing excellence and quality standards.
Market Intelligence Brief:
The USA market demonstrates steady growth at 2.9% CAGR through foundry operations, aerospace manufacturing, semiconductor equipment production, and MRI fleet upgrades sustaining helium logistics across diverse geographic regions. Semiconductor manufacturing onshoring initiatives drive investments in electronics-grade rare gas supply infrastructure, while aerospace sector requirements support specialty gas consumption for welding and testing applications. Healthcare infrastructure modernization creates sustained helium demand for medical imaging facilities.
Technology deployment channels include industrial gas distributors supplying cylinder and bulk argon for manufacturing customers, semiconductor material suppliers providing ultra-high purity gases for fab operations, and medical gas distributors managing helium supply for healthcare facilities. Manufacturing diversification and semiconductor investment support market development across electronics, aerospace, and industrial sectors.
Performance Metrics:
South Korea demonstrates steady market development with a 2.6% CAGR, distinguished by memory chip and OLED manufacturing investments requiring high-purity neon and argon for advanced semiconductor fabrication and display production. The market prioritizes ultra-high purity specifications, consistent quality control, and comprehensive supply reliability reflecting Korean electronics industry expectations for material excellence. Corporate manufacturing expansion in memory, logic, and display sectors drives sustained rare gas consumption supporting technology leadership.
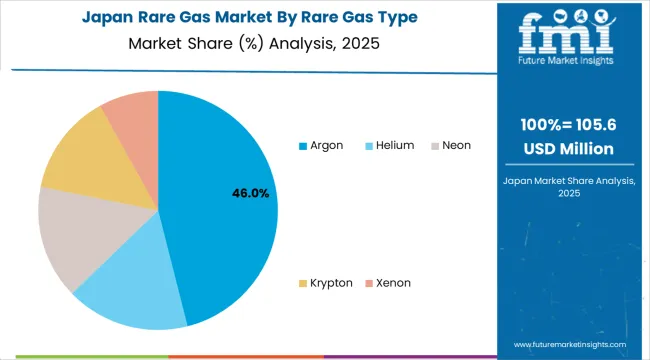
Japan demonstrates steady market development at 2.1% CAGR through advanced semiconductor fabrication operations, precision aerospace component manufacturing, automotive lightweighting applications, and comprehensive medical imaging infrastructure sustaining rare gas logistics across Tokyo-Yokohama, Osaka-Kobe, and Nagoya industrial corridors. Electronics industry modernization initiatives drive investments in ultra-high purity argon supply infrastructure, while aerospace sector requirements support specialty gas consumption for titanium welding and quality control applications. Healthcare system upgrades create sustained helium demand for hospital MRI installations and diagnostic imaging centers.
Technology deployment channels include industrial gas suppliers providing on-site generation and bulk delivery systems for manufacturing customers, semiconductor material distributors supplying carrier gases and purge applications for fab operations, and medical gas specialists managing helium recycling systems for healthcare facilities. Manufacturing excellence standards and technology leadership support market development across electronics, automotive, and precision engineering sectors.
Performance Metrics:
The UK market maintains focused growth at 2.0% CAGR through offshore wind fabrication projects, carbon capture facility construction, aerospace maintenance operations, and specialized semiconductor research programs sustaining rare gas logistics across Midlands manufacturing clusters, Scottish energy corridors, and Southeast aerospace facilities.
Renewable energy infrastructure investments drive shielding gas demand for large-scale steel fabrication and subsea component welding, while aerospace MRO sector requirements support specialty gas consumption for turbine component repair and testing applications. Research institution expansion creates sustained demand for high-purity gases in quantum computing and advanced materials development.
Technology deployment channels include industrial gas distributors supplying bulk argon and specialty gas mixtures for energy infrastructure fabricators, aerospace gas suppliers providing certified welding gases for maintenance facilities, and research-grade gas specialists managing ultra-high purity supply for university and technology development centers.
Performance Metrics:
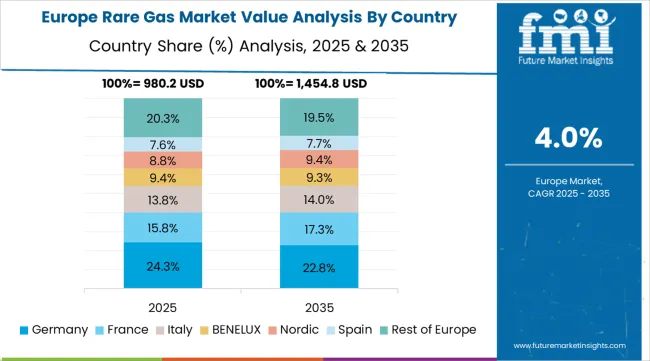
The European Rare Gas market represents a substantial portion of global consumption, driven by advanced manufacturing, automotive production, and semiconductor operations across diverse countries. Germany is expected to maintain its leadership position with approximately 24.0% of European market share, supported by automotive and machinery exports sustaining argon shielding gas consumption plus optics and laser clusters raising krypton and xenon demand in major industrial centers including Stuttgart, Munich, and Frankfurt manufacturing regions.
France follows with approximately 14.0% share driven by aerospace manufacturing and healthcare imaging infrastructure supporting helium and argon consumption. The United Kingdom holds approximately 12.5% share through aerospace MRO operations, energy transition project welding, and niche semiconductor research facilities. Italy commands approximately 11.5% share through metal fabrication and glass manufacturing requiring argon shielding gases. Spain accounts for approximately 9.5% share through automotive component production and renewable energy infrastructure build-out driving welding gas consumption.
The Netherlands maintains approximately 8.0% share through semiconductor equipment manufacturing and chemical industry clusters requiring specialty gases. Nordic countries hold approximately 7.5% share through wind turbine supply chain fabrication and healthcare infrastructure supporting argon and helium demand. Rest of Western and Eastern Europe represents approximately 13.0% through steel production, specialty lighting manufacturing, and electronics assembly operations requiring diverse rare gas supply across emerging manufacturing centers.
In Japan, the Rare Gas market prioritizes ultra-high purity argon and specialty gas systems, which capture dominant shares of semiconductor and precision manufacturing installations due to advanced features including stringent contamination control and seamless integration with existing electronics fabrication infrastructure.
Japanese semiconductor manufacturers emphasize material purity, supply reliability, and long-term quality consistency, creating demand for electronics-grade rare gases that provide parts-per-billion contamination control and consistent specifications based on advanced node fabrication requirements. Industrial-grade argon maintains strong positions in precision welding and metal fabrication where proven performance characteristics meet operational requirements supporting Japanese manufacturing excellence in automotive components and industrial equipment production.
Market Characteristics:
In South Korea, the market structure favors international industrial gas companies including Linde plc, Air Liquide, and Matheson Tri-Gas (Nippon Sanso Holdings), which maintain dominant positions through comprehensive gas portfolios and established semiconductor industry relationships supporting memory chip fabrication and OLED display manufacturing installations.
These providers offer integrated solutions combining ultra-high purity rare gases with technical support and quality assurance services appealing to Korean electronics manufacturers seeking reliable specialty gas supply. Local gas distributors capture moderate market share by providing responsive service capabilities and competitive pricing for standard industrial applications, while international suppliers focus on electronics-grade material and comprehensive technical support tailored to Korean semiconductor manufacturing characteristics and advanced node fabrication requirements.
Channel Insights:
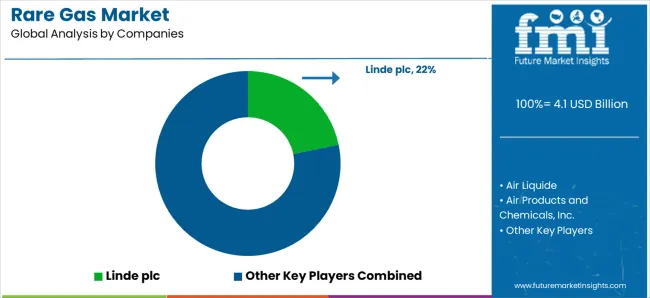
The rare gas market is characterized by 8–12 key players, with the top five companies controlling around 70–75% of the global market share, driven by their extensive production capacities, advanced technology, and strong customer relationships in industries like healthcare, electronics, and manufacturing. Competition focuses on purity levels, supply reliability, gas storage and transportation solutions, and compliance with stringent industry standards, rather than price alone. Linde plc leads the market with an 22% share, supported by its global reach, diverse portfolio of rare gases, and leadership in high-purity gas production for sectors like semiconductor manufacturing and medical applications.
Market leaders such as Linde plc, Air Liquide, Air Products and Chemicals, Inc., and Messer Group GmbH maintain dominance through large-scale production facilities, robust distribution networks, and innovation in gas applications for high-tech industries, including semiconductor, laser technology, and cryogenics. These companies also benefit from strong R&D capabilities and established customer bases in healthcare, where rare gases like xenon and krypton are used for specialized medical treatments.
Challengers such as Matheson Tri-Gas (Nippon Sanso Holdings), Iwatani Corporation, and Air Water Inc. focus on specific regional markets and niche applications, offering high-purity gases and tailored solutions for industries like aerospace and laboratory research. Smaller players like American Gas Products, Axcel Gases, and Nova Gas Technologies Inc. cater to specialized applications, providing custom rare gas solutions and establishing strong local presences in emerging markets.
| Item | Value |
|---|---|
| Quantitative Units | USD 4.1 Billion |
| Rare Gas Type | Argon, Helium, Neon, Krypton, Xenon |
| Supply Mode | Cylinders, Bulk &Micro-bulk, Drum Tanks, On-site |
| End Use | Manufacturing, Electronics, Healthcare, Laser, Lighting |
| Regions Covered | Asia Pacific, Europe, North America, Latin America, Middle East &Africa |
| Countries Covered | India, China, Germany, United States, South Korea, Japan, United Kingdom, and 25+ additional countries |
| Key Companies Profiled | Linde plc, Air Liquide, Air Products and Chemicals, Inc., Messer Group GmbH, Matheson Tri-Gas (Nippon Sanso Holdings), Iwatani Corporation, Air Water Inc., American Gas Products, Axcel Gases, and Nova Gas Technologies Inc. |
| Additional Attributes | Dollar sales by rare gas type and end-use categories, regional adoption trends across Asia Pacific, Europe, and North America, competitive landscape with industrial gas suppliers and specialty gas manufacturers, customer preferences for purity control and supply reliability, integration with manufacturing platforms and semiconductor fabrication systems, innovations in gas purification technologies and helium recovery systems, and development of on-site generation solutions with enhanced efficiency and sustainability capabilities. |
The global rare gas market is estimated to be valued at USD 4.1 billion in 2025.
The market size for the rare gas market is projected to reach USD 6.8 billion by 2035.
The rare gas market is expected to grow at a 5.2% CAGR between 2025 and 2035.
The key product types in rare gas market are argon, helium, neon, krypton and xenon.
In terms of end use, manufacturing segment to command 38.0% share in the rare gas market in 2025.


Our Research Products

The "Full Research Suite" delivers actionable market intel, deep dives on markets or technologies, so clients act faster, cut risk, and unlock growth.

The Leaderboard benchmarks and ranks top vendors, classifying them as Established Leaders, Leading Challengers, or Disruptors & Challengers.

Locates where complements amplify value and substitutes erode it, forecasting net impact by horizon

We deliver granular, decision-grade intel: market sizing, 5-year forecasts, pricing, adoption, usage, revenue, and operational KPIs—plus competitor tracking, regulation, and value chains—across 60 countries broadly.

Spot the shifts before they hit your P&L. We track inflection points, adoption curves, pricing moves, and ecosystem plays to show where demand is heading, why it is changing, and what to do next across high-growth markets and disruptive tech

Real-time reads of user behavior. We track shifting priorities, perceptions of today’s and next-gen services, and provider experience, then pace how fast tech moves from trial to adoption, blending buyer, consumer, and channel inputs with social signals (#WhySwitch, #UX).

Partner with our analyst team to build a custom report designed around your business priorities. From analysing market trends to assessing competitors or crafting bespoke datasets, we tailor insights to your needs.
Supplier Intelligence
Discovery & Profiling
Capacity & Footprint
Performance & Risk
Compliance & Governance
Commercial Readiness
Who Supplies Whom
Scorecards & Shortlists
Playbooks & Docs
Category Intelligence
Definition & Scope
Demand & Use Cases
Cost Drivers
Market Structure
Supply Chain Map
Trade & Policy
Operating Norms
Deliverables
Buyer Intelligence
Account Basics
Spend & Scope
Procurement Model
Vendor Requirements
Terms & Policies
Entry Strategy
Pain Points & Triggers
Outputs
Pricing Analysis
Benchmarks
Trends
Should-Cost
Indexation
Landed Cost
Commercial Terms
Deliverables
Brand Analysis
Positioning & Value Prop
Share & Presence
Customer Evidence
Go-to-Market
Digital & Reputation
Compliance & Trust
KPIs & Gaps
Outputs
Full Research Suite comprises of:
Market outlook & trends analysis
Interviews & case studies
Strategic recommendations
Vendor profiles & capabilities analysis
5-year forecasts
8 regions and 60+ country-level data splits
Market segment data splits
12 months of continuous data updates
DELIVERED AS:
PDF EXCEL ONLINE
Rare Gastrointestinal Diseases Treatment Market Trends and Forecast 2025 to 2035
Gas Insulated Switchgear (GIS) Bushing Market Size and Share Forecast Outlook 2025 to 2035
Gas Discharge Tube (GDT) Arresters Market Size and Share Forecast Outlook 2025 to 2035
Rare Earth FeSiMg Nodularizers Market Size and Share Forecast Outlook 2025 to 2035
Gas & Dual-Fuel Injection Systems Market Size and Share Forecast Outlook 2025 to 2035
Gas Desiccant Dehydration Unit Market Size and Share Forecast Outlook 2025 to 2035
Rare-earth Barium Copper Oxide (REBCO) Wire Market Size and Share Forecast Outlook 2025 to 2035
Gas Cylinder Market Size and Share Forecast Outlook 2025 to 2035
Gasket and Seal Market Size and Share Forecast Outlook 2025 to 2035
Gas Separation Membrane Market Size and Share Forecast Outlook 2025 to 2035
Gas Jet Compressor Market Size and Share Forecast Outlook 2025 to 2035
Gas Fired Water-Tube Food Processing Boiler Market Size and Share Forecast Outlook 2025 to 2035
Gas Fired Real Estate Generator Market Size and Share Forecast Outlook 2025 to 2035
Gastric-soluble Hollow Capsules Market Size and Share Forecast Outlook 2025 to 2035
Gas Cooling System Market Analysis - Size, Share, and Forecast Outlook 2025 to 2035
Gasoline Gensets Market Size and Share Forecast Outlook 2025 to 2035
Gas Insulated Smart Ring Main Unit Market Size and Share Forecast Outlook 2025 to 2035
Gas Turbine Oil Market Size and Share Forecast Outlook 2025 to 2035
Gas Telecom Generator Market Size and Share Forecast Outlook 2025 to 2035
Gas Insulated Ring Main Unit Market Size and Share Forecast Outlook 2025 to 2035

Thank you!
You will receive an email from our Business Development Manager. Please be sure to check your SPAM/JUNK folder too.
Chat With
MaRIA