Reports

- Global Locations -

Headquarters

Future Market Insights, Inc.

Christiana Corporate, 200
Continental Drive, Suite 401,
Newark, Delaware - 19713,
United States

T: +1-347-918-3531

Americas

Future Market Insights, Inc.

616 Corporate Way, Suite 2-9018,
Valley Cottage, NY 10989, United States

MEA

Future Market Insights

1602-6 Jumeirah Bay X2 Tower, Plot No: JLT-PH2-X2A,
Jumeirah Lakes Towers, Dubai,
United Arab Emirates

Europe

Future Market Insights

3rd Floor, 207 Regent Street,
W1B 3HH London
United Kingdom

T: + 44 (0) 20 8123 9659

Asia Pacific

Future Market Insights

IndiaLand Global Tech Park, Unit UG-1, Behind Grand HighStreet, Phase 1, Hinjawadi, MH, Pune – 411057, India

Rare NRG1 Fusion Market Snapshot (2023 to 2033)

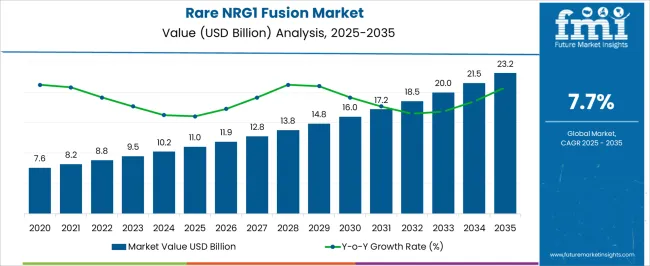
The global Rare NRG1 fusion market is expected to surpass an impressive valuation of US$ 9.49 Billion in 2023 and is projected to reach US$ 20 Billion by 2033, with a CAGR of 7.73%.

Oncogenic fusions of NRG1 may cause excess accumulation of the NRG1-fusion protein at the cell surface. This causes persistent activation of ErbB receptor tyrosine kinases that drive excess activity in the mTOR and MAPK pathways and promote tumorigenesis. The NRG1 gene encodes ligands for the ERBB2 (HER2)-ERBB3 heterodimeric receptor tyrosine kinase. Gene fusions of NRG1 such as CD74-NRG1 and SLC33A2-NRG1 have been found at low frequency in a wide range of carcinomas including lung, breast, colorectal, ovarian, and pancreatic cancers and with a wide range of fusion partners.

The present treatment market for advanced tumors with NRG1 fusions comprises chemotherapy and/ or immunotherapy or novel anti-PD-1 agents. Chemotherapy offers a systemic option as a treatment owing to its ability to kill metastasized cancerous cells. Other approaches involve radiation therapy and surgery; however, these only kill the tumor cells located at a single point at a particular time.

In the year 2021, the total incident case of Rare NRG1 Fusion were 5,733 cases in the 7MM which are expected to grow during the study period, i.e., 2019 to 2032. Currently, there are no approved targeted therapies for NRG1 fusions. Standard therapy for advanced tumors harbouring NRG1 fusions remains chemotherapy and/or immunotherapy or novel anti-PD-1 or anti-PD-L1 agents. The problem with utilizing these therapies is that response tends to be suboptimal for patients with NRG1 fusions. The outcomes of preclinical studies have suggested that repurposing FDA-approved HER inhibitors, such as Afatinib (Gilotrif), may have a highly attractive therapeutic strategy for NRG1 fusion-positive tumors. However, RNA sequencing remains the cornerstone of the detection of NRG1 gene fusions owing to higher sensitivity for genetic rearrangements as compared to DNA-based methods, which often do not cover the large introns in NRG1.

MM-121/Seribantumab, Zenocutuzumab/MCLA-128, and HMBD-001 are some promising therapies in the Rare NRG1 fusion pipeline.

Out of all the Rare NRG1 Fusion emerging therapies, Zenocutuzumab is expected to occupy the maximum share of the market owing to novel MoA, efficiency demonstrated in the ongoing trials, and also the early mover advantage. Further, this therapy is in the Phase II stage of clinical development leveraging its competitive advantage.

Currently, a few pharmaceutical companies have indulged themselves in the Rare NRG1 Fusion Market looking at the tremendous potential discovery of the NRG1 fusions are expected to offer. Key pharmaceutical players such as Rain Therapeutics, Elevation Oncology, Merus, Eli Lilly and Company, AVEO Oncology, Hummingbird Bioscience, and several others are evaluating their candidates in different stages of clinical development for the management of Rare NRG1 Fusions.

Report Attribute Details
Expected Market Value (2023) US$ 9.49 Billion
Anticipated Forecast Value (2033) US$ 20 Billion
Projected Growth Rate (2023 to 2033) CAGR 7.73%

Don't pay for what you don't need

Customize your report by selecting specific countries or regions and save 30%!

2018 to 2022 Rare NRG1 Fusion Demand Analysis vs. Forecast 2023 to 2033

The Rare NRG1 fusion market was valued at US$ 6 Billion in 2018 while growing at a CAGR of 6.61%. Technological advancements in the diagnosis and treatment of various cancers have opened up new prospects for the Rare NRG1 Fusion market which are augmenting market growth.

Further, Standard diagnostic procedures are aiding in market expansion. Considering these new advancements in Oncology, the market for Rare NRG1 Fusion is set to achieve a valuation of USD 20 billion with a CAGR of 7.73% by the end of 2033.

Which are Some Prominent Drivers of the Rare NRG1 Fusion Market?

Standard diagnostic protocols to fuel the market expansion

The dynamics of the Rare NRG1 Fusion Market are anticipated to revolutionize in the coming decade owing to the occurrence of such fusions in approximately 0.2% of solid tumors and other invasive tumors. Rare NRG1 Fusion is nothing short of a potential agent for a tumor-agnostic development approach.

Further, the Rare NRG1 Fusion Market is still in its innate state with only a handful of pharmaceutical companies operating in the domain, laying forward immense opportunities for other pharma companies to exploit which will augment the market growth.

Also, standard diagnostic protocols are anticipated to act as a major driver in the steady, smooth growth of the Rare NRG1 Fusion Market size. Additionally, a Rise in the number of research projects for the development of innovative tools and solutions that encourage early detection of tumour-causing mutations is expected to influence substantial growth of the Rare NRG1 Fusion market over the forecast period.

Sabyasachi Ghosh
Sabyasachi Ghosh

Principal Consultant

Talk to Analyst

Find your sweet spots for generating winning opportunities in this market.

What are the Challenges Projected to be Faced by the Market?

Difficulty in conducting clinical trials is holding back growth

The rarity of fusions undoubtedly in itself is a challenge that makes it difficult for researchers to study and conduct clinical trials, and the diversity of NRG1 fusions makes it difficult to diagnose or detect. These concerns are creating challenges for the market expansion of Rare NRG1 Fusion.

The surge in the use of rebuilt diagnostic imaging restricts the market growth

Due to high costs and budgetary constraints, many hospitals in developing nations are not able to invest in diagnostic imaging procedures. However, due to the high demand for diagnostic imaging procedures in these countries, the hospitals that cannot afford to purchase new and advanced imaging systems, prefer to use rebuilt imaging systems. Thus, this factor is a huge challenge for the Rare NRG1 Fusion market growth during the forecast period.

Region-Wise Insights

The advent of novel cancer diagnosis methods to fuel the market in Europe

Europe is the fastest-growing region in the Rare NRG1 Fusion market. The increasing incidence of cancer cases in Europe clearly demands early detection and diagnosis of cancer. Researchers are consistently working to discover novel cancer diagnosis methods with minimal invasion. There are approximately 375000 cases of cancers detected each year, with a mortality rate of over 44.1%.

A growing number of researchers, the presence of top-tier research organizations, and pharmaceutical industry giants are all contributing to the advancement of cancer diagnostics research in the UK In addition, the COVID-19 epidemic has significantly increased public awareness of early cancer diagnosis and treatment over the past few years. The market for next-generation cancer diagnostics in the UK is strongly driven by these trends.

On the other hand, the increasing current health expenditure per capita in the European Union, which according to the World Bank, reached US$ 3476.43 (in current US$) in the year 2019, up from US$ 2636.35 in the year 2006, is projected to aid in the growth of Europe RARE NRG1 FUSION market. Besides this, the growing GDP per capita in the European Union is also anticipated to display significant growth opportunities for the Europe RARE NRG1 FUSION market during the forecast period.

Increasing geriatric population opening up new avenues in Japan

The Japan Rare NRG1 Fusion Market is predicted to witness substantial expansion during the forecast period, i.e., 2023 to 2033. The growth of the market can majorly be attributed to the growing geriatric population (aged 65 years or over) in the nation. This growing geriatric population would be in need of advanced healthcare services, which is anticipated to drive the growth of the market in the coming years.

On the other hand, the Japan Rare NRG1 Fusion Market is also poised to grow on account of the numerous opportunities generated by the rising healthcare expenditure by the government of the nation.

Get the data you need at a Fraction of the cost

Personalize your report by choosing insights you need
and save 40%!

Category wise Insights

By treatment type, Radiation therapy dominates the segment

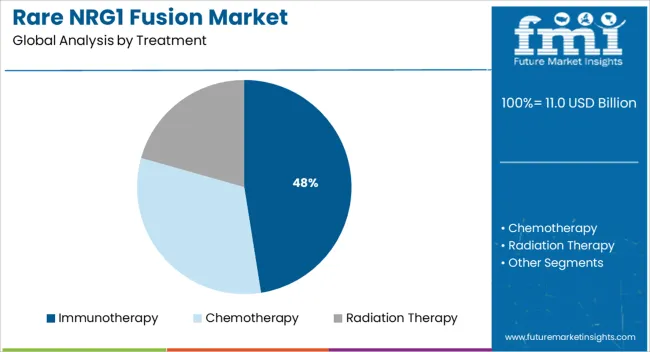
Radiation therapy is the most widely used intervention in the Rare NRG1 Fusion market with a segment share of 45%. This segment is expected to grow at a high pace compared to immunotherapy and chemotherapy owing to its high effectiveness and use in primary stages of cancer in killing cancer cells.

Start-ups in Rare NRG1 Fusion Market

  • Founded in 2014, ‘Freenome’ is a San Francisco, US-based provider of deep learning platforms for detecting circulating cancer-related markers. It is developing a platform for detecting circulating cancer-related markers in patient blood samples. Its proprietary technology uses deep learning to detect the entire range of cell-free DNA, immune cell fragments, and metabolic markers in the blood. It allows physicians to classify tumor types and develop treatment therapies. The company claims that its test performs better than the standard-of-care for four types of cancer: prostate, breast, colorectal, and lung cancer. It received funding of US$ 1.1 Billion from Roche, Perceptive Advisors, RA Capital Management, and 50 other investors.
  • Founded in 2012, ‘Lightpoint Medical’ is a UK-based developing an intraoperative imaging technology called Cerenkov Luminescence Imaging (CLI). The device has the potential to detect cancer in real-time during surgery, and thereby reduce the likelihood of cancer recurrence and the need for reoperation. It enables optical detection of Positron Emission Tomography (PET) radiopharmaceuticals, thereby combining the advantages of optical imaging (namely, very low cost and small size) with the strengths of PET imaging. It received funding of USD 17 million from Oxford technology, Gov. uk Horizon 2020, and 76 other investors.

Market Competition

Key players in the Rare NRG1 Fusion Market are Elevation Oncology, Merus, Hummingbird Bioscience, Boehringer Ingelheim, CANbridge Pharmaceuticals, Salubris Biotherapeutics, AVEO Oncology, Rain Therapeutics, Eli Lilly and Company, Jiangsu Hengrui Medicine.

Some recent developments in the market are:

  • In November 2020 - GE Healthcare collaborated with GenesisCare to develop patient outcomes for the two major health burdens worldwide, heart and cancer disease. GE Healthcare would offer MRI, CT, SPECT, PET/CT, digital mammography, and ultrasound equipment to GenesisCare’s 440+ cardiovascular and cancer disease treatment centers across Australia, the USA, Spain, and the UK.
  • In January 2020- Roche Diagnostics collaborated with Illumina to offer broad access to clinical oncology next-generation sequencing

Report Scope

Report Attribute Details
Market Value in 2023 US$ 9.49 Billion
Market Value in 2033 US$ 20 Billion
Growth Rate CAGR of 7.73% from 2023 to 2033
Base Year for Estimation 2022
Historical Data 2018 to 2022
Forecast Period 2023 to 2033
Quantitative Units Revenue in US$ Billion and CAGR from 2023 to 2033
Report Coverage Revenue Forecast, Volume Forecast, Company Ranking, Competitive Landscape, Growth Factors, Trends, and Pricing Analysis
Segments Covered
  • Treatment
  • Region
Regions Covered
  • North America
  • Latin America
  • Europe
  • Asia Pacific
  • Middle East & Africa
Key Countries Profiled
  • USA
  • Canada
  • Brazil
  • Mexico
  • Mexico
  • Germany
  • UK
  • France
  • Spain
  • Italy
  • Russia
  • China
  • Japan
  • South Korea
  • India
  • Australia
  • South Africa
  • Saudi Arabia
  • UAE
  • Israel
Key Companies Profiled
  • Elevation Oncology
  • Merus
  • Hummingbird Bioscience
  • Boehringer Ingelheim
  • CANbridge Pharmaceuticals
  • Salubris Biotherapeutics
  • AVEO Oncology
  • Rain Therapeutics
  • Eli Lilly and Company
  • Jiangsu Hengrui Medicine
Customization Available Upon Request

Key Segments Profiled in the Rare NRG1 Fusion Market Industry Survey

Rare NRG1 Fusion Market by Treatment:

  • Immunotherapy
  • Chemotherapy
  • Radiation Therapy

Rare NRG1 Fusion Market by Region:

  • North America
  • Latin America
  • Europe
  • Asia Pacific
  • Middle East & Africa

Frequently Asked Questions

What is the anticipated growth of the Rare NRG1 Fusion Market until 2033?

FMI projects the global Rare NRG1 Fusion Market to expand at a 7.73% value CAGR by 2033.

What is the estimated market value of the Rare NRG1 Fusion Market expected in 2033?

The global Rare NRG1 Fusion Market is expected to garner a market value of US$ 20 billion by 2033.

Which region is forecast to be the most lucrative for Rare NRG1 Fusion Market growth?

FMI has projected North America to be one of the most profitable regions for the Rare NRG1 Fusion Market.

Which region is expected to grow fastest during the forecast period?

Europe is expected to grow fastest during the forecast period.

Table of Content

1. Executive Summary | Rare NRG1 Fusion Market

    1.1. Global Market Outlook

    1.2. Demand-side Trends

    1.3. Supply-side Trends

    1.4. Technology Roadmap Analysis

    1.5. Analysis and Recommendations

2. Market Overview

    2.1. Market Coverage / Taxonomy

    2.2. Market Definition / Scope / Limitations

3. Market Background

    3.1. Market Dynamics

        3.1.1. Drivers

        3.1.2. Restraints

        3.1.3. Opportunity

        3.1.4. Trends

    3.2. Scenario Forecast

        3.2.1. Demand in Optimistic Scenario

        3.2.2. Demand in Likely Scenario

        3.2.3. Demand in Conservative Scenario

    3.3. Opportunity Map Analysis

    3.4. Product Life Cycle Analysis

    3.5. Investment Feasibility Matrix

    3.6. PESTLE and Porter’s Analysis

    3.7. Regulatory Landscape

        3.7.1. By Key Regions

        3.7.2. By Key Countries

    3.8. Regional Parent Market Outlook

4. Global Market Analysis 2017 to 2022 and Forecast, 2023 to 2033

    4.1. Historical Market Size Value (US$ Million) Analysis, 2017 to 2022

    4.2. Current and Future Market Size Value (US$ Million) Projections, 2023 to 2033

        4.2.1. Y-o-Y Growth Trend Analysis

        4.2.2. Absolute $ Opportunity Analysis

5. Global Market Analysis 2017 to 2022 and Forecast 2023 to 2033, By Treatment

    5.1. Introduction / Key Findings

    5.2. Historical Market Size Value (US$ Million) Analysis By Treatment, 2017 to 2022

    5.3. Current and Future Market Size Value (US$ Million) Analysis and Forecast By Treatment, 2023 to 2033

        5.3.1. Chemotherapy

        5.3.2. Immunotherapy

        5.3.3. Radiation Therapy

    5.4. Y-o-Y Growth Trend Analysis By Treatment, 2017 to 2022

    5.5. Absolute $ Opportunity Analysis By Treatment, 2023 to 2033

6. Global Market Analysis 2017 to 2022 and Forecast 2023 to 2033, By Region

    6.1. Introduction

    6.2. Historical Market Size Value (US$ Million) Analysis By Region, 2017 to 2022

    6.3. Current Market Size Value (US$ Million) Analysis and Forecast By Region, 2023 to 2033

        6.3.1. North America

        6.3.2. Latin America

        6.3.3. Europe

        6.3.4. Asia Pacific

        6.3.5. Middle East and Africa

    6.4. Market Attractiveness Analysis By Region

7. North America Market Analysis 2017 to 2022 and Forecast 2023 to 2033, By Country

    7.1. Historical Market Size Value (US$ Million) Trend Analysis By Market Taxonomy, 2017 to 2022

    7.2. Market Size Value (US$ Million) Forecast By Market Taxonomy, 2023 to 2033

        7.2.1. By Country

            7.2.1.1.United States of America

            7.2.1.2. Canada

        7.2.2. By Treatment

    7.3. Market Attractiveness Analysis

        7.3.1. By Country

        7.3.2. By Treatment

    7.4. Key Takeaways

8. Latin America Market Analysis 2017 to 2022 and Forecast 2023 to 2033, By Country

    8.1. Historical Market Size Value (US$ Million) Trend Analysis By Market Taxonomy, 2017 to 2022

    8.2. Market Size Value (US$ Million) Forecast By Market Taxonomy, 2023 to 2033

        8.2.1. By Country

            8.2.1.1. Brazil

            8.2.1.2. Mexico

            8.2.1.3. Rest of Latin America

        8.2.2. By Treatment

    8.3. Market Attractiveness Analysis

        8.3.1. By Country

        8.3.2. By Treatment

    8.4. Key Takeaways

9. Europe Market Analysis 2017 to 2022 and Forecast 2023 to 2033, By Country

    9.1. Historical Market Size Value (US$ Million) Trend Analysis By Market Taxonomy, 2017 to 2022

    9.2. Market Size Value (US$ Million) Forecast By Market Taxonomy, 2023 to 2033

        9.2.1. By Country

            9.2.1.1. Germany

            9.2.1.2. United Kingdom

            9.2.1.3. France

            9.2.1.4. Spain

            9.2.1.5. Italy

            9.2.1.6. Russia

            9.2.1.7. Rest of Europe

        9.2.2. By Treatment

    9.3. Market Attractiveness Analysis

        9.3.1. By Country

        9.3.2. By Treatment

    9.4. Key Takeaways

10. Asia Pacific Market Analysis 2017 to 2022 and Forecast 2023 to 2033, By Country

    10.1. Historical Market Size Value (US$ Million) Trend Analysis By Market Taxonomy, 2017 to 2022

    10.2. Market Size Value (US$ Million) Forecast By Market Taxonomy, 2023 to 2033

        10.2.1. By Country

            10.2.1.1. China

            10.2.1.2. Japan

            10.2.1.3. India

            10.2.1.4. South Korea

            10.2.1.5. Australia

            10.2.1.6. Rest of APAC

        10.2.2. By Treatment

    10.3. Market Attractiveness Analysis

        10.3.1. By Country

        10.3.2. By Treatment

    10.4. Key Takeaways

11. Middle East and Africa Market Analysis 2017 to 2022 and Forecast 2023 to 2033, By Country

    11.1. Historical Market Size Value (US$ Million) Trend Analysis By Market Taxonomy, 2017 to 2022

    11.2. Market Size Value (US$ Million) Forecast By Market Taxonomy, 2023 to 2033

        11.2.1. By Country

            11.2.1.1. South Africa

            11.2.1.2. Saudi Arabia

            11.2.1.3. UAE

            11.2.1.4. Israel

            11.2.1.5. Rest of MEA

        11.2.2. By Treatment

    11.3. Market Attractiveness Analysis

        11.3.1. By Country

        11.3.2. By Treatment

    11.4. Key Takeaways

12. Key Countries Market Analysis

    12.1. United States of America

        12.1.1. Pricing Analysis

        12.1.2. Market Share Analysis, 2022

            12.1.2.1. By Treatment

    12.2. Canada

        12.2.1. Pricing Analysis

        12.2.2. Market Share Analysis, 2022

            12.2.2.1. By Treatment

    12.3. Brazil

        12.3.1. Pricing Analysis

        12.3.2. Market Share Analysis, 2022

            12.3.2.1. By Treatment

    12.4. Mexico

        12.4.1. Pricing Analysis

        12.4.2. Market Share Analysis, 2022

            12.4.2.1. By Treatment

    12.5. Germany

        12.5.1. Pricing Analysis

        12.5.2. Market Share Analysis, 2022

            12.5.2.1. By Treatment

    12.6. United Kingdom

        12.6.1. Pricing Analysis

        12.6.2. Market Share Analysis, 2022

            12.6.2.1. By Treatment

    12.7. France

        12.7.1. Pricing Analysis

        12.7.2. Market Share Analysis, 2022

            12.7.2.1. By Treatment

    12.8. Spain

        12.8.1. Pricing Analysis

        12.8.2. Market Share Analysis, 2022

            12.8.2.1. By Treatment

    12.9. Italy

        12.9.1. Pricing Analysis

        12.9.2. Market Share Analysis, 2022

            12.9.2.1. By Treatment

    12.10. Russia

        12.10.1. Pricing Analysis

        12.10.2. Market Share Analysis, 2022

            12.10.2.1. By Treatment

    12.11. China

        12.11.1. Pricing Analysis

        12.11.2. Market Share Analysis, 2022

            12.11.2.1. By Treatment

    12.12. Japan

        12.12.1. Pricing Analysis

        12.12.2. Market Share Analysis, 2022

            12.12.2.1. By Treatment

    12.13. India

        12.13.1. Pricing Analysis

        12.13.2. Market Share Analysis, 2022

            12.13.2.1. By Treatment

    12.14. South Korea

        12.14.1. Pricing Analysis

        12.14.2. Market Share Analysis, 2022

            12.14.2.1. By Treatment

    12.15. Australia

        12.15.1. Pricing Analysis

        12.15.2. Market Share Analysis, 2022

            12.15.2.1. By Treatment

    12.16. South Africa

        12.16.1. Pricing Analysis

        12.16.2. Market Share Analysis, 2022

            12.16.2.1. By Treatment

    12.17. Saudi Arabia

        12.17.1. Pricing Analysis

        12.17.2. Market Share Analysis, 2022

            12.17.2.1. By Treatment

    12.18. UAE

        12.18.1. Pricing Analysis

        12.18.2. Market Share Analysis, 2022

            12.18.2.1. By Treatment

    12.19. Israel

        12.19.1. Pricing Analysis

        12.19.2. Market Share Analysis, 2022

            12.19.2.1. By Treatment

13. Market Structure Analysis

    13.1. Competition Dashboard

    13.2. Competition Benchmarking

    13.3. Market Share Analysis of Top Players

        13.3.1. By Regional

        13.3.2. By Treatment

14. Competition Analysis

    14.1. Competition Deep Dive

        14.1.1. Elevation Oncology

            14.1.1.1. Overview

            14.1.1.2. Product Portfolio

            14.1.1.3. Profitability by Market Segments

            14.1.1.4. Sales Footprint

            14.1.1.5. Strategy Overview

                14.1.1.5.1. Marketing Strategy

        14.1.2. Merus

            14.1.2.1. Overview

            14.1.2.2. Product Portfolio

            14.1.2.3. Profitability by Market Segments

            14.1.2.4. Sales Footprint

            14.1.2.5. Strategy Overview

                14.1.2.5.1. Marketing Strategy

        14.1.3. Hummingbird Bioscience

            14.1.3.1. Overview

            14.1.3.2. Product Portfolio

            14.1.3.3. Profitability by Market Segments

            14.1.3.4. Sales Footprint

            14.1.3.5. Strategy Overview

                14.1.3.5.1. Marketing Strategy

        14.1.4. Boehringer Ingelheim

            14.1.4.1. Overview

            14.1.4.2. Product Portfolio

            14.1.4.3. Profitability by Market Segments

            14.1.4.4. Sales Footprint

            14.1.4.5. Strategy Overview

                14.1.4.5.1. Marketing Strategy

        14.1.5. CANbridge Pharmaceuticals

            14.1.5.1. Overview

            14.1.5.2. Product Portfolio

            14.1.5.3. Profitability by Market Segments

            14.1.5.4. Sales Footprint

            14.1.5.5. Strategy Overview

                14.1.5.5.1. Marketing Strategy

        14.1.6. Salubris Biotherapeutics

            14.1.6.1. Overview

            14.1.6.2. Product Portfolio

            14.1.6.3. Profitability by Market Segments

            14.1.6.4. Sales Footprint

            14.1.6.5. Strategy Overview

                14.1.6.5.1. Marketing Strategy

        14.1.7. AVEO Oncology

            14.1.7.1. Overview

            14.1.7.2. Product Portfolio

            14.1.7.3. Profitability by Market Segments

            14.1.7.4. Sales Footprint

            14.1.7.5. Strategy Overview

                14.1.7.5.1. Marketing Strategy

        14.1.8. Rain Therapeutics

            14.1.8.1. Overview

            14.1.8.2. Product Portfolio

            14.1.8.3. Profitability by Market Segments

            14.1.8.4. Sales Footprint

            14.1.8.5. Strategy Overview

                14.1.8.5.1. Marketing Strategy

        14.1.9. Eli Lilly and Company

            14.1.9.1. Overview

            14.1.9.2. Product Portfolio

            14.1.9.3. Profitability by Market Segments

            14.1.9.4. Sales Footprint

            14.1.9.5. Strategy Overview

                14.1.9.5.1. Marketing Strategy

        14.1.10. Jiangsu Hengrui Medicine

            14.1.10.1. Overview

            14.1.10.2. Product Portfolio

            14.1.10.3. Profitability by Market Segments

            14.1.10.4. Sales Footprint

            14.1.10.5. Strategy Overview

                14.1.10.5.1. Marketing Strategy

15. Assumptions & Acronyms Used

16. Research Methodology

Recommendations

Healthcare

Orthopedic Oncology Market

Published : June 2023

Healthcare

Oncology Adjuvants Market

Published : March 2023

Explore Healthcare Insights

View Reports