The Rare Sugar Market is estimated to be valued at USD 2.4 billion in 2025 and is projected to reach USD 3.5 billion by 2035, registering a compound annual growth rate (CAGR) of 4.1% over the forecast period.
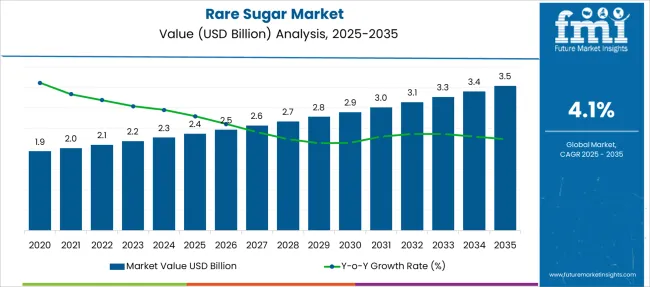
| Metric | Value |
|---|---|
| Rare Sugar Market Estimated Value in (2025 E) | USD 2.4 billion |
| Rare Sugar Market Forecast Value in (2035 F) | USD 3.5 billion |
| Forecast CAGR (2025 to 2035) | 4.1% |
The rare sugar market is experiencing steady expansion as consumer preferences shift toward healthier, low-calorie alternatives to traditional sweeteners. Rare sugars, once limited to niche pharmaceutical and biochemical research, have gained mainstream traction due to their natural origin and functional benefits. The rise in metabolic disorders, including diabetes and obesity, has encouraged formulators to explore alternatives that do not spike insulin levels.
Rare sugars offer a compelling solution by providing sweetness without compromising glycemic control, which has fueled their integration into nutraceuticals, functional foods, and beverages. Technological advancements in bioconversion and enzymatic synthesis have lowered production costs, making commercialization more feasible for large-scale applications.
Regulatory support in the form of GRAS status and positive clinical data has reinforced market confidence Future growth is expected to be sustained by innovations in fermentation processes, expansion of ingredient portfolios by global ingredient manufacturers, and increased investments in research to establish wider health-related use cases for rare sugars in human nutrition and wellness.
The market is segmented by Product and Application and region. By Product, the market is divided into D-Mannose, Allulose, Tagatose, D-Xylose, L-Arabinose, and L-Fucose. In terms of Application, the market is classified into Dietary Supplements, Cosmetics & Personal Care, Pharmaceuticals, and Food & Beverages. Regionally, the market is classified into North America, Latin America, Western Europe, Eastern Europe, Balkan & Baltic Countries, Russia & Belarus, Central Asia, East Asia, South Asia & Pacific, and the Middle East & Africa.
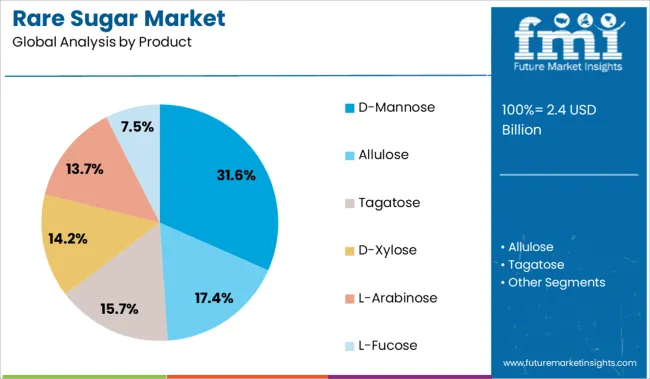
The D-Mannose subsegment is projected to hold 31.6% of the product-based revenue share in the rare sugar market in 2025, driven by its growing utilization in urinary tract health supplements and functional food products. This segment has been favored due to its natural occurrence, high bioavailability, and minimal impact on blood sugar levels. D-Mannose has been increasingly formulated in powder and capsule forms to cater to the demand for preventive health products, particularly targeting women’s wellness.
Its role in inhibiting bacterial adhesion in the urinary tract has made it a preferred ingredient among nutraceutical manufacturers focusing on natural antibiotic alternatives. Regulatory clarity and favorable consumer perception around D-Mannose as a plant-derived sugar have further boosted its inclusion in health-conscious formulations.
Additionally, its compatibility with clean-label standards and non-GMO criteria has enhanced its appeal in the premium segment As awareness grows around its non-glycemic profile and digestive health benefits, D-Mannose is expected to retain its leadership among rare sugar offerings.
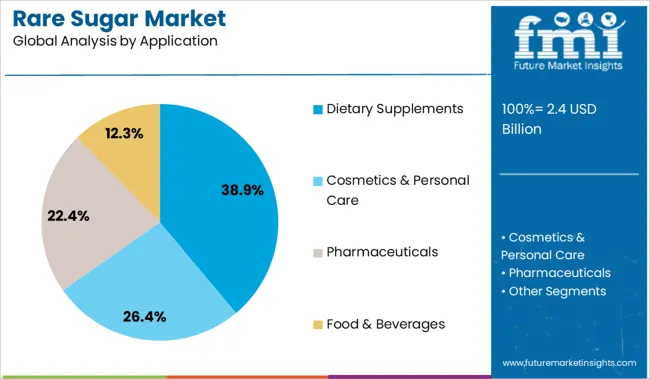
The dietary supplements application segment is expected to account for 38.9% of the total revenue share in the rare sugar market in 2025, reflecting strong demand from the health and wellness industry. The growing inclination toward preventive healthcare and self-directed nutrition has increased the integration of rare sugars into supplement formats. Rare sugars have been incorporated into capsules, chewables, and drink mixes due to their ability to support digestive balance, metabolic health, and immune modulation.
The segment’s growth has been supported by rising consumer literacy regarding functional ingredients and a growing preference for natural, sugar-alternative formulations. Manufacturers have adopted rare sugars to differentiate their products in a crowded supplement landscape, especially as sugar content becomes a decisive factor in product acceptability.
Advances in formulation science have enabled rare sugars to be combined with probiotics, vitamins, and botanicals, enhancing product efficacy As regulatory validation and clinical backing for rare sugars increase, their role in dietary supplements is anticipated to strengthen further.
Rare sugars are derived from plants, microbes, or animals, and hence pose a low chance of producing health issues. As compared to traditionally used sugar, the demand for rare sugar among health-conscious consumers is rising as it offers several health benefits.
Factors like the use of synthetic chemical routes for manufacturing rare sugars and the high cost of rare sugar are anticipated to hamper the growth of the rare sugar market share during the forecast period. On the contrary, an increase in the production capacity of rare sugar to meet the growing demand for rare sugar is expected to offer new growth opportunities to the rare sugar market players.
An increasing number of health issues linked to the consumption of simple high-calorie sugar, the rising number of diabetic patients, obesity rates, and other variables, are some of the major factors driving the rare sugar market growth.
Food companies have begun to use rare sugars like allulose as sweeteners in a variety of goods, including bakeries, confectionery, dairy, and therapeutic foods. As a result, the sales of rare sugar are projected to rise significantly over the projection period.
The demand for rare sugar is rising as nucleoside analogs, which are employed as antiviral and anticancer medicines, are synthesized using some rare sugars as building blocks. To create a similar substance, organic techniques such as enzyme conversion or fermentation are used.
Despite their limited natural abundance, rare sugar has enormous potential in a variety of uses, including as antiviral drug components which are projected to aid in the growth of rare sugar market share. Furthermore, the sales of rare sugar are growing as they are employed as low-calorie sweeteners, due to their low glycemic index.
The sales of rare sugar are anticipated to rise due to their immunosuppressive characteristics, they are also employed as anti-inflammatory drugs.
The global rare sugar market share is predicted to grow due to factors such as increased health awareness and increased understanding of the benefits of rare sugar. For example, rare sugar aids in teeth whitening by reducing the appearance of stains on teeth and promoting healthy gum development.
The sales of rare sugar are projected to develop quickly as premiumization rises and interest in more concentrated arrangements grows.
Furthermore, the wide range of applications of rare sugar, including dietary supplements, pharmaceuticals, food and drinks, and others, demand for rare sugar increased during the covid-19 outbreak, therefore, positively impacting the rare sugar market size in various parts of the world.
Strict government rules and compliances aimed at protecting consumers' interests through strict labeling and manufacturing procedures are anticipated to be a substantial restraining factor for rare sugar market growth.
The USA Food and Drug Administration, for example, established rules on the number of calories in allulose for nutrition and supplementation in April 2020. Rare sugar manufacturers must conform to tight regulations in order for their products to be classified as low sugar or low-calorie items under this legislation.
As a result of these many circumstances, the sales of rare sugar are likely to decline. However, rising consumer awareness of the importance of low-calorie and nutritious foods resulted in a supportive factor for the rare sugar market growth and the implementation of stringent regulation by key players.
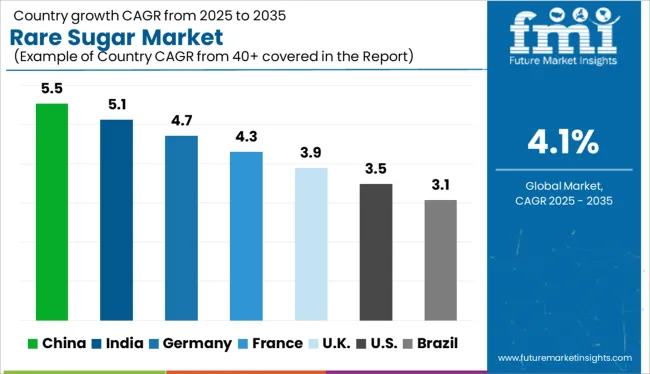
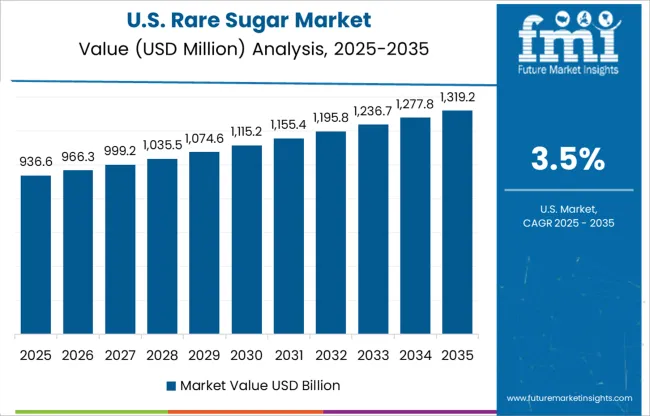
The increased prevalence of chronic diseases such as diabetes, as well as the necessity to adopt healthy eating habits such as a low-calorie diet, has fueled the USA rare sugar market size.
It is positively affecting the USA rare sugar market which USA rare sugar market is expected to reach a market value of USD 3.5 Billion by 2035.
The demand for natural cosmetics containing aromatic preservatives such as tea tree, jasmine, and rose essential oils is expected to rise, resulting in increased sales of rare sugar. Rare sugar solutions are preservatives and skin conditioners that are suitable for a variety of natural components.
Furthermore, consumers are becoming more aware of ingredients and frequently read labels before purchasing products, prompting industry players to choose high-quality, easily identifiable ingredients in the cosmetics business, which is expected to raise rare sugar demand in the USA
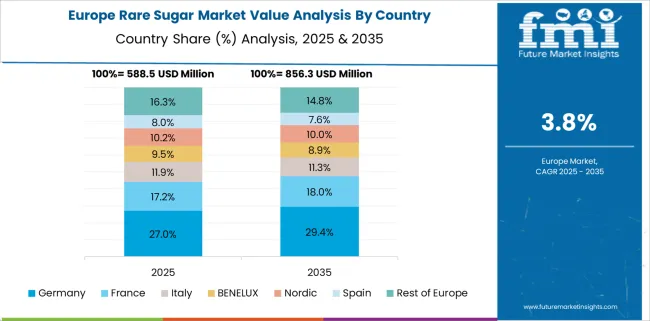
Due to increased consumer knowledge of sugar alternatives and calorie reduction in diets, the adoption of rare sugar has gained popularity, providing attractive growth potential for the German rare sugar market.
Tagatose is a sugar substitute that has gained a lot of popularity in the Philippines. In addition, the demand for low-calorie sweeteners is also increasing rapidly across the country. Tagatose is also widely used in a number of products in the food, beverage, and pharmaceutical industries, which has increased its demand among Chinese end-users.
D-mannose is expected to rise at a CAGR of 3.8% and is estimated to reach a market value of USD 3.5 Billion by 2035.
D-mannose is required for the glycosylation of key proteins and metabolic regulation. It's also used in the production of medicines for urinary tract infections because it helps to alleviate symptoms. As a result, D-numerous mannose's advantages will aid market expansion in the near future.
Rare sugars are anticipated to find widespread use in the pharmaceutical industry, as it is employed in a variety of medication manufacturing procedures. Rare sugars are used in medicine for a variety of reasons, one of which is that it does not produce any metabolic responses.
For example, D-allulose has a number of antioxidant qualities that help patients maintain a healthy blood pressure level. These factors are, therefore, promoting the application of rare sugar in the pharmaceutical industry worldwide.
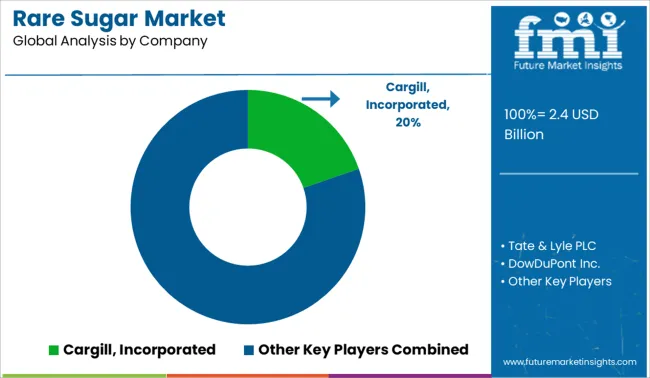
To increase position and distribution channel in the worldwide company, key players in the rare sugar market are pursuing a variety of methods, including mergers and acquisitions. Furthermore, numerous significant firms are working on new product launches and development in order to expand their capacity and get a foothold in the business.
Recent Developments in the Rare Sugar Market:
| Attributes | Details |
|---|---|
| Forecast Period | 2025 to 2035 |
| Historical Data Available for | 2020 to 2025 |
| Market Analysis | USD Billion for Value and MT for Volume |
| Key Regions Covered | North America; Latin America; Europe; Asia Pacific; Oceania; and Middle East; and Africa |
| Key Countries Covered | USA, Canada, Mexico, Germany, United Kingdom, France, Italy, Spain, China, Japan, India, South Korea, Australia, Brazil, Argentina, South Africa, and United Arab Emirates(UAE) |
| Key Segments Covered | Product, Application, and Region |
| Key Companies Profiled | Douglas Laboratories; DuPont de Nemours Inc.; Nature supplies; Sweet Cures; Hebei Huaxu; ASTRAEA Allulose; Specom Biochemical; Sanwa Starch; Tate & Lyle; Matsutami Chemical industry; Other |
| Report Coverage | Market Forecast, Company Share Analysis, Competition Intelligence, Drivers, Restraints, Opportunities and Threats Analysis, Market Dynamics and Challenges, and Strategic Growth Initiatives |
| Customization & Pricing | Available upon Request |
The global rare sugar market is estimated to be valued at USD 2.4 billion in 2025.
The market size for the rare sugar market is projected to reach USD 3.5 billion by 2035.
The rare sugar market is expected to grow at a 4.1% CAGR between 2025 and 2035.
The key product types in rare sugar market are d-mannose, allulose, tagatose, d-xylose, l-arabinose and l-fucose.
In terms of application, dietary supplements segment to command 38.9% share in the rare sugar market in 2025.


Full Research Suite comprises of:
Market outlook & trends analysis
Interviews & case studies
Strategic recommendations
Vendor profiles & capabilities analysis
5-year forecasts
8 regions and 60+ country-level data splits
Market segment data splits
12 months of continuous data updates
DELIVERED AS:
PDF EXCEL ONLINE
Rare Earth FeSiMg Nodularizers Market Size and Share Forecast Outlook 2025 to 2035
Rare-earth Barium Copper Oxide (REBCO) Wire Market Size and Share Forecast Outlook 2025 to 2035
Rare Gas Market Size and Share Forecast Outlook 2025 to 2035
Rare Disease Clinical Trials Market Size and Share Forecast Outlook 2025 to 2035
Rare NRG1 Fusion Market Size and Share Forecast Outlook 2025 to 2035
Rare Neurological Disease Treatment Market Report – Demand, Growth & Industry Outlook 2025-2035
Rare Inflammatory Disease Treatment Market Size and Share Forecast Outlook 2025 to 2035
Rare Gastrointestinal Diseases Treatment Market Trends and Forecast 2025 to 2035
Competitive Overview of Rare Earth Elements Companies
Industry Share Analysis for Rare Neurological Disease Treatment Providers
Rare Earth Metals Market Demand & Trends 2024-2034
Rare Disease Gene Therapy Market
Infrared Heating Pad Market Size and Share Forecast Outlook 2025 to 2035
Infrared Thermography Market Size and Share Forecast Outlook 2025 to 2035
Infrared Thermometer Market Growth – Trends & Forecast 2025 to 2035
Infrared Search and Track (IRST) Systems Market Analysis - Growth & Forecast 2025 to 2035
Infrared Sensors Market Analysis – Growth & Trends 2025 to 2035
Infrared (IR) LEDs Market by Component by Application & Region Forecast till 2035
Infrared Imaging Market
Mid-infrared Lasers Market Analysis - Growth & Trends 2025 to 2035

Thank you!
You will receive an email from our Business Development Manager. Please be sure to check your SPAM/JUNK folder too.
Chat With
MaRIA