Food Enzymes Market
Market Insights on Food Enzymes covering sales outlook, demand forecast & up-to-date key trends
Food Enzymes Market by Application, Type, Source & Region - Forecast 2022 - 2032
Food Enzymes Market Overview (2022-2032)
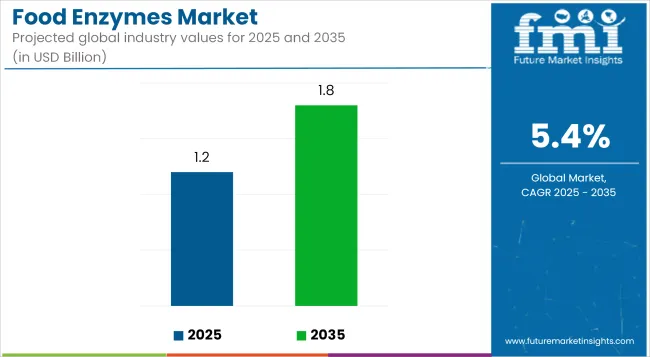
[250 Pages Report] The food enzymes market is projected to register an average CAGR of 6.5% during the forecast period.
“Demand for food enzymes supplements for ensuring high metabolism rate will keep growing as foods with digestive enzymes are preferred for the gut health.”
Food processing industries like the baking industry, brewing, and fruit juice industry are currently the largest user of food enzymes. These industries hold about 40% of the USD 400 million markets.
This market has grown as a result of rising environmental concerns, urbanization, rising disposable income, and developments in R&D activities. Furthermore, technological breakthroughs such as enzyme engineering and the introduction of genetically altered enzymes have aided the food industry's expansion.
Attributes |
Details |
Food Enzymes Market Size (2021) |
USD 2.2 Bn |
Food Enzymes Market CAGR (2022-2032) |
6.5% |
Let us know your requirement to get
100% FREE customization
What are the Factors Driving the Growth of the Food Enzymes Market?
“Small-scale manufacturers are investing in the development of super enzymes that can be scaled up to produce big volumes and technology licensors.”
The food and beverage industry is the largest market, where food enzymes services are employed globally. Enzymes are applied virtually to all the products manufactured in this industry.
Also, enzymes are substitutes for some chemical additives like potassium bromates that have been banned in so many countries. People considered super enzymes for better digestion and health.
Consumers' love for convenience food has increased the demand for food and beverage products, such as alcohol, cakes, bread, pastries, and doughnuts, which require the application of food enzymes in their production.
Find your sweet spots for generating winning opportunities in this market.
Talk to AnalystWhat are the Restraints of the Food Enzymes Market?
“The introduction of large-scale food enzyme synthesis using genetically modified microbes has heightened scrutiny of enzyme use in Europe's food and beverage industry.”
The food enzymes market growth is hampered by some abiotic factors, such as pH stability and temperature, which often alter the biochemical reactions that enhance the quality of food and beverages.
Enzyme supplements are getting increasingly popular as people's health worries grow. Aside from that, vital enzymes are gaining ground on the market.
Also, consumers are forced to reduce the consumption of foods in which food enzymes are applied, due to the increasing awareness regarding the negative impact of foods containing food enzymes. The European Union has created a guideline to regulate the usage of food enzymes in the food and beverage sector.
Previously, there was no regulation of enzymes used as processing aids at the EU level. Only Denmark and France conducted evaluations of these processing aids prior to their application in the food and beverage industry. The disparity in food enzyme testing criteria across nations led to the creation of new EU legislation.
Which is the Leading Food Enzymes Market?
“Restrictions on chemical additives and increased demand for healthy digestive enzymes has led to the demand in various regions.”
Europe and North America regions are currently the market leaders. However, Asia Pacific is expected to take over the market due to the increase in demand for food enzymes in the region.
Countries such as India, China, and Australia in the Asia Pacific region are prominent drivers of the food enzymes market owing to the changing consumer lifestyle. In Australia, the demand for food enzymes is on the rise due to the restriction in the use of chemical additives in bakery products.
The market for enzymes in food and beverages is expected to develop due to its properties as important healthy food additives. Changes in consumer preferences, as well as trade liberalization, have increased demand for meat and meat products in the country.

A unified Market Research Subscription Platform, built for today's disparate research needs.
Key Segments
Attributes |
Details |
Forecast Period |
2022-2032 |
Historical Data available for |
2015-2020 |
Market Analysis |
USD Mn for Value |
By Application |
|
By Type |
|
By Source |
|
By Region |
|
Key Player |
|
Frequently Asked Questions
What is the Growth Outlook for the Food Enzymes Market?
The food enzymes market is expected to register a CAGR of 6.5% from 2022 to 2032.
What is the Size of the Food Enzymes Market?
The food enzymes market is projected to have a value of 3.1 Bn by 2026.
Table of Content
1. Executive Summary 1.1. Global Market Outlook 1.2. Demand-side Trends 1.3. Supply-side Trends 1.4. Technology Roadmap Analysis 1.5. Analysis and Recommendations 2. Market Overview 2.1. Market Coverage / Taxonomy 2.2. Market Definition / Scope / Limitations 3. Market Background 3.1. Market Dynamics 3.1.1. Drivers 3.1.2. Restraints 3.1.3. Opportunity 3.1.4. Trends 3.2. Scenario Forecast 3.2.1. Demand in Optimistic Scenario 3.2.2. Demand in Likely Scenario 3.2.3. Demand in Conservative Scenario 3.3. Opportunity Map Analysis 3.4. Investment Feasibility Matrix 3.5. Value Chain Analysis 3.5.1. Profit Margin Analysis 3.5.2. Service Providers 3.6. PESTLE and Porter’s Analysis 3.7. Regulatory Landscape 3.7.1. By Key Regions 3.7.2. By Key Countries 3.8. Regional Parent Market Outlook 4. Global Food Enzymes Market Analysis 2017-2021 and Forecast, 2022-2032 4.1. Historical Market Size Value (US$ Mn) Analysis, 2017-2021 4.2. Current and Future Market Size Value (US$ Mn) Projections, 2022-2032 4.2.1. Y-o-Y Growth Trend Analysis 4.2.2. Absolute $ Opportunity Analysis 5. Global Food Enzymes Market Analysis 2017-2021 and Forecast 2022-2032, By Product Type 5.1. Introduction / Key Findings 5.2. Historical Market Size Value (US$ Mn) Analysis By Product Type, 2017-2021 5.3. Current and Future Market Size Value (US$ Mn) Analysis and Forecast By Product Type, 2022-2032 5.3.1. Carbohydrates 5.3.2. Protease 5.3.3. Lipase 5.4. Y-o-Y Growth Trend Analysis By Product Type, 2017-2021 5.5. Absolute $ Opportunity Analysis By Product Type, 2022-2032 Deep-dive segmentation will be available in the sample on request 6. Global Food Enzymes Market Analysis 2017-2021 and Forecast 2022-2032, By Application 6.1. Introduction / Key Findings 6.2. Historical Market Size Value (US$ Mn) Analysis By Application, 2017-2021 6.3. Current and Future Market Size Value (US$ Mn) Analysis and Forecast By Application, 2022-2032 6.3.1. Bakery and Confectionery 6.3.2. Dairy & Frozen Products 6.3.3. Oils & Fat Products 6.3.4. Fruit & Vegetable Products 6.3.5. Beverages 6.3.6. Others (Egg Products) 6.4. Y-o-Y Growth Trend Analysis By Application, 2017-2021 6.5. Absolute $ Opportunity Analysis By Application, 2022-2032 Deep-dive segmentation will be available in the sample on request 7. Global Food Enzymes Market Analysis 2017-2021 and Forecast 2022-2032, By Source 7.1. Introduction / Key Findings 7.2. Historical Market Size Value (US$ Mn) Analysis By Source, 2017-2021 7.3. Current and Future Market Size Value (US$ Mn) Analysis and Forecast By Source, 2022-2032 7.3.1. Microorganism 7.3.2. Plants 7.3.3. Animals 7.4. Y-o-Y Growth Trend Analysis By Source, 2017-2021 7.5. Absolute $ Opportunity Analysis By Source, 2022-2032 Deep-dive segmentation will be available in the sample on request 8. Global Food Enzymes Market Analysis 2017-2021 and Forecast 2022-2032, By Region 8.1. Introduction 8.2. Historical Market Size Value (US$ Mn) Analysis By Region, 2017-2021 8.3. Current Market Size Value (US$ Mn) Analysis and Forecast By Region, 2022-2032 8.3.1. North America 8.3.2. Latin America 8.3.3. Europe 8.3.4. East Asia 8.3.5. South Asia & Pacific 8.3.6. MEA 8.4. Market Attractiveness Analysis By Region 9. North America Food Enzymes Market Analysis 2017-2021 and Forecast 2022-2032, By Country 9.1. Historical Market Size Value (US$ Mn) Trend Analysis By Market Taxonomy, 2017-2021 9.2. Market Size Value (US$ Mn) Forecast By Market Taxonomy, 2022-2032 9.2.1. By Country 9.2.1.1. U.S. 9.2.1.2. Canada 9.2.2. By Product Type 9.2.3. By Application 9.2.4. By Source 9.3. Market Attractiveness Analysis 9.3.1. By Country 9.3.2. By Product Type 9.3.3. By Application 9.3.4. By Source 9.4. Key Takeaways 10. Latin America Food Enzymes Market Analysis 2017-2021 and Forecast 2022-2032, By Country 10.1. Historical Market Size Value (US$ Mn) Trend Analysis By Market Taxonomy, 2017-2021 10.2. Market Size Value (US$ Mn) Forecast By Market Taxonomy, 2022-2032 10.2.1. By Country 10.2.1.1. Mexico 10.2.1.2. Brazil 10.2.1.3. Rest of Latin America 10.2.2. By Product Type 10.2.3. By Application 10.2.4. By Source 10.3. Market Attractiveness Analysis 10.3.1. By Country 10.3.2. By Product Type 10.3.3. By Application 10.3.4. By Source 10.4. Key Takeaways 11. Europe Food Enzymes Market Analysis 2017-2021 and Forecast 2022-2032, By Country 11.1. Historical Market Size Value (US$ Mn) Trend Analysis By Market Taxonomy, 2017-2021 11.2. Market Size Value (US$ Mn) Forecast By Market Taxonomy, 2022-2032 11.2.1. By Country 11.2.1.1. Germany 11.2.1.2. Italy 11.2.1.3. France 11.2.1.4. U.K. 11.2.1.5. Spain 11.2.1.6. BENELUX 11.2.1.7. Russia 11.2.1.8. Rest of Europe 11.2.2. By Product Type 11.2.3. By Application 11.2.4. By Source 11.3. Market Attractiveness Analysis 11.3.1. By Country 11.3.2. By Product Type 11.3.3. By Application 11.3.4. By Source 11.4. Key Takeaways 12. East Asia Food Enzymes Market Analysis 2017-2021 and Forecast 2022-2032, By Country 12.1. Historical Market Size Value (US$ Mn) Trend Analysis By Market Taxonomy, 2017-2021 12.2. Market Size Value (US$ Mn) Forecast By Market Taxonomy, 2022-2032 12.2.1. By Country 12.2.1.1. China 12.2.1.2. Japan 12.2.1.3. South Korea 12.2.2. By Product Type 12.2.3. By Application 12.2.4. By Source 12.3. Market Attractiveness Analysis 12.3.1. By Country 12.3.2. By Product Type 12.3.3. By Application 12.3.4. By Source 12.4. Key Takeaways 13. South Asia & Pacific Food Enzymes Market Analysis 2017-2021 and Forecast 2022-2032, By Country 13.1. Historical Market Size Value (US$ Mn) Trend Analysis By Market Taxonomy, 2017-2021 13.2. Market Size Value (US$ Mn) Forecast By Market Taxonomy, 2022-2032 13.2.1. By Country 13.2.1.1. India 13.2.1.2. ASEAN 13.2.1.3. Australia and New Zealand 13.2.1.4. Rest of South Asia & Pacific 13.2.2. By Product Type 13.2.3. By Application 13.2.4. By Source 13.3. Market Attractiveness Analysis 13.3.1. By Country 13.3.2. By Product Type 13.3.3. By Application 13.3.4. By Source 13.4. Key Takeaways 14. MEA Food Enzymes Market Analysis 2017-2021 and Forecast 2022-2032, By Country 14.1. Historical Market Size Value (US$ Mn) Trend Analysis By Market Taxonomy, 2017-2021 14.2. Market Size Value (US$ Mn) Forecast By Market Taxonomy, 2022-2032 14.2.1. By Country 14.2.1.1. GCC Countries 14.2.1.2. Turkey 14.2.1.3. South Africa 14.2.1.4. Rest of MEA 14.2.2. By Product Type 14.2.3. By Application 14.2.4. By Source 14.3. Market Attractiveness Analysis 14.3.1. By Country 14.3.2. By Product Type 14.3.3. By Application 14.3.4. By Source 14.4. Key Takeaways 15. Key Countries Food Enzymes Market Analysis 15.1. U.S. 15.1.1. Pricing Analysis 15.1.2. Market Share Analysis, 2021 15.1.2.1. By Product Type 15.1.2.2. By Application 15.1.2.3. By Source 15.2. Canada 15.2.1. Pricing Analysis 15.2.2. Market Share Analysis, 2021 15.2.2.1. By Product Type 15.2.2.2. By Application 15.2.2.3. By Source 15.3. Mexico 15.3.1. Pricing Analysis 15.3.2. Market Share Analysis, 2021 15.3.2.1. By Product Type 15.3.2.2. By Application 15.3.2.3. By Source 15.4. Brazil 15.4.1. Pricing Analysis 15.4.2. Market Share Analysis, 2021 15.4.2.1. By Product Type 15.4.2.2. By Application 15.4.2.3. By Source 15.5. Germany 15.5.1. Pricing Analysis 15.5.2. Market Share Analysis, 2021 15.5.2.1. By Product Type 15.5.2.2. By Application 15.5.2.3. By Source 15.6. Italy 15.6.1. Pricing Analysis 15.6.2. Market Share Analysis, 2021 15.6.2.1. By Product Type 15.6.2.2. By Application 15.6.2.3. By Source 15.7. France 15.7.1. Pricing Analysis 15.7.2. Market Share Analysis, 2021 15.7.2.1. By Product Type 15.7.2.2. By Application 15.7.2.3. By Source 15.8. U.K. 15.8.1. Pricing Analysis 15.8.2. Market Share Analysis, 2021 15.8.2.1. By Product Type 15.8.2.2. By Application 15.8.2.3. By Source 15.9. Spain 15.9.1. Pricing Analysis 15.9.2. Market Share Analysis, 2021 15.9.2.1. By Product Type 15.9.2.2. By Application 15.9.2.3. By Source 15.10. BENELUX 15.10.1. Pricing Analysis 15.10.2. Market Share Analysis, 2021 15.10.2.1. By Product Type 15.10.2.2. By Application 15.10.2.3. By Source 15.11. Russia 15.11.1. Pricing Analysis 15.11.2. Market Share Analysis, 2021 15.11.2.1. By Product Type 15.11.2.2. By Application 15.11.2.3. By Source 15.12. China 15.12.1. Pricing Analysis 15.12.2. Market Share Analysis, 2021 15.12.2.1. By Product Type 15.12.2.2. By Application 15.12.2.3. By Source 15.13. Japan 15.13.1. Pricing Analysis 15.13.2. Market Share Analysis, 2021 15.13.2.1. By Product Type 15.13.2.2. By Application 15.13.2.3. By Source 15.14. South Korea 15.14.1. Pricing Analysis 15.14.2. Market Share Analysis, 2021 15.14.2.1. By Product Type 15.14.2.2. By Application 15.14.2.3. By Source 15.15. India 15.15.1. Pricing Analysis 15.15.2. Market Share Analysis, 2021 15.15.2.1. By Product Type 15.15.2.2. By Application 15.15.2.3. By Source 15.16. ASEAN 15.16.1. Pricing Analysis 15.16.2. Market Share Analysis, 2021 15.16.2.1. By Product Type 15.16.2.2. By Application 15.16.2.3. By Source 15.17. Australia and New Zealand 15.17.1. Pricing Analysis 15.17.2. Market Share Analysis, 2021 15.17.2.1. By Product Type 15.17.2.2. By Application 15.17.2.3. By Source 15.18. GCC Countries 15.18.1. Pricing Analysis 15.18.2. Market Share Analysis, 2021 15.18.2.1. By Product Type 15.18.2.2. By Application 15.18.2.3. By Source 15.19. Turkey 15.19.1. Pricing Analysis 15.19.2. Market Share Analysis, 2021 15.19.2.1. By Product Type 15.19.2.2. By Application 15.19.2.3. By Source 15.20. South Africa 15.20.1. Pricing Analysis 15.20.2. Market Share Analysis, 2021 15.20.2.1. By Product Type 15.20.2.2. By Application 15.20.2.3. By Source 16. Market Structure Analysis 16.1. Competition Dashboard 16.2. Competition Benchmarking 16.3. Market Share Analysis of Top Players 16.3.1. By Regional 16.3.2. By Product Type 16.3.3. By Application 16.3.4. By Source 17. Competition Analysis 17.1. Competition Deep Dive 17.1.1. Novozymes 17.1.1.1. Overview 17.1.1.2. Product Portfolio 17.1.1.3. Profitability by Market Segments 17.1.1.4. Sales Footprint 17.1.1.5. Strategy Overview 17.1.1.5.1. Marketing Strategy 17.1.1.5.2. Product Strategy 17.1.1.5.3. Channel Strategy 17.1.2. Danisco 17.1.2.1. Overview 17.1.2.2. Product Portfolio 17.1.2.3. Profitability by Market Segments 17.1.2.4. Sales Footprint 17.1.2.5. Strategy Overview 17.1.2.5.1. Marketing Strategy 17.1.2.5.2. Product Strategy 17.1.2.5.3. Channel Strategy 17.1.3. Royal DSM 17.1.3.1. Overview 17.1.3.2. Product Portfolio 17.1.3.3. Profitability by Market Segments 17.1.3.4. Sales Footprint 17.1.3.5. Strategy Overview 17.1.3.5.1. Marketing Strategy 17.1.3.5.2. Product Strategy 17.1.3.5.3. Channel Strategy 17.1.4. AB Enzymes 17.1.4.1. Overview 17.1.4.2. Product Portfolio 17.1.4.3. Profitability by Market Segments 17.1.4.4. Sales Footprint 17.1.4.5. Strategy Overview 17.1.4.5.1. Marketing Strategy 17.1.4.5.2. Product Strategy 17.1.4.5.3. Channel Strategy 17.1.5. Chr. Hansen 17.1.5.1. Overview 17.1.5.2. Product Portfolio 17.1.5.3. Profitability by Market Segments 17.1.5.4. Sales Footprint 17.1.5.5. Strategy Overview 17.1.5.5.1. Marketing Strategy 17.1.5.5.2. Product Strategy 17.1.5.5.3. Channel Strategy 17.1.6. DUPONT 17.1.6.1. Overview 17.1.6.2. Product Portfolio 17.1.6.3. Profitability by Market Segments 17.1.6.4. Sales Footprint 17.1.6.5. Strategy Overview 17.1.6.5.1. Marketing Strategy 17.1.6.5.2. Product Strategy 17.1.6.5.3. Channel Strategy 17.1.7. Puratos Group 17.1.7.1. Overview 17.1.7.2. Product Portfolio 17.1.7.3. Profitability by Market Segments 17.1.7.4. Sales Footprint 17.1.7.5. Strategy Overview 17.1.7.5.1. Marketing Strategy 17.1.7.5.2. Product Strategy 17.1.7.5.3. Channel Strategy 17.1.8. SternEnzym 17.1.8.1. Overview 17.1.8.2. Product Portfolio 17.1.8.3. Profitability by Market Segments 17.1.8.4. Sales Footprint 17.1.8.5. Strategy Overview 17.1.8.5.1. Marketing Strategy 17.1.8.5.2. Product Strategy 17.1.8.5.3. Channel Strategy 17.1.9. Advanced Enzymes 17.1.9.1. Overview 17.1.9.2. Product Portfolio 17.1.9.3. Profitability by Market Segments 17.1.9.4. Sales Footprint 17.1.9.5. Strategy Overview 17.1.9.5.1. Marketing Strategy 17.1.9.5.2. Product Strategy 17.1.9.5.3. Channel Strategy 17.1.10. ENMEX 17.1.10.1. Overview 17.1.10.2. Product Portfolio 17.1.10.3. Profitability by Market Segments 17.1.10.4. Sales Footprint 17.1.10.5. Strategy Overview 17.1.10.5.1. Marketing Strategy 17.1.10.5.2. Product Strategy 17.1.10.5.3. Channel Strategy 18. Assumptions & Acronyms Used 19. Research Methodology
Let us know your requirement to get
100% FREE customization
List of Tables
Table 1: Global Food Enzymes Market Value (US$ Mn) Forecast by Region, 2017-2032 Table 2: Global Food Enzymes Market Value (US$ Mn) Forecast by Product Type, 2017-2032 Table 3: Global Food Enzymes Market Value (US$ Mn) Forecast by Application, 2017-2032 Table 4: Global Food Enzymes Market Value (US$ Mn) Forecast by Source, 2017-2032 Table 5: North America Food Enzymes Market Value (US$ Mn) Forecast by Country, 2017-2032 Table 6: North America Food Enzymes Market Value (US$ Mn) Forecast by Product Type, 2017-2032 Table 7: North America Food Enzymes Market Value (US$ Mn) Forecast by Application, 2017-2032 Table 8: North America Food Enzymes Market Value (US$ Mn) Forecast by Source, 2017-2032 Table 9: Latin America Food Enzymes Market Value (US$ Mn) Forecast by Country, 2017-2032 Table 10: Latin America Food Enzymes Market Value (US$ Mn) Forecast by Product Type, 2017-2032 Table 11: Latin America Food Enzymes Market Value (US$ Mn) Forecast by Application, 2017-2032 Table 12: Latin America Food Enzymes Market Value (US$ Mn) Forecast by Source, 2017-2032 Table 13: Europe Food Enzymes Market Value (US$ Mn) Forecast by Country, 2017-2032 Table 14: Europe Food Enzymes Market Value (US$ Mn) Forecast by Product Type, 2017-2032 Table 15: Europe Food Enzymes Market Value (US$ Mn) Forecast by Application, 2017-2032 Table 16: Europe Food Enzymes Market Value (US$ Mn) Forecast by Source, 2017-2032 Table 17: East Asia Food Enzymes Market Value (US$ Mn) Forecast by Country, 2017-2032 Table 18: East Asia Food Enzymes Market Value (US$ Mn) Forecast by Product Type, 2017-2032 Table 19: East Asia Food Enzymes Market Value (US$ Mn) Forecast by Application, 2017-2032 Table 20: East Asia Food Enzymes Market Value (US$ Mn) Forecast by Source, 2017-2032 Table 21: South Asia & Pacific Food Enzymes Market Value (US$ Mn) Forecast by Country, 2017-2032 Table 22: South Asia & Pacific Food Enzymes Market Value (US$ Mn) Forecast by Product Type, 2017-2032 Table 23: South Asia & Pacific Food Enzymes Market Value (US$ Mn) Forecast by Application, 2017-2032 Table 24: South Asia & Pacific Food Enzymes Market Value (US$ Mn) Forecast by Source, 2017-2032 Table 25: MEA Food Enzymes Market Value (US$ Mn) Forecast by Country, 2017-2032 Table 26: MEA Food Enzymes Market Value (US$ Mn) Forecast by Product Type, 2017-2032 Table 27: MEA Food Enzymes Market Value (US$ Mn) Forecast by Application, 2017-2032 Table 28: MEA Food Enzymes Market Value (US$ Mn) Forecast by Source, 2017-2032
Find your sweet spots for generating winning opportunities in this market.
Talk to AnalystList of Charts
Figure 1: Global Food Enzymes Market Value (US$ Mn) by Product Type, 2022-2032 Figure 2: Global Food Enzymes Market Value (US$ Mn) by Application, 2022-2032 Figure 3: Global Food Enzymes Market Value (US$ Mn) by Source, 2022-2032 Figure 4: Global Food Enzymes Market Value (US$ Mn) by Region, 2022-2032 Figure 5: Global Food Enzymes Market Value (US$ Mn) Analysis by Region, 2017-2032 Figure 6: Global Food Enzymes Market Value Share (%) and BPS Analysis by Region, 2022-2032 Figure 7: Global Food Enzymes Market Y-o-Y Growth (%) Projections by Region, 2022-2032 Figure 8: Global Food Enzymes Market Value (US$ Mn) Analysis by Product Type, 2017-2032 Figure 9: Global Food Enzymes Market Value Share (%) and BPS Analysis by Product Type, 2022-2032 Figure 10: Global Food Enzymes Market Y-o-Y Growth (%) Projections by Product Type, 2022-2032 Figure 11: Global Food Enzymes Market Value (US$ Mn) Analysis by Application, 2017-2032 Figure 12: Global Food Enzymes Market Value Share (%) and BPS Analysis by Application, 2022-2032 Figure 13: Global Food Enzymes Market Y-o-Y Growth (%) Projections by Application, 2022-2032 Figure 14: Global Food Enzymes Market Value (US$ Mn) Analysis by Source, 2017-2032 Figure 15: Global Food Enzymes Market Value Share (%) and BPS Analysis by Source, 2022-2032 Figure 16: Global Food Enzymes Market Y-o-Y Growth (%) Projections by Source, 2022-2032 Figure 17: Global Food Enzymes Market Attractiveness by Product Type, 2022-2032 Figure 18: Global Food Enzymes Market Attractiveness by Application, 2022-2032 Figure 19: Global Food Enzymes Market Attractiveness by Source, 2022-2032 Figure 20: Global Food Enzymes Market Attractiveness by Region, 2022-2032 Figure 21: North America Food Enzymes Market Value (US$ Mn) by Product Type, 2022-2032 Figure 22: North America Food Enzymes Market Value (US$ Mn) by Application, 2022-2032 Figure 23: North America Food Enzymes Market Value (US$ Mn) by Source, 2022-2032 Figure 24: North America Food Enzymes Market Value (US$ Mn) by Country, 2022-2032 Figure 25: North America Food Enzymes Market Value (US$ Mn) Analysis by Country, 2017-2032 Figure 26: North America Food Enzymes Market Value Share (%) and BPS Analysis by Country, 2022-2032 Figure 27: North America Food Enzymes Market Y-o-Y Growth (%) Projections by Country, 2022-2032 Figure 28: North America Food Enzymes Market Value (US$ Mn) Analysis by Product Type, 2017-2032 Figure 29: North America Food Enzymes Market Value Share (%) and BPS Analysis by Product Type, 2022-2032 Figure 30: North America Food Enzymes Market Y-o-Y Growth (%) Projections by Product Type, 2022-2032 Figure 31: North America Food Enzymes Market Value (US$ Mn) Analysis by Application, 2017-2032 Figure 32: North America Food Enzymes Market Value Share (%) and BPS Analysis by Application, 2022-2032 Figure 33: North America Food Enzymes Market Y-o-Y Growth (%) Projections by Application, 2022-2032 Figure 34: North America Food Enzymes Market Value (US$ Mn) Analysis by Source, 2017-2032 Figure 35: North America Food Enzymes Market Value Share (%) and BPS Analysis by Source, 2022-2032 Figure 36: North America Food Enzymes Market Y-o-Y Growth (%) Projections by Source, 2022-2032 Figure 37: North America Food Enzymes Market Attractiveness by Product Type, 2022-2032 Figure 38: North America Food Enzymes Market Attractiveness by Application, 2022-2032 Figure 39: North America Food Enzymes Market Attractiveness by Source, 2022-2032 Figure 40: North America Food Enzymes Market Attractiveness by Country, 2022-2032 Figure 41: Latin America Food Enzymes Market Value (US$ Mn) by Product Type, 2022-2032 Figure 42: Latin America Food Enzymes Market Value (US$ Mn) by Application, 2022-2032 Figure 43: Latin America Food Enzymes Market Value (US$ Mn) by Source, 2022-2032 Figure 44: Latin America Food Enzymes Market Value (US$ Mn) by Country, 2022-2032 Figure 45: Latin America Food Enzymes Market Value (US$ Mn) Analysis by Country, 2017-2032 Figure 46: Latin America Food Enzymes Market Value Share (%) and BPS Analysis by Country, 2022-2032 Figure 47: Latin America Food Enzymes Market Y-o-Y Growth (%) Projections by Country, 2022-2032 Figure 48: Latin America Food Enzymes Market Value (US$ Mn) Analysis by Product Type, 2017-2032 Figure 49: Latin America Food Enzymes Market Value Share (%) and BPS Analysis by Product Type, 2022-2032 Figure 50: Latin America Food Enzymes Market Y-o-Y Growth (%) Projections by Product Type, 2022-2032 Figure 51: Latin America Food Enzymes Market Value (US$ Mn) Analysis by Application, 2017-2032 Figure 52: Latin America Food Enzymes Market Value Share (%) and BPS Analysis by Application, 2022-2032 Figure 53: Latin America Food Enzymes Market Y-o-Y Growth (%) Projections by Application, 2022-2032 Figure 54: Latin America Food Enzymes Market Value (US$ Mn) Analysis by Source, 2017-2032 Figure 55: Latin America Food Enzymes Market Value Share (%) and BPS Analysis by Source, 2022-2032 Figure 56: Latin America Food Enzymes Market Y-o-Y Growth (%) Projections by Source, 2022-2032 Figure 57: Latin America Food Enzymes Market Attractiveness by Product Type, 2022-2032 Figure 58: Latin America Food Enzymes Market Attractiveness by Application, 2022-2032 Figure 59: Latin America Food Enzymes Market Attractiveness by Source, 2022-2032 Figure 60: Latin America Food Enzymes Market Attractiveness by Country, 2022-2032 Figure 61: Europe Food Enzymes Market Value (US$ Mn) by Product Type, 2022-2032 Figure 62: Europe Food Enzymes Market Value (US$ Mn) by Application, 2022-2032 Figure 63: Europe Food Enzymes Market Value (US$ Mn) by Source, 2022-2032 Figure 64: Europe Food Enzymes Market Value (US$ Mn) by Country, 2022-2032 Figure 65: Europe Food Enzymes Market Value (US$ Mn) Analysis by Country, 2017-2032 Figure 66: Europe Food Enzymes Market Value Share (%) and BPS Analysis by Country, 2022-2032 Figure 67: Europe Food Enzymes Market Y-o-Y Growth (%) Projections by Country, 2022-2032 Figure 68: Europe Food Enzymes Market Value (US$ Mn) Analysis by Product Type, 2017-2032 Figure 69: Europe Food Enzymes Market Value Share (%) and BPS Analysis by Product Type, 2022-2032 Figure 70: Europe Food Enzymes Market Y-o-Y Growth (%) Projections by Product Type, 2022-2032 Figure 71: Europe Food Enzymes Market Value (US$ Mn) Analysis by Application, 2017-2032 Figure 72: Europe Food Enzymes Market Value Share (%) and BPS Analysis by Application, 2022-2032 Figure 73: Europe Food Enzymes Market Y-o-Y Growth (%) Projections by Application, 2022-2032 Figure 74: Europe Food Enzymes Market Value (US$ Mn) Analysis by Source, 2017-2032 Figure 75: Europe Food Enzymes Market Value Share (%) and BPS Analysis by Source, 2022-2032 Figure 76: Europe Food Enzymes Market Y-o-Y Growth (%) Projections by Source, 2022-2032 Figure 77: Europe Food Enzymes Market Attractiveness by Product Type, 2022-2032 Figure 78: Europe Food Enzymes Market Attractiveness by Application, 2022-2032 Figure 79: Europe Food Enzymes Market Attractiveness by Source, 2022-2032 Figure 80: Europe Food Enzymes Market Attractiveness by Country, 2022-2032 Figure 81: East Asia Food Enzymes Market Value (US$ Mn) by Product Type, 2022-2032 Figure 82: East Asia Food Enzymes Market Value (US$ Mn) by Application, 2022-2032 Figure 83: East Asia Food Enzymes Market Value (US$ Mn) by Source, 2022-2032 Figure 84: East Asia Food Enzymes Market Value (US$ Mn) by Country, 2022-2032 Figure 85: East Asia Food Enzymes Market Value (US$ Mn) Analysis by Country, 2017-2032 Figure 86: East Asia Food Enzymes Market Value Share (%) and BPS Analysis by Country, 2022-2032 Figure 87: East Asia Food Enzymes Market Y-o-Y Growth (%) Projections by Country, 2022-2032 Figure 88: East Asia Food Enzymes Market Value (US$ Mn) Analysis by Product Type, 2017-2032 Figure 89: East Asia Food Enzymes Market Value Share (%) and BPS Analysis by Product Type, 2022-2032 Figure 90: East Asia Food Enzymes Market Y-o-Y Growth (%) Projections by Product Type, 2022-2032 Figure 91: East Asia Food Enzymes Market Value (US$ Mn) Analysis by Application, 2017-2032 Figure 92: East Asia Food Enzymes Market Value Share (%) and BPS Analysis by Application, 2022-2032 Figure 93: East Asia Food Enzymes Market Y-o-Y Growth (%) Projections by Application, 2022-2032 Figure 94: East Asia Food Enzymes Market Value (US$ Mn) Analysis by Source, 2017-2032 Figure 95: East Asia Food Enzymes Market Value Share (%) and BPS Analysis by Source, 2022-2032 Figure 96: East Asia Food Enzymes Market Y-o-Y Growth (%) Projections by Source, 2022-2032 Figure 97: East Asia Food Enzymes Market Attractiveness by Product Type, 2022-2032 Figure 98: East Asia Food Enzymes Market Attractiveness by Application, 2022-2032 Figure 99: East Asia Food Enzymes Market Attractiveness by Source, 2022-2032 Figure 100: East Asia Food Enzymes Market Attractiveness by Country, 2022-2032 Figure 101: South Asia & Pacific Food Enzymes Market Value (US$ Mn) by Product Type, 2022-2032 Figure 102: South Asia & Pacific Food Enzymes Market Value (US$ Mn) by Application, 2022-2032 Figure 103: South Asia & Pacific Food Enzymes Market Value (US$ Mn) by Source, 2022-2032 Figure 104: South Asia & Pacific Food Enzymes Market Value (US$ Mn) by Country, 2022-2032 Figure 105: South Asia & Pacific Food Enzymes Market Value (US$ Mn) Analysis by Country, 2017-2032 Figure 106: South Asia & Pacific Food Enzymes Market Value Share (%) and BPS Analysis by Country, 2022-2032 Figure 107: South Asia & Pacific Food Enzymes Market Y-o-Y Growth (%) Projections by Country, 2022-2032 Figure 108: South Asia & Pacific Food Enzymes Market Value (US$ Mn) Analysis by Product Type, 2017-2032 Figure 109: South Asia & Pacific Food Enzymes Market Value Share (%) and BPS Analysis by Product Type, 2022-2032 Figure 110: South Asia & Pacific Food Enzymes Market Y-o-Y Growth (%) Projections by Product Type, 2022-2032 Figure 111: South Asia & Pacific Food Enzymes Market Value (US$ Mn) Analysis by Application, 2017-2032 Figure 112: South Asia & Pacific Food Enzymes Market Value Share (%) and BPS Analysis by Application, 2022-2032 Figure 113: South Asia & Pacific Food Enzymes Market Y-o-Y Growth (%) Projections by Application, 2022-2032 Figure 114: South Asia & Pacific Food Enzymes Market Value (US$ Mn) Analysis by Source, 2017-2032 Figure 115: South Asia & Pacific Food Enzymes Market Value Share (%) and BPS Analysis by Source, 2022-2032 Figure 116: South Asia & Pacific Food Enzymes Market Y-o-Y Growth (%) Projections by Source, 2022-2032 Figure 117: South Asia & Pacific Food Enzymes Market Attractiveness by Product Type, 2022-2032 Figure 118: South Asia & Pacific Food Enzymes Market Attractiveness by Application, 2022-2032 Figure 119: South Asia & Pacific Food Enzymes Market Attractiveness by Source, 2022-2032 Figure 120: South Asia & Pacific Food Enzymes Market Attractiveness by Country, 2022-2032 Figure 121: MEA Food Enzymes Market Value (US$ Mn) by Product Type, 2022-2032 Figure 122: MEA Food Enzymes Market Value (US$ Mn) by Application, 2022-2032 Figure 123: MEA Food Enzymes Market Value (US$ Mn) by Source, 2022-2032 Figure 124: MEA Food Enzymes Market Value (US$ Mn) by Country, 2022-2032 Figure 125: MEA Food Enzymes Market Value (US$ Mn) Analysis by Country, 2017-2032 Figure 126: MEA Food Enzymes Market Value Share (%) and BPS Analysis by Country, 2022-2032 Figure 127: MEA Food Enzymes Market Y-o-Y Growth (%) Projections by Country, 2022-2032 Figure 128: MEA Food Enzymes Market Value (US$ Mn) Analysis by Product Type, 2017-2032 Figure 129: MEA Food Enzymes Market Value Share (%) and BPS Analysis by Product Type, 2022-2032 Figure 130: MEA Food Enzymes Market Y-o-Y Growth (%) Projections by Product Type, 2022-2032 Figure 131: MEA Food Enzymes Market Value (US$ Mn) Analysis by Application, 2017-2032 Figure 132: MEA Food Enzymes Market Value Share (%) and BPS Analysis by Application, 2022-2032 Figure 133: MEA Food Enzymes Market Y-o-Y Growth (%) Projections by Application, 2022-2032 Figure 134: MEA Food Enzymes Market Value (US$ Mn) Analysis by Source, 2017-2032 Figure 135: MEA Food Enzymes Market Value Share (%) and BPS Analysis by Source, 2022-2032 Figure 136: MEA Food Enzymes Market Y-o-Y Growth (%) Projections by Source, 2022-2032 Figure 137: MEA Food Enzymes Market Attractiveness by Product Type, 2022-2032 Figure 138: MEA Food Enzymes Market Attractiveness by Application, 2022-2032 Figure 139: MEA Food Enzymes Market Attractiveness by Source, 2022-2032 Figure 140: MEA Food Enzymes Market Attractiveness by Country, 2022-2032
Need specific information?
Request CustomizationExplore Food and Beverage Insights
View Reports