Food Punnets Market Size and Share Forecast Outlook 2025 to 2035

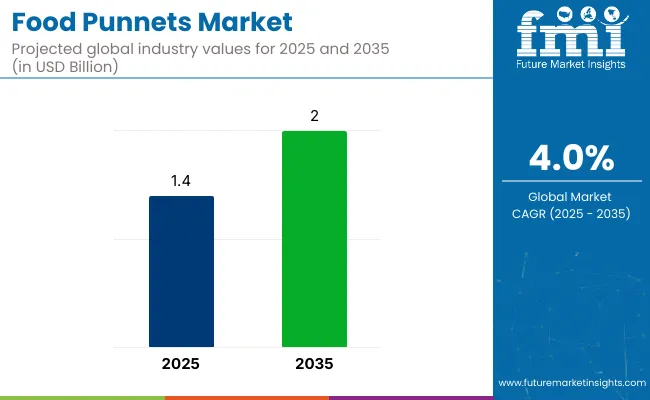
The global food punnets market is projected to grow from USD 1.4 billion in 2025 to USD 2.0 billion by 2035, registering a CAGR of 4% during the forecast period. Sales in 2024 were recorded at USD 1.3 billion. This growth is primarily attributed to increasing demand for sustainable and convenient packaging solutions across fresh produce, bakery, and ready-to-eat food applications.
Quick Stats of Food Punnets Market

  • Market Value (2025): USD 1.4 billion
  • Forecast Value (2035): USD 2.0 billion
  • Forecast CAGR: 4%
  • Thickness Type Leader in 2025: Plastic (46.7% market share)
  • Top Product: fruits and vegetables (51.2% share)
  • Key Growth Country: Europe (Germany holds the largest market share with 29.4% in 2025)

Food Punnets Market

Attributes Description
Estimated Market Size (2025E) USD 1.4 billion
Projected Market Value (2035F) USD 2.0 billion
Value-based CAGR (2025 to 2035) 4%

Food punnets, commonly crafted from materials such as plastic, paperboard, and biodegradable polymers, are widely preferred for their product visibility, ventilation properties, and capacity to extend shelf life. Rising consumer inclination toward eco-friendly alternatives has further accelerated the adoption of recyclable and compostable punnets across retail and foodservice channels.

In 2024, DS Smith, a leading paper and packaging company, announced an investment focused on developing innovative fiber-based alternatives to plastic packaging, including biodegradable fruit punnets. The initiative is being led by their innovation lab in Suffolk, UK, where R&D is centered on sustainable materials such as seaweed, daisies, hemp, and cocoa shells. “We want them to be liquid-proof when we use them but when we recycle them, we want to be able to repulp them,” stated Wim Wouters, Innovation Director at DS Smith.

Recent innovations in the food punnets market are increasingly driven by material science and biopolymer research. Researchers at the University of Queensland have successfully developed strawberry punnets using biodegradable bioplastics derived from bacteria-fermented polyhydroxyalkanoates (PHAs) and Radiata Pine sawdust.

These new punnets demonstrate the ability to biodegrade in multiple natural environments including soil, freshwater, ocean water, and compost. Such advancements present a viable, scalable alternative to conventional petroleum-based plastics, enhancing circularity and supporting retailers’ plastic reduction goals while maintaining shelf life and product protection.

The food punnets market is anticipated to witness strong growth momentum across Asia-Pacific countries, led by China, India, Japan, and Malaysia. Key drivers include rising urbanization, higher disposable incomes, and increased preference for pre-packaged fresh produce.

Local and global manufacturers are investing in regional production units to develop affordable, eco-friendly packaging that complies with evolving environmental legislation. As sustainability regulations tighten and consumer awareness rises, companies are expected to intensify efforts to incorporate renewable raw materials and recyclable formats, enabling long-term growth and competitive differentiation in the global food punnets market.

Analyzing Food Punnets Market by Top Investment Segment

The market has been segmented based on material type, thickness (GSM), product type, end use, and region. By material type, paper, plastic, and molded fiber variants are adopted to fulfill sustainability targets, rigidity demands, and food safety compliance across packaging systems.

Thickness segmentation includes up to 150 gm, 151-300 gm, 301-500 gm, and above 500 gm, providing manufacturers and retailers with flexibility for light-weighted to heavy-duty applications. Product types include fruits and vegetables, meat, poultry, and seafood, frozen food, and ready-to-eat categories, highlighting the widespread utility of punnets across fresh, chilled, and processed food segments.

End-use segmentation captures retail outlets, hypermarkets/supermarkets, convenience stores, other retail stores, HoReCa (hotels, restaurants, and cafés), and household use illustrating the channel-specific demand dynamics for functional and attractive packaging formats.

Regional segmentation includes North America, Latin America, Europe, South Asia, East Asia, Oceania, and the Middle East and Africa (MEA), taking into account shifting consumer preferences, food distribution infrastructures, and circular packaging policies.
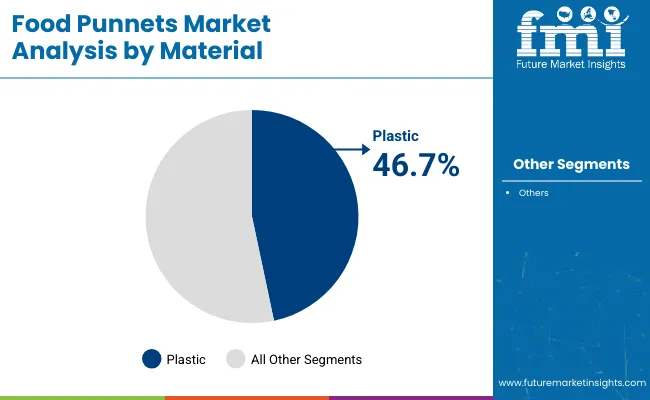
Plastic Segment to Account for 46.7% Share Due to Durability and Extended Shelf Life Capabilities

Food Punnets Market Analysis By Material

The plastic segment is projected to command the largest share of 46.7% in the food punnets market by 2025, primarily due to its high durability, lightweight properties, and superior product visibility. Plastics including PET, PP, and RPET are widely used in fresh food packaging to ensure structural strength, moisture barrier, and extended product shelf life. Their clarity allows consumers to assess freshness at point-of-sale, making them ideal for high-turnover categories like fresh produce, meats, and ready-to-eat snacks.

Thermoformed plastic punnets can be easily molded into customized sizes, stackable forms, and vented designs to accommodate specific food types. Modified Atmosphere Packaging (MAP) compatibility and heat-sealing properties make plastic punnets especially effective in supermarkets, hypermarkets, and foodservice chains. Moreover, the recyclability of RPET and the integration of post-consumer resins have helped address environmental concerns, particularly in Europe and North America where circular economy regulations are tightening.

With increasing demand for hygienic and tamper-evident packaging solutions in the post-pandemic era, plastic punnets continue to be the material of choice across food processors, retailers, and institutional caterers. Ongoing innovations in biodegradable polymers and mono-material tray designs are further strengthening this segment’s position in the market.
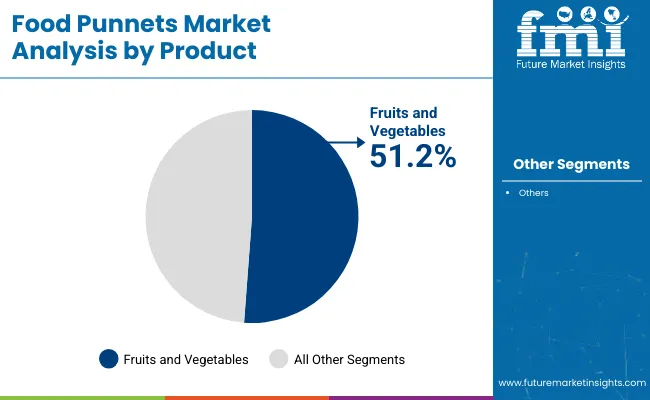
Fruits and Vegetables Segment Leads Product Type Category with 51.2% Share Amid Fresh Produce Packaging Surge

Food Punnets Market Analysis By Product

The fruits and vegetables segment is forecasted to lead the product type category with a 51.2% share in 2025, fueled by the rising global consumption of fresh produce and the expansion of organized retail. Punnets have become an integral part of retail-ready packaging strategies for berries, tomatoes, leafy greens, citrus fruits, and pre-cut produce due to their ability to enhance product safety, presentation, and shelf-life management.

Retailers favor punnet packaging for its ability to reduce food spoilage, support portion control, and allow efficient product stacking all key parameters in modern grocery merchandising. These punnets often feature breathable vents, tamper-evident seals, and anti-fog lids that optimize visibility and freshness across diverse climatic zones and transportation systems.

With health-conscious consumers increasingly opting for pre-washed, ready-to-eat fruit and vegetable packs, especially in urban and metropolitan areas, demand for tailored punnet formats has surged. Both plastic and molded fiber punnets are being utilized to meet sustainability requirements without compromising quality. Moreover, advancements in intelligent labeling and digital freshness indicators are gradually being integrated into punnet formats for enhanced product tracking and consumer engagement.

Challenges and Opportunities

Challenge

Environmental Concerns and Regulatory Compliance

However, growing regulations to ban the use of plastic and shift to sustainable packaging solutions is expected to pose a challenge to the growth of the Food punnets market. Governments around the world are outlawing or limiting single-use plastics and forcing manufacturers to move to biodegradable or recyclable materials. Production is also complicated by tight food safety and packaging regulations.

In response to these challenges, businesses need to invest in sustainable packaging solutions, eco-friendly raw materials, and advanced recycling processes to comply with changing regulatory frameworks and consumer preferences.

High Production Costs and Material Limitations

The shift from traditional plastic food punnets to sustainable options including molded fiber, bioplastics, and compostable materials has resulted in higher production costs. Manufacturing costs get amplified due to the fact that these materials are usually processed using certain specialized techniques.

On top of this, delivering options that are durable, moisture resistant, and have long shelf-life while being eco-friendly poses technical challenges. All companies need to prioritize on improving production efficiency, reducing material costs as well as investing in research and development (R&D) for high-performance sustainable packaging.

Opportunity

Rising Demand for Sustainable and Biodegradable Packaging

The increasing consumer awareness regarding environmental sustainability is providing growth to biodegradable, recyclable, and compostable food punnets. More and more retailers and food producers are looking for packaging solutions that follow circular economy principles.

Exciting growth potential in plant-based bioplastics, recycled paperboard, and compostable fiber punnets. Business that create environmental friendly, practical, and affordable packaging approaches will lead in the transitioning marketplace.

Expansion in Fresh Produce and Ready-to-Eat Food Segments

The Food punnets market is propelled by the growing demand for convenience foods, fresh produce, and pre-packaged meals. To create food safety, prolong shelf life, and ensure high presentation, supermarkets, food service providers, and ecommerce are favoring packaging solutions that are creative and innovative.

The growth of smart packaging technologies, including QR-coded traceability and modified atmosphere packaging (MAP), will also accelerate growth. Growing demand in these sectors will enable companies engaged in customized, functional, and appealing punnets to equip themselves as contenders.
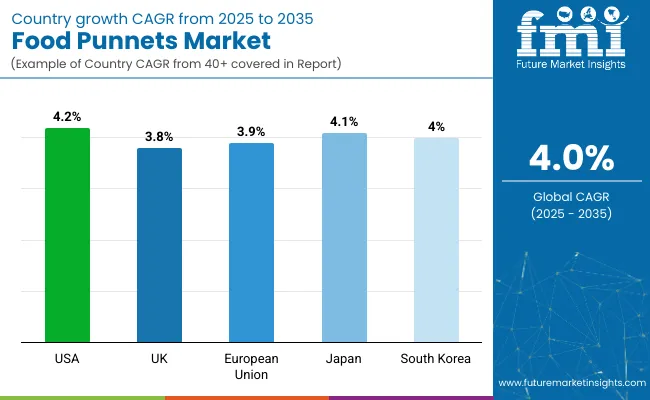
Country-wise Outlook- Food punnets market

Country Wise Analysis Of Food Punnets Market

United States

The North American region leads the food punnets market in the United States owing to the growing demand for bio-degradable packaging solutions and the rise in the shift away from plastic rubbish as well as supportive legislations for eco-friendly alternatives. The growing use of biodegradable and recyclable punnets further explains market revenue growth.

Increasing investments in compostable materials and innovations in molded fiber and bioplastic punnets will further fuel the market growth. Moreover, the adoption of intelligent packaging capabilities like QR-coded traceability and freshness indicators is making products more attractive to consumers.

Other companies are also emphasizing lightweight, strong and moisture-resistant packaging solutions that reflect changing consumer and retailer demands. Rising acceptance of food punnets in bakery products, fresh produce, and ready-to-eat meals is driving the USA market further.

Country CAGR (2025 to 2035)
USA 4.2%

United Kingdom

The United Kingdom is a significant market for food punnets, primarily driven by strict regulation on single-use plastics, rising need for sustainable food packaging, and increasing awareness amongst consumers regarding environmental effects. Growing focus on alternative options such as compostable and fiber-based options is also fuelling the growth of the market.

Market expansion is further bolstered by government policies that promote circular economy practices, together with innovations in water-resistant, tamper-proof biodegradable punnets. Additionally, advances in clear, plant-based plastic alternatives, heat-sealable fiber trays and recyclable PET punnets are on the rise.

Firms are also pouring in to physical printing technology, particularly to allow companies to have branded products or customized product detail on packages. Further growth in the market is projected due to increasing demand for food punnets made from sustainable materials in organic produce, specialty foods, and supermarket-ready packaging segments in the UK. Moreover, the trend to carbon-neutral packaging solutions is driving demand.

Country CAGR (2025 to 2035)
UK 3.8%

European Union

Germany, France, and Italy are dominating the Europe food punnets market owing to stringent sustainability mandates, growing investments in compostable packaging materials and increasing demand for premium and eco-friendly food packaging.

The EU's aim to minimize packaging waste and investment in fiber-moulded food punnets and plant-based are contributing to the growth of the fiber moulded food punnets market. Improved durability of products owing to the growing adoption of advanced barrier coatings for longer shelf life and development of recyclable and reusable punnet innovations are other key contributors towards market growth.

The increasing preference for convenient and lightweight packaging in various end-use industries, including fresh produce, deli, and meat, is expected to drive the market growth further. In the EU, expansion of sustainable packaging regulations, including the EU Plastics Strategy, coupled with increasing investments in closed-loop recycling systems are driving higher adoption levels.

Region CAGR (2025 to 2035)
European Union (EU) 3.9%

Japan

The development of a food punnets market in Japan is being driven by the demand for high-quality food packaging, the growing popularity of sustainable alternatives, and increasing investments in advanced material technologies. Rising demand for light-weight, visually-appealing, and functional packaging in food retail is stimulating the market growth.

Innovation is being driven by the country’s focus on precision packaging engineering and use of biodegradable coatings, moisture-resistant pulp trays and bio-PET materials. In addition, stringent government mandates on reduction of packaging waste and firms investing significantly in smart labeling and freshness preservation are some more factors driving them to develop high-performance food punnets.

Increasing demand for stackable, resealable, and tamper-proof packaging of sushi, confectionery, and fresh fruit is also fuelling market growth of Japan food processing industry. Moreover, Japan is also investing in intelligent packaging technologies like oxygen scavengers and freshness sensors that determine the future of food punnets.

Country CAGR (2025 to 2035)
Japan 4.1%

South Korea

The growing need for sustainable food packaging in South Korea, coupled with high regulatory limitations on the use of plastic waste and a widespread consumer preference for recyclable and biodegradable packaging materials are a few of the reasons contributing to this market growth.

Rising investment in eco-friendly high-barrier punnet materials and strict environmental regulations drive market growth. The country is also making strides in improving competitiveness by focusing on more durable, heat resistant, and lightweight packaging designs with bio-based composites and nanotechnology. The rising requirement for clear, food-safe, and reclosable punnets in fresh produce, bakery products, and seafood packaging is further driving the market adoption.

Several companies are working on zero-waste packaging, smart packaging indicators and supply chain AI-driven optimization to boost food safety and sustainability. With rising premium food packaging trends and surge in online grocery shopping in South Korea the demand for innovative food punnet solutions is anticipated to increase further.

Country CAGR (2025 to 2035)
South Korea 4.0%

Competitive Outlook

The food punnets market is growing driven by the growing demand for sustainable and convenient packaging solutions across fresh produce, bakery, and ready-to-eat food segments. Companies are turning to biodegradable, recyclable and lightweight materials to meet evolving consumer and regulatory needs. Among its key trends are punnets made of compostable fiber materials, more advanced moisture barriers, and better packaging designs that continually keep food fresh.

Key Companies

  • Smurfit Kappa Group Plc
  • LC Packaging International BV
  • Coveris Holdings S.A.
  • Tetra Pak Containers Ltd.
  • Tacca Industries Pty. Ltd.
  • Rapti’s Pax Pty. Ltd.
  • INFIA srl
  • Quinn Packaging Ltd.
  • Groupe Guillin SA
  • Pacor Netherlands BV

Key Segments

By Thickness (GSM):

  • Paper
  • Plastic
  • Molded Fiber

By Paper Type:

  • Up to 150 gm
  • 151-300 gm
  • 301-500 gm
  • Above 500 gm

By Product Type:

  • Fruits and Vegetables
  • Meat, Poultry, and Seafood
  • Frozen Food
  • Ready-to-Eat

By End Use:

  • Retail Outlets
  • Hypermarkets/Supermarkets
  • Convenience Stores
  • Other Retail Stores
  • Hotels, Restaurants, and Cafés (HoReCa)
  • Household

By Region:

  • North America
  • Latin America
  • Europe
  • South Asia
  • East Asia
  • Oceania
  • Middle East and Africa (MEA)

Table of Content

  1. Executive Summary
    • Global Market Outlook
    • Demand-side Trends
    • Supply-side Trends
    • Technology Roadmap Analysis
    • Analysis and Recommendations
  2. Market Overview
    • Market Coverage/Taxonomy
    • Market Definition/Scope/Limitations
  3. Market Background
    • Market Dynamics
      • Drivers
      • Restraints
      • Opportunity
      • Trends
    • Scenario Forecast
      • Demand in Optimistic Scenario
      • Demand in Likely Scenario
      • Demand in Conservative Scenario
    • Opportunity Map Analysis
    • Product Life Cycle Analysis
    • Supply Chain Analysis
      • Supply Side Participants and their Roles
        • Producers
        • Mid-Level Participants (Traders/ Agents/ Brokers)
        • Wholesalers and Distributors
      • Value Added and Value Created at Node in the Supply Chain
      • List of Raw Material Suppliers
      • List of Existing and Potential Buyer’s
    • Investment Feasibility Matrix
    • Value Chain Analysis
      • Profit Margin Analysis
      • Wholesalers and Distributors
      • Retailers
    • PESTLE and Porter’s Analysis
    • Regulatory Landscape
      • By Key Regions
      • By Key Countries
    • Regional Parent Market Outlook
    • Production and Consumption Statistics
    • Import and Export Statistics
  4. Global Market Analysis 2020 to 2024 and Forecast, 2025 to 2035
    • Historical Market Size Value (USD Million) & Volume (Units) Analysis, 2020 to 2024
    • Current and Future Market Size Value (USD Million) & Volume (Units) Projections, 2025 to 2035
      • Y-o-Y Growth Trend Analysis
      • Absolute $ Opportunity Analysis
  5. Global Market Pricing Analysis 2020 to 2024 and Forecast 2025 to 2035
  6. Global Market Analysis 2020 to 2024 and Forecast 2025 to 2035, By Thickness (GSM)
    • Introduction/Key Findings
    • Historical Market Size Value (USD Million) & Volume (Units) Analysis By Thickness (GSM), 2020 to 2024
    • Current and Future Market Size Value (USD Million) & Volume (Units) Analysis and Forecast By Thickness (GSM), 2025 to 2035
      • Paper
      • Plastic
      • Molded Fiber
    • Y-o-Y Growth Trend Analysis By Thickness (GSM), 2020 to 2024
    • Absolute $ Opportunity Analysis By Thickness (GSM), 2025 to 2035
  7. Global Market Analysis 2020 to 2024 and Forecast 2025 to 2035, By Paper Type
    • Introduction/Key Findings
    • Historical Market Size Value (USD Million) & Volume (Units) Analysis By Paper Type, 2020 to 2024
    • Current and Future Market Size Value (USD Million) & Volume (Units) Analysis and Forecast By Paper Type, 2025 to 2035
      • Up to 150 gm
      • 151-300 gm
      • 301-500 gm
      • Above 500 gm
    • Y-o-Y Growth Trend Analysis By Paper Type, 2020 to 2024
    • Absolute $ Opportunity Analysis By Paper Type, 2025 to 2035
  8. Global Market Analysis 2020 to 2024 and Forecast 2025 to 2035, By Product Type
    • Introduction/Key Findings
    • Historical Market Size Value (USD Million) & Volume (Units) Analysis By Product Type, 2020 to 2024
    • Current and Future Market Size Value (USD Million) & Volume (Units) Analysis and Forecast By Product Type, 2025 to 2035
      • Fruits and Vegetables
      • Meat, Poultry, and Seafood
      • Frozen Food
      • Ready-to-Eat
    • Y-o-Y Growth Trend Analysis By Product Type, 2020 to 2024
    • Absolute $ Opportunity Analysis By Product Type, 2025 to 2035
  9. Global Market Analysis 2020 to 2024 and Forecast 2025 to 2035, By End Use
    • Introduction/Key Findings
    • Historical Market Size Value (USD Million) & Volume (Units) Analysis By End Use, 2020 to 2024
    • Current and Future Market Size Value (USD Million) & Volume (Units) Analysis and Forecast By End Use, 2025 to 2035
      • Retail Outlets
      • Hypermarkets/Supermarkets
      • Convenience Stores
      • Other Retail Stores
      • Hotels, Restaurants, and Cafés (HoReCa)
      • Household
    • Y-o-Y Growth Trend Analysis By End Use, 2020 to 2024
    • Absolute $ Opportunity Analysis By End Use, 2025 to 2035
  10. Global Market Analysis 2020 to 2024 and Forecast 2025 to 2035, By Region
    • Introduction
    • Historical Market Size Value (USD Million) & Volume (Units) Analysis By Region, 2020 to 2024
    • Current Market Size Value (USD Million) & Volume (Units) Analysis and Forecast By Region, 2025 to 2035
      • North America
      • Latin America
      • Europe
      • East Asia
      • South Asia
      • Oceania
      • MEA
    • Market Attractiveness Analysis By Region
  11. North America Market Analysis 2020 to 2024 and Forecast 2025 to 2035, By Country
    • Historical Market Size Value (USD Million) & Volume (Units) Trend Analysis By Market Taxonomy, 2020 to 2024
    • Market Size Value (USD Million) & Volume (Units) Forecast By Market Taxonomy, 2025 to 2035
      • By Country
        • USA
        • Canada
      • By Thickness (GSM)
      • By Paper Type
      • By Product Type
      • By End Use
    • Market Attractiveness Analysis
      • By Country
      • By Thickness (GSM)
      • By Paper Type
      • By Product Type
      • By End Use
    • Key Takeaways
  12. Latin America Market Analysis 2020 to 2024 and Forecast 2025 to 2035, By Country
    • Historical Market Size Value (USD Million) & Volume (Units) Trend Analysis By Market Taxonomy, 2020 to 2024
    • Market Size Value (USD Million) & Volume (Units) Forecast By Market Taxonomy, 2025 to 2035
      • By Country
        • Brazil
        • Mexico
        • Argentina
        • Chile
        • Peru
        • Rest of Latin America
      • By Thickness (GSM)
      • By Paper Type
      • By Product Type
      • By End Use
    • Market Attractiveness Analysis
      • By Country
      • By Thickness (GSM)
      • By Paper Type
      • By Product Type
      • By End Use
    • Key Takeaways
  13. Europe Market Analysis 2020 to 2024 and Forecast 2025 to 2035, By Country
    • Historical Market Size Value (USD Million) & Volume (Units) Trend Analysis By Market Taxonomy, 2020 to 2024
    • Market Size Value (USD Million) & Volume (Units) Forecast By Market Taxonomy, 2025 to 2035
      • By Country
        • Germany
        • Italy
        • France
        • UK
        • Spain
        • Russia
        • BENELUX
        • Rest of Europe
      • By Thickness (GSM)
      • By Paper Type
      • By Product Type
      • By End Use
    • Market Attractiveness Analysis
      • By Country
      • By Thickness (GSM)
      • By Paper Type
      • By Product Type
      • By End Use
    • Key Takeaways
  14. East Asia Market Analysis 2020 to 2024 and Forecast 2025 to 2035, By Country
    • Historical Market Size Value (USD Million) & Volume (Units) Trend Analysis By Market Taxonomy, 2020 to 2024
    • Market Size Value (USD Million) & Volume (Units) Forecast By Market Taxonomy, 2025 to 2035
      • By Country
        • China
        • Japan
        • South Korea
      • By Thickness (GSM)
      • By Paper Type
      • By Product Type
      • By End Use
    • Market Attractiveness Analysis
      • By Country
      • By Thickness (GSM)
      • By Paper Type
      • By Product Type
      • By End Use
    • Key Takeaways
  15. South Asia Market Analysis 2020 to 2024 and Forecast 2025 to 2035, By Country
    • Historical Market Size Value (USD Million) & Volume (Units) Trend Analysis By Market Taxonomy, 2020 to 2024
    • Market Size Value (USD Million) & Volume (Units) Forecast By Market Taxonomy, 2025 to 2035
      • By Country
        • India
        • Thailand
        • Malaysia
        • Indonesia
        • Rest of South Asia
      • By Thickness (GSM)
      • By Paper Type
      • By Product Type
      • By End Use
    • Market Attractiveness Analysis
      • By Country
      • By Thickness (GSM)
      • By Paper Type
      • By Product Type
      • By End Use
    • Key Takeaways
  16. Oceania Market Analysis 2020 to 2024 and Forecast 2025 to 2035, By Country
    • Historical Market Size Value (USD Million) & Volume (Units) Trend Analysis By Market Taxonomy, 2020 to 2024
    • Market Size Value (USD Million) & Volume (Units) Forecast By Market Taxonomy, 2025 to 2035
      • By Country
        • Australia
        • New Zealand
      • By Thickness (GSM)
      • By Paper Type
      • By Product Type
      • By End Use
    • Market Attractiveness Analysis
      • By Country
      • By Thickness (GSM)
      • By Paper Type
      • By Product Type
      • By End Use
    • Key Takeaways
  17. MEA Market Analysis 2020 to 2024 and Forecast 2025 to 2035, By Country
    • Historical Market Size Value (USD Million) & Volume (Units) Trend Analysis By Market Taxonomy, 2020 to 2024
    • Market Size Value (USD Million) & Volume (Units) Forecast By Market Taxonomy, 2025 to 2035
      • By Country
        • GCC
        • Rest of MEA
      • By Thickness (GSM)
      • By Paper Type
      • By Product Type
      • By End Use
    • Market Attractiveness Analysis
      • By Country
      • By Thickness (GSM)
      • By Paper Type
      • By Product Type
      • By End Use
    • Key Takeaways
  18. Key Countries Market Analysis
    • USA
      • Pricing Analysis
      • Market Share Analysis, 2024
        • By Thickness (GSM)
        • By Paper Type
        • By Product Type
        • By End Use
    • Canada
      • Pricing Analysis
      • Market Share Analysis, 2024
        • By Thickness (GSM)
        • By Paper Type
        • By Product Type
        • By End Use
    • Brazil
      • Pricing Analysis
      • Market Share Analysis, 2024
        • By Thickness (GSM)
        • By Paper Type
        • By Product Type
        • By End Use
    • Mexico
      • Pricing Analysis
      • Market Share Analysis, 2024
        • By Thickness (GSM)
        • By Paper Type
        • By Product Type
        • By End Use
    • Argentina
      • Pricing Analysis
      • Market Share Analysis, 2024
        • By Thickness (GSM)
        • By Paper Type
        • By Product Type
        • By End Use
  19. Market Structure Analysis
    • Competition Dashboard
    • Competition Benchmarking
    • Market Share Analysis of Top Players
      • By Regional
      • By Thickness (GSM)
      • By Paper Type
      • By Product Type
      • By End Use
  20. Competition Analysis
    • Competition Deep Dive
      • Smurfit Kappa Group Plc
        • Overview
        • Product Portfolio
        • Profitability by Market Segments (Product/Age /Sales Channel/Region)
        • Sales Footprint
        • Strategy Overview
          • Marketing Strategy
          • Product Strategy
          • Channel Strategy
      • LC Packaging International BV
        • Overview
        • Product Portfolio
        • Profitability by Market Segments (Product/Age /Sales Channel/Region)
        • Sales Footprint
        • Strategy Overview
          • Marketing Strategy
          • Product Strategy
          • Channel Strategy
      • Coveris Holdings S.A.
        • Overview
        • Product Portfolio
        • Profitability by Market Segments (Product/Age /Sales Channel/Region)
        • Sales Footprint
        • Strategy Overview
          • Marketing Strategy
          • Product Strategy
          • Channel Strategy
      • Tetra Pak Containers Ltd.
        • Overview
        • Product Portfolio
        • Profitability by Market Segments (Product/Age /Sales Channel/Region)
        • Sales Footprint
        • Strategy Overview
          • Marketing Strategy
          • Product Strategy
          • Channel Strategy
      • Tacca Industries Pty. Ltd.
        • Overview
        • Product Portfolio
        • Profitability by Market Segments (Product/Age /Sales Channel/Region)
        • Sales Footprint
        • Strategy Overview
          • Marketing Strategy
          • Product Strategy
          • Channel Strategy
      • Rapti’s Pax Pty. Ltd.
        • Overview
        • Product Portfolio
        • Profitability by Market Segments (Product/Age /Sales Channel/Region)
        • Sales Footprint
        • Strategy Overview
          • Marketing Strategy
          • Product Strategy
          • Channel Strategy
      • INFIA srl
        • Overview
        • Product Portfolio
        • Profitability by Market Segments (Product/Age /Sales Channel/Region)
        • Sales Footprint
        • Strategy Overview
          • Marketing Strategy
          • Product Strategy
          • Channel Strategy
      • Quinn Packaging Ltd.
        • Overview
        • Product Portfolio
        • Profitability by Market Segments (Product/Age /Sales Channel/Region)
        • Sales Footprint
        • Strategy Overview
          • Marketing Strategy
          • Product Strategy
          • Channel Strategy
      • Groupe Guillin SA
        • Overview
        • Product Portfolio
        • Profitability by Market Segments (Product/Age /Sales Channel/Region)
        • Sales Footprint
        • Strategy Overview
          • Marketing Strategy
          • Product Strategy
          • Channel Strategy
      • Pacor Netherlands BV
        • Overview
        • Product Portfolio
        • Profitability by Market Segments (Product/Age /Sales Channel/Region)
        • Sales Footprint
        • Strategy Overview
          • Marketing Strategy
          • Product Strategy
          • Channel Strategy
  21. Assumptions & Acronyms Used
  22. Research Methodology

List of Tables

  • Table 1: Global Market Value (USD Million) Forecast by Region, 2020-2035
  • Table 2: Global Market Volume (Units) Forecast by Region, 2020-2035
  • Table 3: Global Market Value (USD Million) Forecast By Thickness (GSM), 2020-2035
  • Table 4: Global Market Volume (Units) Forecast By Thickness (GSM), 2020-2035
  • Table 5: Global Market Value (USD Million) Forecast By Paper Type, 2020-2035
  • Table 6: Global Market Volume (Units) Forecast By Paper Type, 2020-2035
  • Table 7: Global Market Value (USD Million) Forecast By Product Type, 2020-2035
  • Table 8: Global Market Volume (Units) Forecast By Product Type, 2020-2035
  • Table 9: Global Market Value (USD Million) Forecast By End Use, 2020-2035
  • Table 10: Global Market Volume (Units) Forecast By End Use, 2020-2035
  • Table 11: North America Market Value (USD Million) Forecast by Country, 2020-2035
  • Table 12: North America Market Volume (Units) Forecast by Country, 2020-2035
  • Table 13: North America Market Value (USD Million) Forecast By Thickness (GSM), 2020-2035
  • Table 14: North America Market Volume (Units) Forecast By Thickness (GSM), 2020-2035
  • Table 15: North America Market Value (USD Million) Forecast By Paper Type, 2020-2035
  • Table 16: North America Market Volume (Units) Forecast By Paper Type, 2020-2035
  • Table 17: North America Market Value (USD Million) Forecast By Product Type, 2020-2035
  • Table 18: North America Market Volume (Units) Forecast By Product Type, 2020-2035
  • Table 19: North America Market Value (USD Million) Forecast By End Use, 2020-2035
  • Table 20: North America Market Volume (Units) Forecast By End Use, 2020-2035
  • Table 21: Latin America Market Value (USD Million) Forecast by Country, 2020-2035
  • Table 22: Latin America Market Volume (Units) Forecast by Country, 2020-2035
  • Table 23: Latin America Market Value (USD Million) Forecast By Thickness (GSM), 2020-2035
  • Table 24: Latin America Market Volume (Units) Forecast By Thickness (GSM), 2020-2035
  • Table 25: Latin America Market Value (USD Million) Forecast By Paper Type, 2020-2035
  • Table 26: Latin America Market Volume (Units) Forecast By Paper Type, 2020-2035
  • Table 27: Latin America Market Value (USD Million) Forecast By Product Type, 2020-2035
  • Table 28: Latin America Market Volume (Units) Forecast By Product Type, 2020-2035
  • Table 29: Latin America Market Value (USD Million) Forecast By End Use, 2020-2035
  • Table 30: Latin America Market Volume (Units) Forecast By End Use, 2020-2035
  • Table 31: Europe Market Value (USD Million) Forecast by Country, 2020-2035
  • Table 32: Europe Market Volume (Units) Forecast by Country, 2020-2035
  • Table 33: Europe Market Value (USD Million) Forecast By Thickness (GSM), 2020-2035
  • Table 34: Europe Market Volume (Units) Forecast By Thickness (GSM), 2020-2035
  • Table 35: Europe Market Value (USD Million) Forecast By Paper Type, 2020-2035
  • Table 36: Europe Market Volume (Units) Forecast By Paper Type, 2020-2035
  • Table 37: Europe Market Value (USD Million) Forecast By Product Type, 2020-2035
  • Table 38: Europe Market Volume (Units) Forecast By Product Type, 2020-2035
  • Table 39: Europe Market Value (USD Million) Forecast By End Use, 2020-2035
  • Table 40: Europe Market Volume (Units) Forecast By End Use, 2020-2035
  • Table 41: East Asia Market Value (USD Million) Forecast by Country, 2020-2035
  • Table 42: East Asia Market Volume (Units) Forecast by Country, 2020-2035
  • Table 43: East Asia Market Value (USD Million) Forecast By Thickness (GSM), 2020-2035
  • Table 44: East Asia Market Volume (Units) Forecast By Thickness (GSM), 2020-2035
  • Table 45: East Asia Market Value (USD Million) Forecast By Paper Type, 2020-2035
  • Table 46: East Asia Market Volume (Units) Forecast By Paper Type, 2020-2035
  • Table 47: East Asia Market Value (USD Million) Forecast By Product Type, 2020-2035
  • Table 48: East Asia Market Volume (Units) Forecast By Product Type, 2020-2035
  • Table 49: East Asia Market Value (USD Million) Forecast By End Use, 2020-2035
  • Table 50: East Asia Market Volume (Units) Forecast By End Use, 2020-2035
  • Table 51: South Asia Market Value (USD Million) Forecast by Country, 2020-2035
  • Table 52: South Asia Market Volume (Units) Forecast by Country, 2020-2035
  • Table 53: South Asia Market Value (USD Million) Forecast By Thickness (GSM), 2020-2035
  • Table 54: South Asia Market Volume (Units) Forecast By Thickness (GSM), 2020-2035
  • Table 55: South Asia Market Value (USD Million) Forecast By Paper Type, 2020-2035
  • Table 56: South Asia Market Volume (Units) Forecast By Paper Type, 2020-2035
  • Table 57: South Asia Market Value (USD Million) Forecast By Product Type, 2020-2035
  • Table 58: South Asia Market Volume (Units) Forecast By Product Type, 2020-2035
  • Table 59: South Asia Market Value (USD Million) Forecast By End Use, 2020-2035
  • Table 60: South Asia Market Volume (Units) Forecast By End Use, 2020-2035
  • Table 61: Oceania Market Value (USD Million) Forecast by Country, 2020-2035
  • Table 62: Oceania Market Volume (Units) Forecast by Country, 2020-2035
  • Table 63: Oceania Market Value (USD Million) Forecast By Thickness (GSM), 2020-2035
  • Table 64: Oceania Market Volume (Units) Forecast By Thickness (GSM), 2020-2035
  • Table 65: Oceania Market Value (USD Million) Forecast By Paper Type, 2020-2035
  • Table 66: Oceania Market Volume (Units) Forecast By Paper Type, 2020-2035
  • Table 67: Oceania Market Value (USD Million) Forecast By Product Type, 2020-2035
  • Table 68: Oceania Market Volume (Units) Forecast By Product Type, 2020-2035
  • Table 69: Oceania Market Value (USD Million) Forecast By End Use, 2020-2035
  • Table 70: Oceania Market Volume (Units) Forecast By End Use, 2020-2035
  • Table 71: MEA Market Value (USD Million) Forecast by Country, 2020-2035
  • Table 72: MEA Market Volume (Units) Forecast by Country, 2020-2035
  • Table 73: MEA Market Value (USD Million) Forecast By Thickness (GSM), 2020-2035
  • Table 74: MEA Market Volume (Units) Forecast By Thickness (GSM), 2020-2035
  • Table 75: MEA Market Value (USD Million) Forecast By Paper Type, 2020-2035
  • Table 76: MEA Market Volume (Units) Forecast By Paper Type, 2020-2035
  • Table 77: MEA Market Value (USD Million) Forecast By Product Type, 2020-2035
  • Table 78: MEA Market Volume (Units) Forecast By Product Type, 2020-2035
  • Table 79: MEA Market Value (USD Million) Forecast By End Use, 2020-2035
  • Table 80: MEA Market Volume (Units) Forecast By End Use, 2020-2035

List of Figures

  • Figure 1: Global Market Volume (Units) Forecast 2020-2035
  • Figure 2: Global Market Pricing Analysis
  • Figure 3: Global Market Value (USD Million) Forecast 2020-2035
  • Figure 4: Global Market Value Share and BPS Analysis By Thickness (GSM), 2025 and 2035
  • Figure 5: Global Market Y-o-Y Growth Comparison By Thickness (GSM), 2025-2035
  • Figure 6: Global Market Attractiveness Analysis By Thickness (GSM)
  • Figure 7: Global Market Value Share and BPS Analysis By Paper Type, 2025 and 2035
  • Figure 8: Global Market Y-o-Y Growth Comparison By Paper Type, 2025-2035
  • Figure 9: Global Market Attractiveness Analysis By Paper Type
  • Figure 10: Global Market Value Share and BPS Analysis By Product Type, 2025 and 2035
  • Figure 11: Global Market Y-o-Y Growth Comparison By Product Type, 2025-2035
  • Figure 12: Global Market Attractiveness Analysis By Product Type
  • Figure 13: Global Market Value Share and BPS Analysis By End Use, 2025 and 2035
  • Figure 14: Global Market Y-o-Y Growth Comparison By End Use, 2025-2035
  • Figure 15: Global Market Attractiveness Analysis By End Use
  • Figure 16: Global Market Value (USD Million) Share and BPS Analysis by Region, 2025 and 2035
  • Figure 17: Global Market Y-o-Y Growth Comparison by Region, 2025-2035
  • Figure 18: Global Market Attractiveness Analysis by Region
  • Figure 19: North America Market Incremental $ Opportunity, 2025-2035
  • Figure 20: Latin America Market Incremental $ Opportunity, 2025-2035
  • Figure 21: Europe Market Incremental $ Opportunity, 2025-2035
  • Figure 22: East Asia Market Incremental $ Opportunity, 2025-2035
  • Figure 23: South Asia Market Incremental $ Opportunity, 2025-2035
  • Figure 24: Oceania Market Incremental $ Opportunity, 2025-2035
  • Figure 25: MEA Market Incremental $ Opportunity, 2025-2035
  • Figure 26: North America Market Value Share and BPS Analysis by Country, 2025 and 2035
  • Figure 27: North America Market Value Share and BPS Analysis By Thickness (GSM), 2025 and 2035
  • Figure 28: North America Market Y-o-Y Growth Comparison By Thickness (GSM), 2025-2035
  • Figure 29: North America Market Attractiveness Analysis By Thickness (GSM)
  • Figure 30: North America Market Value Share and BPS Analysis By Paper Type, 2025 and 2035
  • Figure 31: North America Market Y-o-Y Growth Comparison By Paper Type, 2025-2035
  • Figure 32: North America Market Attractiveness Analysis By Paper Type
  • Figure 33: North America Market Value Share and BPS Analysis By Product Type, 2025 and 2035
  • Figure 34: North America Market Y-o-Y Growth Comparison By Product Type, 2025-2035
  • Figure 35: North America Market Attractiveness Analysis By Product Type
  • Figure 36: North America Market Value Share and BPS Analysis By End Use, 2025 and 2035
  • Figure 37: North America Market Y-o-Y Growth Comparison By End Use, 2025-2035
  • Figure 38: North America Market Attractiveness Analysis By End Use
  • Figure 39: Latin America Market Value Share and BPS Analysis by Country, 2025 and 2035
  • Figure 40: Latin America Market Value Share and BPS Analysis By Thickness (GSM), 2025 and 2035
  • Figure 41: Latin America Market Y-o-Y Growth Comparison By Thickness (GSM), 2025-2035
  • Figure 42: Latin America Market Attractiveness Analysis By Thickness (GSM)
  • Figure 43: Latin America Market Value Share and BPS Analysis By Paper Type, 2025 and 2035
  • Figure 44: Latin America Market Y-o-Y Growth Comparison By Paper Type, 2025-2035
  • Figure 45: Latin America Market Attractiveness Analysis By Paper Type
  • Figure 46: Latin America Market Value Share and BPS Analysis By Product Type, 2025 and 2035
  • Figure 47: Latin America Market Y-o-Y Growth Comparison By Product Type, 2025-2035
  • Figure 48: Latin America Market Attractiveness Analysis By Product Type
  • Figure 49: Latin America Market Value Share and BPS Analysis By End Use, 2025 and 2035
  • Figure 50: Latin America Market Y-o-Y Growth Comparison By End Use, 2025-2035
  • Figure 51: Latin America Market Attractiveness Analysis By End Use
  • Figure 52: Europe Market Value Share and BPS Analysis by Country, 2025 and 2035
  • Figure 53: Europe Market Value Share and BPS Analysis By Thickness (GSM), 2025 and 2035
  • Figure 54: Europe Market Y-o-Y Growth Comparison By Thickness (GSM), 2025-2035
  • Figure 55: Europe Market Attractiveness Analysis By Thickness (GSM)
  • Figure 56: Europe Market Value Share and BPS Analysis By Paper Type, 2025 and 2035
  • Figure 57: Europe Market Y-o-Y Growth Comparison By Paper Type, 2025-2035
  • Figure 58: Europe Market Attractiveness Analysis By Paper Type
  • Figure 59: Europe Market Value Share and BPS Analysis By Product Type, 2025 and 2035
  • Figure 60: Europe Market Y-o-Y Growth Comparison By Product Type, 2025-2035
  • Figure 61: Europe Market Attractiveness Analysis By Product Type
  • Figure 62: Europe Market Value Share and BPS Analysis By End Use, 2025 and 2035
  • Figure 63: Europe Market Y-o-Y Growth Comparison By End Use, 2025-2035
  • Figure 64: Europe Market Attractiveness Analysis By End Use
  • Figure 65: East Asia Market Value Share and BPS Analysis by Country, 2025 and 2035
  • Figure 66: East Asia Market Value Share and BPS Analysis By Thickness (GSM), 2025 and 2035
  • Figure 67: East Asia Market Y-o-Y Growth Comparison By Thickness (GSM), 2025-2035
  • Figure 68: East Asia Market Attractiveness Analysis By Thickness (GSM)
  • Figure 69: East Asia Market Value Share and BPS Analysis By Paper Type, 2025 and 2035
  • Figure 70: East Asia Market Y-o-Y Growth Comparison By Paper Type, 2025-2035
  • Figure 71: East Asia Market Attractiveness Analysis By Paper Type
  • Figure 72: East Asia Market Value Share and BPS Analysis By Product Type, 2025 and 2035
  • Figure 73: East Asia Market Y-o-Y Growth Comparison By Product Type, 2025-2035
  • Figure 74: East Asia Market Attractiveness Analysis By Product Type
  • Figure 75: East Asia Market Value Share and BPS Analysis By End Use, 2025 and 2035
  • Figure 76: East Asia Market Y-o-Y Growth Comparison By End Use, 2025-2035
  • Figure 77: East Asia Market Attractiveness Analysis By End Use
  • Figure 78: South Asia Market Value Share and BPS Analysis by Country, 2025 and 2035
  • Figure 79: South Asia Market Value Share and BPS Analysis By Thickness (GSM), 2025 and 2035
  • Figure 80: South Asia Market Y-o-Y Growth Comparison By Thickness (GSM), 2025-2035
  • Figure 81: South Asia Market Attractiveness Analysis By Thickness (GSM)
  • Figure 82: South Asia Market Value Share and BPS Analysis By Paper Type, 2025 and 2035
  • Figure 83: South Asia Market Y-o-Y Growth Comparison By Paper Type, 2025-2035
  • Figure 84: South Asia Market Attractiveness Analysis By Paper Type
  • Figure 85: South Asia Market Value Share and BPS Analysis By Product Type, 2025 and 2035
  • Figure 86: South Asia Market Y-o-Y Growth Comparison By Product Type, 2025-2035
  • Figure 87: South Asia Market Attractiveness Analysis By Product Type
  • Figure 88: South Asia Market Value Share and BPS Analysis By End Use, 2025 and 2035
  • Figure 89: South Asia Market Y-o-Y Growth Comparison By End Use, 2025-2035
  • Figure 90: South Asia Market Attractiveness Analysis By End Use
  • Figure 91: Oceania Market Value Share and BPS Analysis by Country, 2025 and 2035
  • Figure 92: Oceania Market Value Share and BPS Analysis By Thickness (GSM), 2025 and 2035
  • Figure 93: Oceania Market Y-o-Y Growth Comparison By Thickness (GSM), 2025-2035
  • Figure 94: Oceania Market Attractiveness Analysis By Thickness (GSM)
  • Figure 95: Oceania Market Value Share and BPS Analysis By Paper Type, 2025 and 2035
  • Figure 96: Oceania Market Y-o-Y Growth Comparison By Paper Type, 2025-2035
  • Figure 97: Oceania Market Attractiveness Analysis By Paper Type
  • Figure 98: Oceania Market Value Share and BPS Analysis By Product Type, 2025 and 2035
  • Figure 99: Oceania Market Y-o-Y Growth Comparison By Product Type, 2025-2035
  • Figure 100: Oceania Market Attractiveness Analysis By Product Type
  • Figure 101: Oceania Market Value Share and BPS Analysis By End Use, 2025 and 2035
  • Figure 102: Oceania Market Y-o-Y Growth Comparison By End Use, 2025-2035
  • Figure 103: Oceania Market Attractiveness Analysis By End Use
  • Figure 104: MEA Market Value Share and BPS Analysis by Country, 2025 and 2035
  • Figure 105: MEA Market Value Share and BPS Analysis By Thickness (GSM), 2025 and 2035
  • Figure 106: MEA Market Y-o-Y Growth Comparison By Thickness (GSM), 2025-2035
  • Figure 107: MEA Market Attractiveness Analysis By Thickness (GSM)
  • Figure 108: MEA Market Value Share and BPS Analysis By Paper Type, 2025 and 2035
  • Figure 109: MEA Market Y-o-Y Growth Comparison By Paper Type, 2025-2035
  • Figure 110: MEA Market Attractiveness Analysis By Paper Type
  • Figure 111: MEA Market Value Share and BPS Analysis By Product Type, 2025 and 2035
  • Figure 112: MEA Market Y-o-Y Growth Comparison By Product Type, 2025-2035
  • Figure 113: MEA Market Attractiveness Analysis By Product Type
  • Figure 114: MEA Market Value Share and BPS Analysis By End Use, 2025 and 2035
  • Figure 115: MEA Market Y-o-Y Growth Comparison By End Use, 2025-2035
  • Figure 116: MEA Market Attractiveness Analysis By End Use
  • Figure 117: Global Market - Tier Structure Analysis
  • Figure 118: Global Market - Company Share Analysis

Frequently Asked Questions

What was the overall size of the food punnets market in 2025?

The overall market size for food punnets market was USD 1.4 billion in 2025.

How big the food punnets market is expected in 2035?

The food punnets market expected to reach USD 2.0 billion in 2035.

What will drive the demand for food punnets market during the forecast period?

The demand for the food punnets market will be driven by increasing demand for sustainable and eco-friendly packaging, rising fresh produce consumption, growth in the convenience food sector, stringent government regulations on plastic use, and advancements in biodegradable and recyclable packaging materials.

List the top 5 countries contributing food punnets market?

The top 5 countries which drives the development of food punnets market are USA, UK, Europe Union, Japan and South Korea.

Which segment in type is expected to lead food punnets market?

PET and polylactic acid (PLA) punnets drive market growth to command significant share over the assessment period.

Explore Similar Insights

Future Market Insights

Food Punnets Market