Food Allergen Testing Market Size and Share Forecast Outlook 2025 to 2035

The global food allergen testing market is valued at USD 970.3 million in 2025 and is slated to reach USD 2,062.6 million by 2035, reflecting a CAGR of 7.8%.
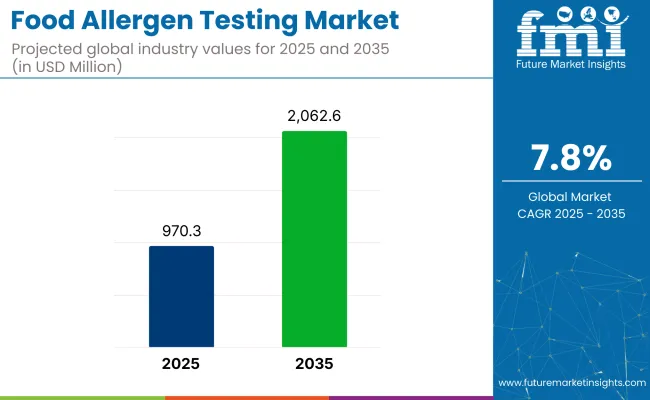
Quick Stats For food allergen testing market

  • Market Value (2025): USD 970.3 million
  • Forecast Value (2035): USD 2,062.6 million
  • Forecast CAGR: 7.8%
  • Technology Leader in 2025: PCR-based testing (35.4% Market Share)
  • Top Application Segment: Processed Food (28% Market Share in 2025)
  • Key Growth Region: East Asia (Japan is the fastest-growing market with 6.5% CAGR)

Food Allergen Testing Market

Metric Value
2025 Market Value USD 970.3 million
2035 Market Value USD 2,062.6 million
CAGR (2025 to 2035) 7.8%

This growth is being driven by increasing consumer health awareness, the rising prevalence of food allergies, and stringent food safety regulations that mandate allergen labeling across regions. Additionally, the expanding packaged and processed food sector, coupled with innovations in multiplex allergen testing and AI-based analysis, is expected to fuel market demand over the forecast period.

Japan is projected to grow at a CAGR of 6.5% from 2025 to 2035, driven by rising seafood and wheat allergies and strict labelling regulations. The UK is expected to record a 6.2% CAGR, supported by consumer demand for allergen labelling and Natasha’s Law enforcement.

Germany will grow at a 6.1% CAGR due to strict EU food safety standards and high allergy prevalence. PCR-based testing is expected to lead the technology segment with a 35.4% share, while processed food remains the dominant application segment, holding a 28% market share in 2025.

The food allergen testing market holds a 10-15% share within the broader food safety testing market, reflecting its growing importance in ensuring consumer safety against allergenic risks. Within the food diagnostics market, it accounts for around 8-10%, driven by the rising demand for specialised allergen detection technologies.

In the overall food testing and inspection market, its share is estimated at 5-7%, as microbial, chemical, and nutritional testing dominate this segment. However, the market’s share is expected to increase steadily due to stringent regulations, the rising prevalence of food allergies, and growing investments by manufacturers in allergen-specific testing to ensure compliance and maintain consumer trust.

Food Allergen Testing Market Analysis by Top Investment Segments

The food allergen testing market is segmented by source, technology, application, and region. By source, the market includes milk, eggs, fish, tree nuts, peanuts, wheat, soybeans, sesame, shellfish, and others (lupin, casein, mustard, celery, molluscs, sulphites, buckwheat). Based on technology, it is segmented into polymerase chain reaction (PCR), enzyme-linked immunosorbent assay (ELISA), lateral flow devices (LFD), high-performance liquid chromatography (HPLC), and fluorescent assays.

By application, the market includes bakery and confectionery, processed food, infant formula and baby food, beverages, meat and seafood, dairy products, and others (sauces and dressings, ready-to-eat meals, snacks, spices and seasonings, food ingredients and additives). Regionally, the market is segmented into North America, Latin America, Western Europe, Eastern Europe, Balkans & Baltic, Russia & Belarus, Central Asia, East Asia, South Asia & Pacific, and the Middle East & Africa.

Milk to Lead the Source Segment with 25% Market Share in 2025

Milk has emerged as the most lucrative segment in the food allergen testing market and is expected to hold approximately 25% share in 2025.

  • Manufacturers focus on milk allergen testing to keep dairy products and processed foods contamination-free.
  • Strict labelling regulations, like FDA requirements, drive demand for accurate testing methods such as PCR and ELISA.

Polymerase Chain Reaction (PCR) to Lead the Technology Segment with 35.4% Market Share in 2025

Polymerase Chain Reaction (PCR) is the most lucrative technology segment, and is projected to account for 35.4% market share in 2025.
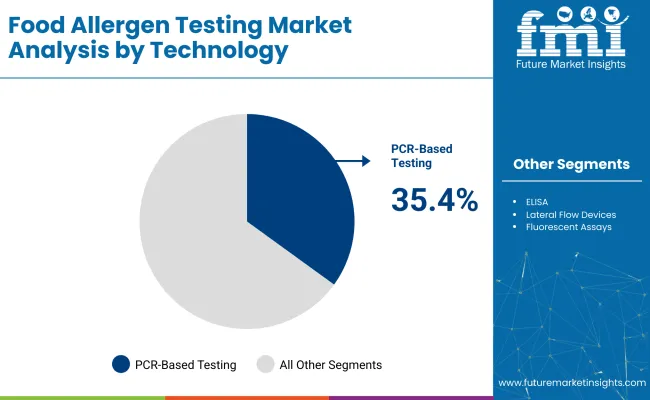
  • Manufacturers prefer PCR-based testing to ensure strict compliance with global food safety regulations, as it reduces the risk of cross-contamination and enhances accuracy in allergen detection.
  • Multiplex PCR assays detect multiple allergens at once, reducing costs and streamlining quality assurance.

Food Allergen Testing Market By Technology

Processed Food to Lead the Application Segment with 28% Market Share in 2025

Processed food is the most lucrative application segment, accounting for approximately 28% of the market share in 2025.
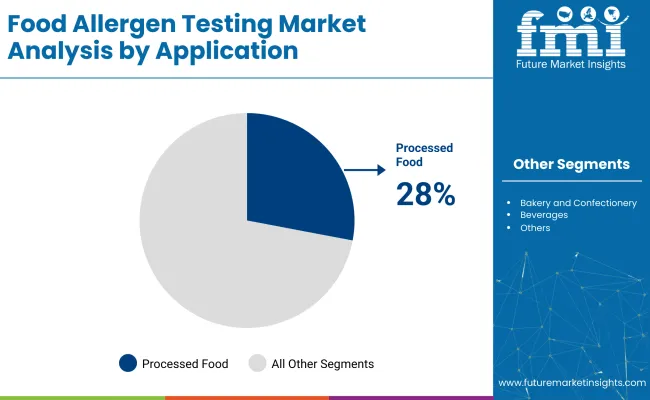
  • Manufacturers use rigorous allergen testing in processed foods to meet labelling regulations and avoid costly recalls.
  • The rising consumer demand for allergen-free packaged foods further boosts testing needs, as companies must validate their safety claims before distribution.

Food Allergen Testing Market By Application

Top Food Allergen Testing Market Dynamics

The global food allergen testing market is growing steadily, driven by rising food allergy cases, increasing consumer demand for allergen-free products, and advancements in testing technologies, including PCR, ELISA, and multiplex assays.

Recent Trends in the Food Allergen Testing Market

  • Manufacturers are adopting multiplex allergen testing solutions to detect multiple allergens simultaneously.
  • AI and machine learning are being integrated to improve testing accuracy and data analysis.
  • Demand for portable, rapid on-site testing devices is increasing among food processors and retailers.
  • Biosensor-based allergen testing is gaining popularity for real-time monitoring in production facilities.

Challenges in the Food Allergen Testing Market
  • High costs associated with advanced allergen testing technologies limit adoption by small manufacturers.
  • The lack of standardized testing protocols across regions creates compliance complexities.
  • Cross-contamination risks remain high in multi-product processing facilities despite rigorous testing.
  • Complex food matrices often pose difficulties in achieving accurate allergen detection results.

Analyzing Top Countries Implementing and Expanding Food Allergen Testing

Country Wise Analysis Of Food Allergen Testing Market

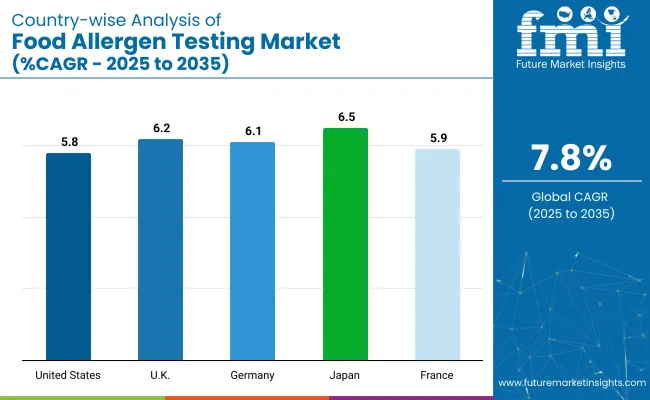
Japan is projected to record the highest CAGR among these countries, at 6.5% from 2025 to 2035, driven by rising seafood and wheat allergies, as well as strict labeling regulations. The United Kingdom follows closely with a 6.2% CAGR.

Germany is expected to grow at a 6.1% CAGR due to strict EU food safety standards and a high prevalence of allergies. France shows slightly lower growth at a 5.9% CAGR, while the United States records the weakest among them at a 5.8% CAGR, despite having strong regulatory frameworks and high allergy rates.

The report covers an in-depth analysis of 40+ countries; five top-performing OECD countries are highlighted below. 

USA Food Allergen Testing Market Analysis

The USA food allergen testing market is projected to grow at a CAGR of 5.8% from 2025 to 2035.

  • Growing prevalence of peanut, tree nut, and milk allergies.
  • Stringent FDA regulations mandating allergen labelling.
  • Widespread use of PCR and multiplex testing solutions.
  • Strong presence of leading players like Eurofins Scientific and SGS.

Food Allergen Testing Demand Analysis in the UK

UK food allergen testing revenue is expected to grow at a CAGR of 6.2% from 2025 to 2035.

  • Enforcement of Natasha’s Law, enhancing compliance with allergen labelling.
  • High demand for rapid and on-site allergen testing devices.
  • Strong consumer preference for allergen-free bakery and snacks.
  • The growing processed and packaged food industry requires routine testing.

Germany Food Allergen Testing Market Analysis

Germany’s food allergen testing demand is anticipated to grow at a CAGR of 6.1% from 2025 to 2035.

  • Strong adherence to the EU Food Information for Consumers Regulation.
  • High prevalence of milk, wheat, and nut allergies.
  • Increased adoption of multiplex PCR and ELISA technologies.
  • Focus on food safety in the bakery, dairy, and meat sectors.

France Food Allergen Testing Market Analysis

Sales of food allergen testing products in France are forecasted to expand at a CAGR of 5.9% from 2025 to 2035.

  • Increasing milk and tree nut allergy prevalence.
  • Adoption of rapid testing kits in food manufacturing plants.
  • High consumer demand for allergen-free bakery and dairy products.
  • Presence of multinational testing providers like Bureau Veritas.

Food Allergen Testing Demand Analysis in Japan

Sales of food allergen testing products in Japan are projected to register a CAGR of 6.5% from 2025 to 2035.

  • Rising wheat and seafood allergy cases among consumers.
  • Strong regulatory framework for allergen declaration.
  • High demand for allergen testing in processed seafood and noodles.
  • Presence of domestic and international food testing laboratories.

Leading Food Allergen Testing Product Manufacturers and Suppliers

The food allergen testing market is moderately consolidated, with a few large multinational companies dominating global operations while several regional players serve niche markets. Leading companies compete primarily through technological innovation, service expansions, acquisitions, and strategic partnerships to strengthen their portfolios and global presence.

Top players, including Eurofins Scientific, SGS S.A., Intertek Group plc, Bureau Veritas, and Neogen Corporation, focus on expanding their testing capabilities by adopting advanced technologies such as PCR, ELISA, and multiplex assays. These companies maintain competitive pricing structures for routine testing services while investing significantly in R&D to develop sensitive, rapid, and accurate allergen detection solutions that comply with stringent food safety regulations worldwide.

Recent Food Allergen Testing Industry News

  • In January 2025, Mérieux NutriSciences completed the acquisition of Bureau Veritas' food testing activities in the USA and Canada, expanding its presence in North America.
  • In March 2024, Gold standard diagnostics launched the first product of the new allergen Powerline tests.

Food Allergen Testing Market Report Scope

Report Attributes Details
Current Total Market Size (2025) USD 970.3 million
Projected Market Size (2035) USD 2,062.6 million
CAGR (2025 to 2035) 7.8%
Base Year for Estimation 2024
Historical Period 2020 to 2024
Projections Period 2025 to 2035
Market Analysis Parameters Revenue in USD million/Volume (Units)
By Source Milk, Eggs, Fish, Tree Nuts, Peanuts, Wheat, Soybean, Sesame, Shellfish, Others (Lupin, Casein, etc.)
By Technology Polymerase Chain Reaction (PCR), Enzyme-Linked Immunosorbent Assay (ELISA), Lateral Flow Devices (LFD), High-Performance Liquid Chromatography (HPLC), Fluorescent Assays
By Application Bakery and Confectionery, Processed Food, Infant Formula and Baby Food, Beverages, Meat and Seafood, Dairy Products, Others (Sauces and Dressings, Ready-to-Eat Meals, Spices and Seasonings, and Food Ingredients and Additives)
Regions Covered North America, Latin America, Western Europe, Eastern Europe, East Asia, South Asia & Pacific, Middle East & Africa
Countries Covered United States, Canada, United Kingdom, Germany, France, China, Japan, South Korea, Brazil, Australia
Key Players Eurofins Scientific, SGS S.A., Intertek Group plc, Bureau Veritas, Neogen Corporation, ALS Limited, Mérieux NutriSciences Corporation, TÜV SÜD, Microbac Laboratories, Inc., Romer Labs Diagnostic GmbH, Symbio Laboratories, Charm Sciences, Inc., R-Biopharm AG, ELISA Technologies, Inc., VWR International, LLC.
Additional Attributes Dollar sales by value, market share analysis by region, and country-wise analysis

Key Segments

By Source:

As per Source, the industry has been categorized into Milk, Eggs, Fish, Tree nuts, Peanuts, Wheat, Soybean, Sesame, Shellfish, and Others (Lupin, Caesin, etc.).

By Technology:

As per Technology, the industry has been categorized into Polymerase Chain Reaction (PCR), Enzyme-Linked Immunosorbent Assay (ELISA), Lateral Flow Devices (LFD), High-Performance Liquid Chromatography (HPLC), and Fluorescent Assay.

By Application:

As per Application, the industry has been categorized into Bakery and Confectionery, Processed Food, Infant Formula and Baby Food, Beverages, Meat and Seafood, Dairy Products, and Others.

By Region:

Industry analysis has been carried out in key countries of North America, Latin America, Western Europe, Eastern Europe, East Asia, South Asia & Pacific, Central Asia, Russia & Belarus, Balkan & Baltics, and the Middle East & Africa.

Table of Content

  1. Executive Summary
    • Global Market Outlook
    • Demand-side Trends
    • Supply-side Trends
    • Technology Roadmap Analysis
    • Analysis and Recommendations
  2. Market Overview
    • Market Coverage / Taxonomy
    • Market Definition / Scope / Limitations
  3. Market Background
    • Market Dynamics
      • Drivers
      • Restraints
      • Opportunity
      • Trends
    • Scenario Forecast
      • Demand in Optimistic Scenario
      • Demand in Likely Scenario
      • Demand in Conservative Scenario
    • Opportunity Map Analysis
    • Product Life Cycle Analysis
    • Supply Chain Analysis
      • Supply Side Participants and their Roles
        • Producers
        • Mid-Level Participants (Traders/ Agents/ Brokers)
        • Wholesalers and Distributors
      • Value Added and Value Created at Node in the Supply Chain
      • List of Raw Material Suppliers
      • List of Existing and Potential Buyer’s
    • Investment Feasibility Matrix
    • Value Chain Analysis
      • Profit Margin Analysis
      • Wholesalers and Distributors
      • Retailers
    • PESTLE and Porter’s Analysis
    • Regulatory Landscape
      • By Key Regions
      • By Key Countries
    • Regional Parent Market Outlook
    • Production and Consumption Statistics
    • Import and Export Statistics
  4. Global Market Analysis 2020 to 2024 and Forecast, 2025 to 2035
    • Historical Market Size Value (USD Million) & Volume (Units) Analysis, 2020 to 2024
    • Current and Future Market Size Value (USD Million) & Volume (Units) Projections, 2025 to 2035
      • Y-o-Y Growth Trend Analysis
      • Absolute $ Opportunity Analysis
  5. Global Market Pricing Analysis 2020 to 2024 and Forecast 2025 to 2035
  6. Global Market Analysis 2020 to 2024 and Forecast 2025 to 2035, By Source
    • Introduction / Key Findings
    • Historical Market Size Value (USD Million) & Volume (Units) Analysis By Source, 2020 to 2024
    • Current and Future Market Size Value (USD Million) & Volume (Units) Analysis and Forecast By Source, 2025 to 2035
      • Milk
      • Eggs
      • Fish
      • Tree Nuts
      • Peanuts
      • Wheat
      • Soybean
      • Sesame
      • Shellfish
      • Others
        • Lupin
        • casein
        • Mustard
        • Celery
    • Y-o-Y Growth Trend Analysis By Source, 2020 to 2024
    • Absolute $ Opportunity Analysis By Source, 2025 to 2035
  7. Global Market Analysis 2020 to 2024 and Forecast 2025 to 2035, By Technology
    • Introduction / Key Findings
    • Historical Market Size Value (USD Million) & Volume (Units) Analysis By Technology, 2020 to 2024
    • Current and Future Market Size Value (USD Million) & Volume (Units) Analysis and Forecast By Technology, 2025 to 2035
      • Polymerase Chain Reaction (PCR)
      • Enzyme-Linked Immunosorbent Assay (ELISA)
      • Lateral Flow Devices (LFD)
      • High-Performance Liquid Chromatography (HPLC)
      • Fluorescent Assays
    • Y-o-Y Growth Trend Analysis By Technology, 2020 to 2024
    • Absolute $ Opportunity Analysis By Technology, 2025 to 2035
  8. Global Market Analysis 2020 to 2024 and Forecast 2025 to 2035, By Application
    • Introduction / Key Findings
    • Historical Market Size Value (USD Million) & Volume (Units) Analysis By Application, 2020 to 2024
    • Current and Future Market Size Value (USD Million) & Volume (Units) Analysis and Forecast By Application, 2025 to 2035
      • Bakery and Confectionery
      • Processed Food
      • Infant Formula and Baby Food
      • Beverages
      • Meat and Seafood
      • Dairy Products
      • Others
        • Sauces and Dressings
        • Ready-to-eat Meals
        • Snacks
        • Spices and Seasonings
    • Y-o-Y Growth Trend Analysis By Application, 2020 to 2024
    • Absolute $ Opportunity Analysis By Application, 2025 to 2035
  9. Global Market Analysis 2020 to 2024 and Forecast 2025 to 2035, By Region
    • Introduction
    • Historical Market Size Value (USD Million) & Volume (Units) Analysis By Region, 2020 to 2024
    • Current Market Size Value (USD Million) & Volume (Units) Analysis and Forecast By Region, 2025 to 2035
      • North America
      • Latin America
      • Western Europe
      • Eastern Europe
      • East Asia
      • South Asia & Pacific
      • Middle East and Africa
    • Market Attractiveness Analysis By Region
  10. North America Market Analysis 2020 to 2024 and Forecast 2025 to 2035, By Country
    • Historical Market Size Value (USD Million) & Volume (Units) Trend Analysis By Market Taxonomy, 2020 to 2024
    • Market Size Value (USD Million) & Volume (Units) Forecast By Market Taxonomy, 2025 to 2035
      • By Country
        • USA
        • Canada
        • Mexico
      • By Source
      • By Technology
      • By Application
    • Market Attractiveness Analysis
      • By Country
      • By Source
      • By Technology
      • By Application
    • Key Takeaways
  11. Latin America Market Analysis 2020 to 2024 and Forecast 2025 to 2035, By Country
    • Historical Market Size Value (USD Million) & Volume (Units) Trend Analysis By Market Taxonomy, 2020 to 2024
    • Market Size Value (USD Million) & Volume (Units) Forecast By Market Taxonomy, 2025 to 2035
      • By Country
        • Brazil
        • Argentina
        • Rest of LATAM
      • By Source
      • By Technology
      • By Application
    • Market Attractiveness Analysis
      • By Country
      • By Source
      • By Technology
      • By Application
    • Key Takeaways
  12. Western Europe Market Analysis 2020 to 2024 and Forecast 2025 to 2035, By Country
    • Historical Market Size Value (USD Million) & Volume (Units) Trend Analysis By Market Taxonomy, 2020 to 2024
    • Market Size Value (USD Million) & Volume (Units) Forecast By Market Taxonomy, 2025 to 2035
      • By Country
        • Germany
        • Italy
        • France
        • UK
        • Spain
        • BENELUX
        • Nordic
        • Rest of W.Europe
      • By Source
      • By Technology
      • By Application
    • Market Attractiveness Analysis
      • By Country
      • By Source
      • By Technology
      • By Application
    • Key Takeaways
  13. Eastern Europe Market Analysis 2020 to 2024 and Forecast 2025 to 2035, By Country
    • Historical Market Size Value (USD Million) & Volume (Units) Trend Analysis By Market Taxonomy, 2020 to 2024
    • Market Size Value (USD Million) & Volume (Units) Forecast By Market Taxonomy, 2025 to 2035
      • By Country
        • Russia
        • Hungary
        • Poland
        • Balkan & Baltics
        • Rest of E. Europe
      • By Source
      • By Technology
      • By Application
    • Market Attractiveness Analysis
      • By Country
      • By Source
      • By Technology
      • By Application
    • Key Takeaways
  14. East Asia Market Analysis 2020 to 2024 and Forecast 2025 to 2035, By Country
    • Historical Market Size Value (USD Million) & Volume (Units) Trend Analysis By Market Taxonomy, 2020 to 2024
    • Market Size Value (USD Million) & Volume (Units) Forecast By Market Taxonomy, 2025 to 2035
      • By Country
        • China
        • Japan
        • South Korea
      • By Source
      • By Technology
      • By Application
    • Market Attractiveness Analysis
      • By Country
      • By Source
      • By Technology
      • By Application
    • Key Takeaways
  15. South Asia & Pacific Market Analysis 2020 to 2024 and Forecast 2025 to 2035, By Country
    • Historical Market Size Value (USD Million) & Volume (Units) Trend Analysis By Market Taxonomy, 2020 to 2024
    • Market Size Value (USD Million) & Volume (Units) Forecast By Market Taxonomy, 2025 to 2035
      • By Country
        • India
        • Australia & New Zealand
        • ASEAN
        • Rest of SAP
      • By Source
      • By Technology
      • By Application
    • Market Attractiveness Analysis
      • By Country
      • By Source
      • By Technology
      • By Application
    • Key Takeaways
  16. Middle East and Africa Market Analysis 2020 to 2024 and Forecast 2025 to 2035, By Country
    • Historical Market Size Value (USD Million) & Volume (Units) Trend Analysis By Market Taxonomy, 2020 to 2024
    • Market Size Value (USD Million) & Volume (Units) Forecast By Market Taxonomy, 2025 to 2035
      • By Country
        • GCC Countries
        • Northern Africa
        • South Africa
        • Turkiye
        • Rest of MEA
      • By Source
      • By Technology
      • By Application
    • Market Attractiveness Analysis
      • By Country
      • By Source
      • By Technology
      • By Application
    • Key Takeaways
  17. Key Countries Market Analysis
    • USA
      • Pricing Analysis
      • Market Share Analysis, 2024
        • By Source
        • By Technology
        • By Application
    • Canada
      • Pricing Analysis
      • Market Share Analysis, 2024
        • By Source
        • By Technology
        • By Application
    • Brazil
      • Pricing Analysis
      • Market Share Analysis, 2024
        • By Source
        • By Technology
        • By Application
    • Mexico
      • Pricing Analysis
      • Market Share Analysis, 2024
        • By Source
        • By Technology
        • By Application
    • Argentina
      • Pricing Analysis
      • Market Share Analysis, 2024
        • By Source
        • By Technology
        • By Application
  18. Market Structure Analysis
    • Competition Dashboard
    • Competition Benchmarking
    • Market Share Analysis of Top Players
      • By Regional
      • By Source
      • By Technology
      • By Application
  19. Competition Analysis
    • Competition Deep Dive
      • Eurofins Scientific
        • Overview
        • Product Portfolio
        • Profitability by Market Segments (Product/Age /Sales Channel/Region)
        • Sales Footprint
        • Strategy Overview
          • Marketing Strategy
          • Product Strategy
          • Channel Strategy
      • SGS S.A.
        • Overview
        • Product Portfolio
        • Profitability by Market Segments (Product/Age /Sales Channel/Region)
        • Sales Footprint
        • Strategy Overview
          • Marketing Strategy
          • Product Strategy
          • Channel Strategy
      • Intertek Group plc
        • Overview
        • Product Portfolio
        • Profitability by Market Segments (Product/Age /Sales Channel/Region)
        • Sales Footprint
        • Strategy Overview
          • Marketing Strategy
          • Product Strategy
          • Channel Strategy
      • Bureau Veritas
        • Overview
        • Product Portfolio
        • Profitability by Market Segments (Product/Age /Sales Channel/Region)
        • Sales Footprint
        • Strategy Overview
          • Marketing Strategy
          • Product Strategy
          • Channel Strategy
      • Neogen Corporation
        • Overview
        • Product Portfolio
        • Profitability by Market Segments (Product/Age /Sales Channel/Region)
        • Sales Footprint
        • Strategy Overview
          • Marketing Strategy
          • Product Strategy
          • Channel Strategy
      • ALS Limited
        • Overview
        • Product Portfolio
        • Profitability by Market Segments (Product/Age /Sales Channel/Region)
        • Sales Footprint
        • Strategy Overview
          • Marketing Strategy
          • Product Strategy
          • Channel Strategy
      • Mérieux NutriSciences Corporation
        • Overview
        • Product Portfolio
        • Profitability by Market Segments (Product/Age /Sales Channel/Region)
        • Sales Footprint
        • Strategy Overview
          • Marketing Strategy
          • Product Strategy
          • Channel Strategy
      • TÜV SÜD
        • Overview
        • Product Portfolio
        • Profitability by Market Segments (Product/Age /Sales Channel/Region)
        • Sales Footprint
        • Strategy Overview
          • Marketing Strategy
          • Product Strategy
          • Channel Strategy
      • Microbac Laboratories, Inc.
        • Overview
        • Product Portfolio
        • Profitability by Market Segments (Product/Age /Sales Channel/Region)
        • Sales Footprint
        • Strategy Overview
          • Marketing Strategy
          • Product Strategy
          • Channel Strategy
      • Romer Labs Diagnostic GmbH
        • Overview
        • Product Portfolio
        • Profitability by Market Segments (Product/Age /Sales Channel/Region)
        • Sales Footprint
        • Strategy Overview
          • Marketing Strategy
          • Product Strategy
          • Channel Strategy
      • Symbio Laboratories
        • Overview
        • Product Portfolio
        • Profitability by Market Segments (Product/Age /Sales Channel/Region)
        • Sales Footprint
        • Strategy Overview
          • Marketing Strategy
          • Product Strategy
          • Channel Strategy
      • Charm Sciences, Inc
        • Overview
        • Product Portfolio
        • Profitability by Market Segments (Product/Age /Sales Channel/Region)
        • Sales Footprint
        • Strategy Overview
          • Marketing Strategy
          • Product Strategy
          • Channel Strategy
      • R-Biopharm AG
        • Overview
        • Product Portfolio
        • Profitability by Market Segments (Product/Age /Sales Channel/Region)
        • Sales Footprint
        • Strategy Overview
          • Marketing Strategy
          • Product Strategy
          • Channel Strategy
      • ELISA Technologies, Inc.
        • Overview
        • Product Portfolio
        • Profitability by Market Segments (Product/Age /Sales Channel/Region)
        • Sales Footprint
        • Strategy Overview
          • Marketing Strategy
          • Product Strategy
          • Channel Strategy
      • VWR International, LLC
        • Overview
        • Product Portfolio
        • Profitability by Market Segments (Product/Age /Sales Channel/Region)
        • Sales Footprint
        • Strategy Overview
          • Marketing Strategy
          • Product Strategy
          • Channel Strategy
  20. Assumptions & Acronyms Used
  21. Research Methodology

List of Tables

  • Table 1: Global Market Value (USD Million) Forecast by Region, 2020-2035
  • Table 2: Global Market Volume (Units) Forecast by Region, 2020-2035
  • Table 3: Global Market Value (USD Million) Forecast by Source, 2020-2035
  • Table 4: Global Market Volume (Units) Forecast by Source, 2020-2035
  • Table 5: Global Market Value (USD Million) Forecast by Technology, 2020-2035
  • Table 6: Global Market Volume (Units) Forecast by Technology, 2020-2035
  • Table 7: Global Market Value (USD Million) Forecast by Application, 2020-2035
  • Table 8: Global Market Volume (Units) Forecast by Application, 2020-2035
  • Table 9: North America Market Value (USD Million) Forecast by Country, 2020-2035
  • Table 10: North America Market Volume (Units) Forecast by Country, 2020-2035
  • Table 11: North America Market Value (USD Million) Forecast by Source, 2020-2035
  • Table 12: North America Market Volume (Units) Forecast by Source, 2020-2035
  • Table 13: North America Market Value (USD Million) Forecast by Technology, 2020-2035
  • Table 14: North America Market Volume (Units) Forecast by Technology, 2020-2035
  • Table 15: North America Market Value (USD Million) Forecast by Application, 2020-2035
  • Table 16: North America Market Volume (Units) Forecast by Application, 2020-2035
  • Table 17: Latin America Market Value (USD Million) Forecast by Country, 2020-2035
  • Table 18: Latin America Market Volume (Units) Forecast by Country, 2020-2035
  • Table 19: Latin America Market Value (USD Million) Forecast by Source, 2020-2035
  • Table 20: Latin America Market Volume (Units) Forecast by Source, 2020-2035
  • Table 21: Latin America Market Value (USD Million) Forecast by Technology, 2020-2035
  • Table 22: Latin America Market Volume (Units) Forecast by Technology, 2020-2035
  • Table 23: Latin America Market Value (USD Million) Forecast by Application, 2020-2035
  • Table 24: Latin America Market Volume (Units) Forecast by Application, 2020-2035
  • Table 25: Western Europe Market Value (USD Million) Forecast by Country, 2020-2035
  • Table 26: Western Europe Market Volume (Units) Forecast by Country, 2020-2035
  • Table 27: Western Europe Market Value (USD Million) Forecast by Source, 2020-2035
  • Table 28: Western Europe Market Volume (Units) Forecast by Source, 2020-2035
  • Table 29: Western Europe Market Value (USD Million) Forecast by Technology, 2020-2035
  • Table 30: Western Europe Market Volume (Units) Forecast by Technology, 2020-2035
  • Table 31: Western Europe Market Value (USD Million) Forecast by Application, 2020-2035
  • Table 32: Western Europe Market Volume (Units) Forecast by Application, 2020-2035
  • Table 33: Eastern Europe Market Value (USD Million) Forecast by Country, 2020-2035
  • Table 34: Eastern Europe Market Volume (Units) Forecast by Country, 2020-2035
  • Table 35: Eastern Europe Market Value (USD Million) Forecast by Source, 2020-2035
  • Table 36: Eastern Europe Market Volume (Units) Forecast by Source, 2020-2035
  • Table 37: Eastern Europe Market Value (USD Million) Forecast by Technology, 2020-2035
  • Table 38: Eastern Europe Market Volume (Units) Forecast by Technology, 2020-2035
  • Table 39: Eastern Europe Market Value (USD Million) Forecast by Application, 2020-2035
  • Table 40: Eastern Europe Market Volume (Units) Forecast by Application, 2020-2035
  • Table 41: East Asia Market Value (USD Million) Forecast by Country, 2020-2035
  • Table 42: East Asia Market Volume (Units) Forecast by Country, 2020-2035
  • Table 43: East Asia Market Value (USD Million) Forecast by Source, 2020-2035
  • Table 44: East Asia Market Volume (Units) Forecast by Source, 2020-2035
  • Table 45: East Asia Market Value (USD Million) Forecast by Technology, 2020-2035
  • Table 46: East Asia Market Volume (Units) Forecast by Technology, 2020-2035
  • Table 47: East Asia Market Value (USD Million) Forecast by Application, 2020-2035
  • Table 48: East Asia Market Volume (Units) Forecast by Application, 2020-2035
  • Table 49: South Asia & Pacific Market Value (USD Million) Forecast by Country, 2020-2035
  • Table 50: South Asia & Pacific Market Volume (Units) Forecast by Country, 2020-2035
  • Table 51: South Asia & Pacific Market Value (USD Million) Forecast by Source, 2020-2035
  • Table 52: South Asia & Pacific Market Volume (Units) Forecast by Source, 2020-2035
  • Table 53: South Asia & Pacific Market Value (USD Million) Forecast by Technology, 2020-2035
  • Table 54: South Asia & Pacific Market Volume (Units) Forecast by Technology, 2020-2035
  • Table 55: South Asia & Pacific Market Value (USD Million) Forecast by Application, 2020-2035
  • Table 56: South Asia & Pacific Market Volume (Units) Forecast by Application, 2020-2035
  • Table 57: Middle East and Africa Market Value (USD Million) Forecast by Country, 2020-2035
  • Table 58: Middle East and Africa Market Volume (Units) Forecast by Country, 2020-2035
  • Table 59: Middle East and Africa Market Value (USD Million) Forecast by Source, 2020-2035
  • Table 60: Middle East and Africa Market Volume (Units) Forecast by Source, 2020-2035
  • Table 61: Middle East and Africa Market Value (USD Million) Forecast by Technology, 2020-2035
  • Table 62: Middle East and Africa Market Volume (Units) Forecast by Technology, 2020-2035
  • Table 63: Middle East and Africa Market Value (USD Million) Forecast by Application, 2020-2035
  • Table 64: Middle East and Africa Market Volume (Units) Forecast by Application, 2020-2035

List of Figures

  • Figure 1: Global Market Volume (Units) Forecast 2020-2035
  • Figure 2: Global Market Pricing Analysis
  • Figure 3: Global Market Value (USD Million) Forecast 2020-2035
  • Figure 4: Global Market Value Share and BPS Analysis by Source, 2025 and 2035
  • Figure 5: Global Market Y-o-Y Growth Comparison by Source, 2025-2035
  • Figure 6: Global Market Attractiveness Analysis by Source
  • Figure 7: Global Market Value Share and BPS Analysis by Technology, 2025 and 2035
  • Figure 8: Global Market Y-o-Y Growth Comparison by Technology, 2025-2035
  • Figure 9: Global Market Attractiveness Analysis by Technology
  • Figure 10: Global Market Value Share and BPS Analysis by Application, 2025 and 2035
  • Figure 11: Global Market Y-o-Y Growth Comparison by Application, 2025-2035
  • Figure 12: Global Market Attractiveness Analysis by Application
  • Figure 13: Global Market Value (USD Million) Share and BPS Analysis by Region, 2025 and 2035
  • Figure 14: Global Market Y-o-Y Growth Comparison by Region, 2025-2035
  • Figure 15: Global Market Attractiveness Analysis by Region
  • Figure 16: North America Market Incremental $ Opportunity, 2025-2035
  • Figure 17: Latin America Market Incremental $ Opportunity, 2025-2035
  • Figure 18: Western Europe Market Incremental $ Opportunity, 2025-2035
  • Figure 19: Eastern Europe Market Incremental $ Opportunity, 2025-2035
  • Figure 20: East Asia Market Incremental $ Opportunity, 2025-2035
  • Figure 21: South Asia & Pacific Market Incremental $ Opportunity, 2025-2035
  • Figure 22: Middle East and Africa Market Incremental $ Opportunity, 2025-2035
  • Figure 23: North America Market Value Share and BPS Analysis by Country, 2025 and 2035
  • Figure 24: North America Market Value Share and BPS Analysis by Source, 2025 and 2035
  • Figure 25: North America Market Y-o-Y Growth Comparison by Source, 2025-2035
  • Figure 26: North America Market Attractiveness Analysis by Source
  • Figure 27: North America Market Value Share and BPS Analysis by Technology, 2025 and 2035
  • Figure 28: North America Market Y-o-Y Growth Comparison by Technology, 2025-2035
  • Figure 29: North America Market Attractiveness Analysis by Technology
  • Figure 30: North America Market Value Share and BPS Analysis by Application, 2025 and 2035
  • Figure 31: North America Market Y-o-Y Growth Comparison by Application, 2025-2035
  • Figure 32: North America Market Attractiveness Analysis by Application
  • Figure 33: Latin America Market Value Share and BPS Analysis by Country, 2025 and 2035
  • Figure 34: Latin America Market Value Share and BPS Analysis by Source, 2025 and 2035
  • Figure 35: Latin America Market Y-o-Y Growth Comparison by Source, 2025-2035
  • Figure 36: Latin America Market Attractiveness Analysis by Source
  • Figure 37: Latin America Market Value Share and BPS Analysis by Technology, 2025 and 2035
  • Figure 38: Latin America Market Y-o-Y Growth Comparison by Technology, 2025-2035
  • Figure 39: Latin America Market Attractiveness Analysis by Technology
  • Figure 40: Latin America Market Value Share and BPS Analysis by Application, 2025 and 2035
  • Figure 41: Latin America Market Y-o-Y Growth Comparison by Application, 2025-2035
  • Figure 42: Latin America Market Attractiveness Analysis by Application
  • Figure 43: Western Europe Market Value Share and BPS Analysis by Country, 2025 and 2035
  • Figure 44: Western Europe Market Value Share and BPS Analysis by Source, 2025 and 2035
  • Figure 45: Western Europe Market Y-o-Y Growth Comparison by Source, 2025-2035
  • Figure 46: Western Europe Market Attractiveness Analysis by Source
  • Figure 47: Western Europe Market Value Share and BPS Analysis by Technology, 2025 and 2035
  • Figure 48: Western Europe Market Y-o-Y Growth Comparison by Technology, 2025-2035
  • Figure 49: Western Europe Market Attractiveness Analysis by Technology
  • Figure 50: Western Europe Market Value Share and BPS Analysis by Application, 2025 and 2035
  • Figure 51: Western Europe Market Y-o-Y Growth Comparison by Application, 2025-2035
  • Figure 52: Western Europe Market Attractiveness Analysis by Application
  • Figure 53: Eastern Europe Market Value Share and BPS Analysis by Country, 2025 and 2035
  • Figure 54: Eastern Europe Market Value Share and BPS Analysis by Source, 2025 and 2035
  • Figure 55: Eastern Europe Market Y-o-Y Growth Comparison by Source, 2025-2035
  • Figure 56: Eastern Europe Market Attractiveness Analysis by Source
  • Figure 57: Eastern Europe Market Value Share and BPS Analysis by Technology, 2025 and 2035
  • Figure 58: Eastern Europe Market Y-o-Y Growth Comparison by Technology, 2025-2035
  • Figure 59: Eastern Europe Market Attractiveness Analysis by Technology
  • Figure 60: Eastern Europe Market Value Share and BPS Analysis by Application, 2025 and 2035
  • Figure 61: Eastern Europe Market Y-o-Y Growth Comparison by Application, 2025-2035
  • Figure 62: Eastern Europe Market Attractiveness Analysis by Application
  • Figure 63: East Asia Market Value Share and BPS Analysis by Country, 2025 and 2035
  • Figure 64: East Asia Market Value Share and BPS Analysis by Source, 2025 and 2035
  • Figure 65: East Asia Market Y-o-Y Growth Comparison by Source, 2025-2035
  • Figure 66: East Asia Market Attractiveness Analysis by Source
  • Figure 67: East Asia Market Value Share and BPS Analysis by Technology, 2025 and 2035
  • Figure 68: East Asia Market Y-o-Y Growth Comparison by Technology, 2025-2035
  • Figure 69: East Asia Market Attractiveness Analysis by Technology
  • Figure 70: East Asia Market Value Share and BPS Analysis by Application, 2025 and 2035
  • Figure 71: East Asia Market Y-o-Y Growth Comparison by Application, 2025-2035
  • Figure 72: East Asia Market Attractiveness Analysis by Application
  • Figure 73: South Asia & Pacific Market Value Share and BPS Analysis by Country, 2025 and 2035
  • Figure 74: South Asia & Pacific Market Value Share and BPS Analysis by Source, 2025 and 2035
  • Figure 75: South Asia & Pacific Market Y-o-Y Growth Comparison by Source, 2025-2035
  • Figure 76: South Asia & Pacific Market Attractiveness Analysis by Source
  • Figure 77: South Asia & Pacific Market Value Share and BPS Analysis by Technology, 2025 and 2035
  • Figure 78: South Asia & Pacific Market Y-o-Y Growth Comparison by Technology, 2025-2035
  • Figure 79: South Asia & Pacific Market Attractiveness Analysis by Technology
  • Figure 80: South Asia & Pacific Market Value Share and BPS Analysis by Application, 2025 and 2035
  • Figure 81: South Asia & Pacific Market Y-o-Y Growth Comparison by Application, 2025-2035
  • Figure 82: South Asia & Pacific Market Attractiveness Analysis by Application
  • Figure 83: Middle East and Africa Market Value Share and BPS Analysis by Country, 2025 and 2035
  • Figure 84: Middle East and Africa Market Value Share and BPS Analysis by Source, 2025 and 2035
  • Figure 85: Middle East and Africa Market Y-o-Y Growth Comparison by Source, 2025-2035
  • Figure 86: Middle East and Africa Market Attractiveness Analysis by Source
  • Figure 87: Middle East and Africa Market Value Share and BPS Analysis by Technology, 2025 and 2035
  • Figure 88: Middle East and Africa Market Y-o-Y Growth Comparison by Technology, 2025-2035
  • Figure 89: Middle East and Africa Market Attractiveness Analysis by Technology
  • Figure 90: Middle East and Africa Market Value Share and BPS Analysis by Application, 2025 and 2035
  • Figure 91: Middle East and Africa Market Y-o-Y Growth Comparison by Application, 2025-2035
  • Figure 92: Middle East and Africa Market Attractiveness Analysis by Application
  • Figure 93: Global Market - Tier Structure Analysis
  • Figure 94: Global Market - Company Share Analysis

Frequently Asked Questions

What is the market size of food allergen testing in 2025?

The market is valued at USD 970.3 million in 2025.

What is the projected value of food allergen testing by 2035?

It is projected to reach USD 2,062.6 million by 2035.

Which technology leads the food allergen testing market?

Polymerase chain reaction (PCR) leads with a 35.4% market share.

What is the forecast CAGR for the food allergen testing market?

The market is expected to grow at a CAGR of 7.8% from 2025 to 2035.

Which country is poised to grow the fastest in food allergen testing market?

Japan is projected to hold a CAGR of 6.5% from 2025 to 2035.

Explore Similar Insights

Future Market Insights

Food Allergen Testing Market