The global food tray market is valued at USD 12,340 million in 2025 and is set to reach USD 21,891.5 million by 2035, growing at a CAGR of 5.9%. The market stands at the forefront of a transformative decade that promises to redefine food service packaging infrastructure and meal delivery excellence across foodservice, retail, institutional, and catering sectors. The market's journey from USD 12,340 million in 2025 to USD 21,891.5 million by 2035 represents substantial growth, demonstrating the accelerating adoption of convenient meal packaging solutions and sophisticated multi-compartment systems across restaurant operations, supermarket prepared foods, airline catering, and healthcare meal service applications.
The first half of the decade (2025-2030) will witness the market climbing from USD 12,340 million to approximately USD 15,870 million, adding USD 3,530 million in value, which constitutes 37% of the total forecast growth period. This phase will be characterized by the rapid adoption of portion-controlled tray systems, driven by increasing demand for meal delivery formats and enhanced food presentation standards worldwide. Superior temperature retention capabilities and stackable storage features will become standard expectations rather than premium options.
The latter half (2030-2035) will witness sustained growth from USD 15,870 million to USD 21,891.5 million, representing an addition of USD 5,915 million or 63% of the decade's expansion. This period will be defined by mass market penetration of specialized compartmentalized tray systems, integration with comprehensive meal assembly platforms, and seamless compatibility with existing foodservice and retail distribution infrastructure. The market trajectory signals fundamental shifts in how restaurant chains and meal providers approach food packaging solutions, with participants positioned to benefit from sustained demand across multiple application segments.
One of the key drivers of this market is the global rise in on-the-go and convenience food consumption. The increase in fast food, takeaway, and delivery services has fueled demand for food trays, which are used for both packaging and serving meals. Busy urban lifestyles, the rise of dual-income households, and changing eating habits are pushing consumers toward more convenient food options. The foodservice sector, particularly fast food chains, quick-service restaurants (QSRs), and food delivery services, is rapidly expanding across the globe, driving the need for durable, portable, and cost-effective packaging solutions like food trays. This trend is particularly evident in developed regions such as North America and Europe, as well as in fast-growing emerging markets like Asia-Pacific, where the demand for fast and affordable meal options is increasing rapidly.
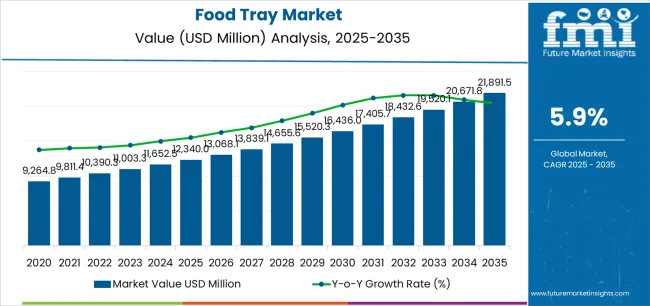
The food tray market demonstrates distinct growth phases with varying market characteristics and competitive dynamics. Between 2025 and 2030, the market progresses through its meal packaging adoption phase, expanding from USD 12,340 million to USD 15,870 million with steady annual increments averaging 5.2% growth. This period showcases the transition from standard disposable containers to advanced systems with enhanced insulation properties and integrated compartmentalization becoming mainstream features.
The 2025-2030 phase adds USD 3,530 million to market value, representing 37% of total decade expansion. Market maturation factors include standardization of tray specifications, declining component costs for thermoformed materials, and increasing foodservice operator awareness of tray packaging benefits reaching 70-75% effectiveness in meal delivery applications. Competitive landscape evolution during this period features established manufacturers like Pactiv Evergreen Inc. and Dart Container Corporation expanding their tray portfolios while new entrants focus on specialized barrier solutions and enhanced ventilation technology.
From 2030 to 2035, market dynamics shift toward advanced customization and multi-segment deployment, with growth accelerating from USD 15,870 million to USD 21,891.5 million, adding USD 5,915 million or 63% of total expansion. This phase transition logic centers on universal food tray systems, integration with automated meal assembly equipment, and deployment across diverse application scenarios, becoming standard rather than specialized packaging formats. The competitive environment matures with focus shifting from basic structural integrity to comprehensive supply chain integration and compatibility with high-volume catering systems.
| Metric | Value |
|---|---|
| Market Value (2025) | USD 12,340 million |
| Market Forecast (2035) | USD 21,891.5 million |
| Growth Rate | 5.90% CAGR |
| Leading Technology | Plastic |
| Primary Application | Ready-to-Eat Meal Segment |
The market demonstrates strong fundamentals with plastic systems capturing a dominant share through superior durability and cost-effective manufacturing capabilities. Ready-to-eat meal applications drive primary demand, supported by increasing meal delivery services and consumer preference for convenient dining solutions. Geographic expansion remains concentrated in developed markets with established foodservice infrastructure, while emerging economies show accelerating adoption rates driven by quick-service restaurant expansion and rising disposable incomes.
The food tray market represents a compelling intersection of meal packaging innovation, convenience enhancement, and food presentation management. With robust growth projected from USD 12,340 million in 2025 to USD 21,891.5 million by 2035 at a 5.90% CAGR, this market is driven by increasing meal delivery trends, foodservice operational efficiency requirements, and consumer demand for portion-controlled meal formats.
The market's expansion reflects a fundamental shift in how restaurant operators and meal providers approach food packaging infrastructure. Strong growth opportunities exist across diverse applications, from quick-service restaurants requiring efficient takeout systems to institutional facilities demanding portion control solutions. Geographic expansion is particularly pronounced in Asia-Pacific markets, led by China (7.2% CAGR) and India (6.8% CAGR), while established markets in North America and Europe drive innovation and specialized segment development.
The dominance of plastic systems and ready-to-eat meal applications underscores the importance of proven durability technology and temperature retention in driving adoption. Material cost fluctuations and disposal infrastructure remain key challenges, creating opportunities for companies that can deliver reliable performance while maintaining operational efficiency.
Market expansion rests on three fundamental shifts driving adoption across foodservice and retail sectors. 1. Meal delivery growth creates compelling advantages through tray packaging systems that provide secure meal transport with minimal spillage, enabling consumers to access restaurant-quality food while maintaining temperature control and justifying premium pricing over standard containers. 2. Operational efficiency accelerates as foodservice operators worldwide seek standardized packaging systems that deliver consistent portion control directly to customers, enabling cost management that aligns with labor optimization and inventory protocols. 3. Convenience dining drives adoption from restaurant chains and meal kit providers requiring reliable packaging solutions that maximize customer satisfaction while maintaining food quality during delivery and storage operations.
However, growth faces headwinds from material cost volatility challenges that vary across product segments regarding petroleum-based polymer pricing and alternative material specifications, potentially limiting deployment flexibility in cost-sensitive foodservice categories. Waste management complexity also persists regarding post-consumer disposal and material recovery that may increase operational considerations in markets with advancing environmental regulations.
Primary Classification: The market segments by material type into plastic, paperboard, aluminum, and molded fiber categories, representing the evolution from basic disposable containers to advanced engineered substrates for comprehensive meal packaging operations.
Secondary Breakdown: Application segmentation divides the market into ready-to-eat meals, bakery & confectionery, fresh produce, meat & poultry, and others sectors, reflecting distinct requirements for temperature control, moisture management, and food presentation standards.
Regional Classification: Geographic distribution covers North America, Europe, Asia Pacific, Latin America, and the Middle East & Africa, with developed markets leading innovation while emerging economies show accelerating growth patterns driven by quick-service restaurant expansion programs.
The segmentation structure reveals technology progression from standard thermoformed trays toward integrated multi-compartment platforms with enhanced insulation and ventilation capabilities, while application diversity spans from restaurant operations to retail facilities requiring efficient food merchandising and temperature retention solutions.
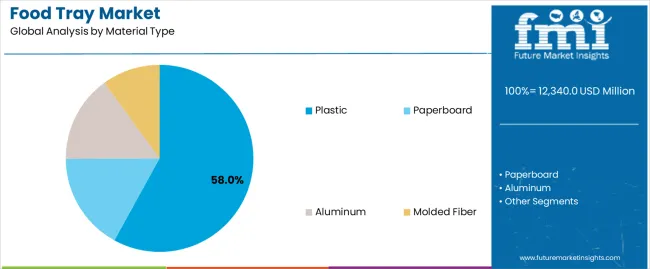
Plastic segment is estimated to account for 58% of the food tray market share in 2025. The segment's leading position stems from its fundamental role as a critical component in meal packaging applications and its extensive use across multiple foodservice and retail sectors. Plastic's dominance is attributed to its superior durability, including impact resistance, moisture barrier properties, and thermoforming versatility that make it indispensable for multi-compartment packaging operations.
Market Position: Plastic systems command the leading position in the food tray market through advanced thermoforming technologies, including comprehensive size options, stackability features, and reliable structural performance that enable operators to deploy efficient meal packaging solutions across diverse application environments.
Value Drivers: The segment benefits from operator preference for proven cost-effective materials that provide exceptional functionality without requiring premium investments. Efficient manufacturing processes enable deployment in quick-service restaurants, catering operations, and retail prepared foods where durability and processing efficiency represent critical production requirements.
Competitive Advantages: Plastic systems differentiate through excellent temperature tolerance, proven structural integrity, and compatibility with automated meal assembly equipment that enhance food safety while maintaining economical operational profiles suitable for diverse foodservice applications.
Key market characteristics:
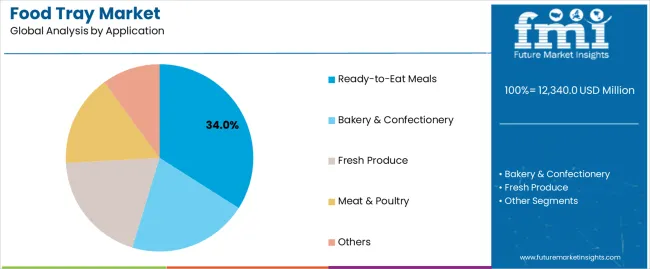
Ready-to-eat meal segment is projected to hold 34% of the food tray market share in 2025. The segment's market leadership is driven by the extensive use of trays in complete meal packaging, combination plates, hot food service, and prepared dinner assemblies, where packaging serves as both a containment vessel and presentation platform. The foodservice industry's consistent investment in meal delivery infrastructure supports the segment's dominant position.
Market Context: Ready-to-eat meal applications dominate the market due to widespread adoption of convenient meal formats and increasing focus on delivery service optimization, portion consistency, and food safety applications that enhance customer satisfaction while maintaining operational efficiency.
Appeal Factors: Restaurant operators prioritize temperature retention, compartment separation, and integration with delivery protocols that enable coordinated meal assembly across multiple preparation stations. The segment benefits from substantial consumer preference and convenience trends that emphasize reliable packaging for takeout and delivery applications.
Growth Drivers: Quick-service restaurant expansion programs incorporate trays as standard format for combination meals and value offerings. At the same time, meal delivery industry initiatives are increasing demand for packaging systems that comply with food safety standards and enhance customer experience.
Market Challenges: Material specification requirements and temperature performance standards may limit deployment flexibility in premium dining or specialized cuisine scenarios.
Application dynamics include:
Growth Accelerators: Meal delivery expansion drives primary adoption as tray packaging systems provide exceptional food containment capabilities that enable temperature control without excessive material usage, supporting meal quality and consumer satisfaction that require efficient logistics formats. Foodservice growth accelerates market expansion as restaurant chains seek standardized packaging solutions that maintain food presentation during transportation while enhancing operational efficiency through simplified meal assembly processes. Consumer spending increases worldwide, creating sustained demand for convenient meal packaging systems that complement takeout dining and provide competitive advantages in delivery service environments.
Growth Inhibitors: Raw material cost fluctuations vary across production segments regarding polymer pricing and alternative material requirements, which may limit market penetration and profit margins in price-sensitive categories with moderate capital availability. Performance specification complexity persists regarding temperature tolerance and structural integrity that may increase lead times in custom applications with demanding food safety standards. Market fragmentation across multiple tray designs and compartment configurations creates compatibility concerns between different meal assembly equipment and existing foodservice infrastructure.
Market Evolution Patterns: Adoption accelerates in quick-service and fast-casual sectors where operational efficiency justifies packaging investments, with geographic concentration in developed markets transitioning toward mainstream adoption in emerging economies driven by restaurant chain expansion and middle-class growth. Technology development focuses on enhanced insulation capabilities, improved ventilation features, and integration with automated meal packaging systems that optimize food quality and customer convenience. The market could face disruption if alternative meal packaging formats or material innovations significantly challenge tray advantages in foodservice applications.
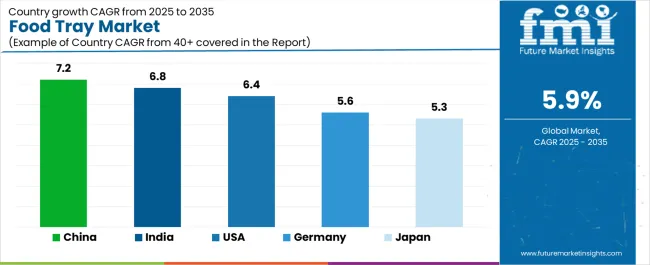
The food tray market demonstrates varied regional dynamics with Growth Leaders including China (7.2% CAGR) and India (6.8% CAGR) driving expansion through quick-service restaurant growth and urbanization trends. Steady Performers encompass the USA (6.4% CAGR), Germany (5.6% CAGR), and Japan (5.3% CAGR), benefiting from established foodservice sectors and meal delivery adoption.
| Country | CAGR (2025 to 2035) |
|---|---|
| China | 7.2% |
| India | 6.8% |
| USA | 6.4% |
| Germany | 5.6% |
| Japan | 5.3% |
Regional synthesis reveals Asia-Pacific markets leading growth through restaurant chain expansion and consumer lifestyle changes, while European countries maintain steady expansion supported by catering innovation and prepared food retail requirements. North American markets show strong growth driven by meal delivery services and institutional foodservice applications.
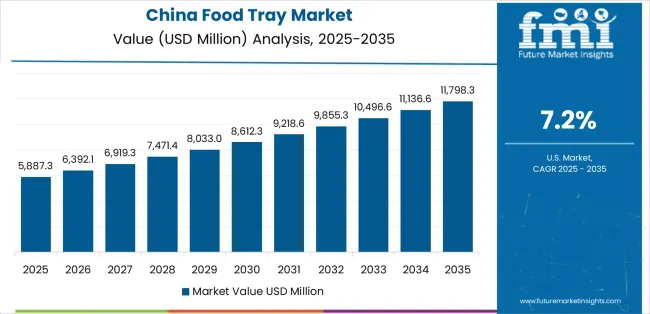
China establishes regional leadership through explosive fast-food chain expansion and comprehensive meal delivery platform development, integrating advanced tray packaging systems as standard components in combination meal and takeout applications. The country's 7.2% CAGR through 2035 reflects urbanization trends promoting convenient dining and domestic restaurant development that mandate the use of efficient packaging systems in quick-service operations. Growth concentrates in major metropolitan areas, including Beijing, Shanghai, and Guangzhou, where international and domestic restaurant chains showcase integrated tray systems that appeal to young consumers seeking convenient meal formats and standardized food presentation.
Chinese manufacturers are developing innovative tray packaging solutions that combine local production advantages with international quality specifications, including high-volume thermoforming systems and cost-optimized material formulations.
Strategic Market Indicators:
The Indian market emphasizes quick-service restaurant applications, including rapid dining format development and comprehensive food delivery infrastructure growth that increasingly incorporates trays for combination meals and institutional catering applications. The country is projected to show a 6.8% CAGR through 2035, driven by massive urban population growth under economic development programs and commercial demand for affordable, reliable packaging systems. Indian foodservice operators prioritize cost-effectiveness with trays delivering efficient meal assembly through economical material usage and standardized production capabilities.
Technology deployment channels include major restaurant chains, catering companies, and institutional food providers that support high-volume operations for domestic consumption applications.
Performance Metrics:
The USA market emphasizes advanced tray packaging features, including innovative compartment designs and integration with comprehensive meal delivery platforms that manage food quality, temperature control, and customer satisfaction applications through unified packaging systems. The country is projected to show a 6.4% CAGR through 2035, driven by meal kit expansion under convenience dining programs and commercial demand for versatile, reliable packaging systems. American foodservice operators prioritize customer experience with trays delivering enhanced presentation through sophisticated compartmentalization and leak-resistant construction.
Technology deployment channels include major restaurant chains, catering organizations, and meal delivery services that support custom development for specialized menu operations.
Performance Metrics:
In Munich, Hamburg, and Berlin, German restaurant operators and catering companies are implementing advanced tray packaging systems to enhance meal presentation capabilities and support food safety protocols that align with quality standards and regulatory requirements. The German market demonstrates sustained growth with a 5.6% CAGR through 2035, driven by prepared food innovation programs and institutional catering investments that emphasize reliable packaging systems for retail and corporate applications. German foodservice facilities are prioritizing tray systems that provide exceptional temperature control while maintaining compliance with food contact regulations and minimizing operational complexity, particularly important in healthcare and corporate catering operations.
Market expansion benefits from food safety programs that mandate appropriate packaging in foodservice specifications, creating sustained demand across Germany's restaurant and catering sectors, where meal quality and hygiene represent critical requirements.
Strategic Market Indicators:
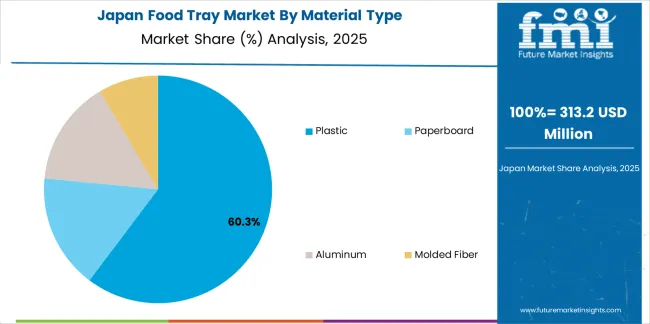
Japan's sophisticated foodservice market demonstrates meticulous tray deployment, growing at 5.3% CAGR, with documented operational excellence in meal packaging and portion control applications through integration with existing restaurant systems and quality assurance infrastructure. The country leverages engineering expertise in precision thermoforming and material science to maintain market leadership. Foodservice centers, including Tokyo, Osaka, and Fukuoka, showcase advanced installations where tray systems integrate with comprehensive meal assembly platforms and inventory management systems to optimize food presentation and operational efficiency.
Japanese foodservice operators prioritize packaging precision and temperature performance in product development, creating demand for flawless tray systems with advanced features, including secure closure mechanisms and integration with automated meal dispensing protocols. The market benefits from established convenience store infrastructure and willingness to invest in specialized packaging technologies that provide superior meal protection and consumer appeal.
Market Intelligence Brief:
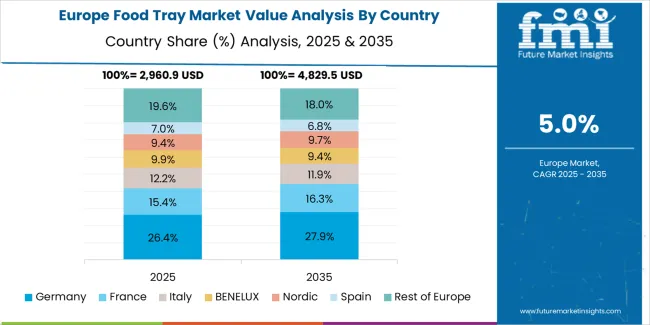
The food tray market in Europe is projected to grow from USD 3,680 million in 2025 to USD 6,140 million by 2035, registering a CAGR of 5.3% over the forecast period. Germany is expected to maintain its leadership position with a 35.8% market share in 2025, declining slightly to 35.4% by 2035, supported by its foodservice infrastructure excellence and major catering centers, including North Rhine-Westphalia and Bavaria.
France follows with a 24.6% share in 2025, projected to reach 25.1% by 2035, driven by comprehensive prepared food retail and institutional catering initiatives. The United Kingdom holds a 18.3% share in 2025, expected to maintain 18.6% by 2035 through established quick-service restaurant sectors and meal delivery adoption. Italy commands a 10.7% share, while Spain accounts for 8.1% in 2025. The Rest of Europe region is anticipated to gain momentum, expanding its collective share from 2.5% to 2.9% by 2035, attributed to increasing foodservice modernization in Eastern European countries and emerging Nordic restaurant chains implementing standardized meal packaging programs.
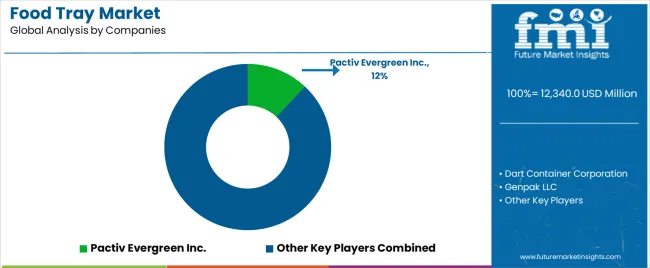
The food tray market features 10–15 players with moderate concentration, where the top three companies collectively hold around 45–52% of global market share. Growth is driven by rising demand for ready-to-eat meals, takeout services, food delivery, and sustainable packaging solutions. The leading company, Pactiv Evergreen Inc., commands 12% market share, supported by its extensive range of food trays made from various materials such as paperboard, plastic, and fiber. Competition centers on material performance, eco-friendliness, customization options, and cost efficiency rather than price alone.
Market leaders such as Pactiv Evergreen Inc., Dart Container Corporation, and Genpak LLC maintain dominant positions by offering high-quality, durable food trays suitable for different types of food packaging, from fresh produce to fast food and deli items. Their strengths include large-scale manufacturing capabilities, high-volume production, and strong relationships with large food retailers and QSRs.
Challenger companies including Anchor Packaging, WinCup Holdings, and Sabert Corporation compete by offering specialized trays for niche applications, such as microwave-safe trays, compostable solutions, and trays for premium meals, emphasizing product versatility and sustainability.
Additional competition comes from D&W Fine Pack, Placon Corporation, Inline Plastics Corp., and Huhtamaki Oyj, which enhance their market presence with environmentally friendly packaging solutions, regional manufacturing advantages, and custom tray designs for diverse foodservice needs.
| Item | Value |
|---|---|
| Quantitative Units | USD 12,340 million |
| Material Type | Plastic, Paperboard, Aluminum, Molded Fiber |
| Application | Ready-to-Eat Meals, Bakery & Confectionery, Fresh Produce, Meat & Poultry, Others |
| Regions Covered | North America, Europe, Asia Pacific, Latin America, Middle East & Africa |
| Countries Covered | USA, Germany, Japan, China, India, and 25+ additional countries |
| Key Companies Profiled | Pactiv Evergreen Inc., Dart Container Corporation, Genpak LLC, Anchor Packaging, WinCup Holdings, Sabert Corporation, D&W Fine Pack, Placon Corporation, Inline Plastics Corp., and Huhtamaki Oyj |
| Additional Attributes | Dollar sales by material type and application categories, regional adoption trends across North America, Europe, and Asia-Pacific, competitive landscape with foodservice packaging manufacturers and thermoforming specialists, operator preferences for durability and temperature control, integration with meal assembly equipment and delivery systems, innovations in compartment design and material formulations, and development of specialized performance solutions with enhanced insulation and presentation capabilities |
The global food tray market is estimated to be valued at USD 12,340.0 million in 2025.
The market size for the food tray market is projected to reach USD 21,891.5 million by 2035.
The food tray market is expected to grow at a 5.9% CAGR between 2025 and 2035.
The key product types in food tray market are plastic, paperboard, aluminum and molded fiber.
In terms of application, ready-to-eat meals segment to command 34.0% share in the food tray market in 2025.


Our Research Products

The "Full Research Suite" delivers actionable market intel, deep dives on markets or technologies, so clients act faster, cut risk, and unlock growth.

The Leaderboard benchmarks and ranks top vendors, classifying them as Established Leaders, Leading Challengers, or Disruptors & Challengers.

Locates where complements amplify value and substitutes erode it, forecasting net impact by horizon

We deliver granular, decision-grade intel: market sizing, 5-year forecasts, pricing, adoption, usage, revenue, and operational KPIs—plus competitor tracking, regulation, and value chains—across 60 countries broadly.

Spot the shifts before they hit your P&L. We track inflection points, adoption curves, pricing moves, and ecosystem plays to show where demand is heading, why it is changing, and what to do next across high-growth markets and disruptive tech

Real-time reads of user behavior. We track shifting priorities, perceptions of today’s and next-gen services, and provider experience, then pace how fast tech moves from trial to adoption, blending buyer, consumer, and channel inputs with social signals (#WhySwitch, #UX).

Partner with our analyst team to build a custom report designed around your business priorities. From analysing market trends to assessing competitors or crafting bespoke datasets, we tailor insights to your needs.
Supplier Intelligence
Discovery & Profiling
Capacity & Footprint
Performance & Risk
Compliance & Governance
Commercial Readiness
Who Supplies Whom
Scorecards & Shortlists
Playbooks & Docs
Category Intelligence
Definition & Scope
Demand & Use Cases
Cost Drivers
Market Structure
Supply Chain Map
Trade & Policy
Operating Norms
Deliverables
Buyer Intelligence
Account Basics
Spend & Scope
Procurement Model
Vendor Requirements
Terms & Policies
Entry Strategy
Pain Points & Triggers
Outputs
Pricing Analysis
Benchmarks
Trends
Should-Cost
Indexation
Landed Cost
Commercial Terms
Deliverables
Brand Analysis
Positioning & Value Prop
Share & Presence
Customer Evidence
Go-to-Market
Digital & Reputation
Compliance & Trust
KPIs & Gaps
Outputs
Full Research Suite comprises of:
Market outlook & trends analysis
Interviews & case studies
Strategic recommendations
Vendor profiles & capabilities analysis
5-year forecasts
8 regions and 60+ country-level data splits
Market segment data splits
12 months of continuous data updates
DELIVERED AS:
PDF EXCEL ONLINE
Key Companies & Market Share in the Food Trays Sector
PET Food Trays Market Size and Share Forecast Outlook 2025 to 2035
Food Partition Trays Market
Compostable Food Trays Market Size and Share Forecast Outlook 2025 to 2035
Market Positioning & Share in the Compostable Food Trays Industry
Food & Beverage OEE Software Market Size and Share Forecast Outlook 2025 to 2035
Food Grade Crosslinked Polyvinylpolypyrrolidone (PVPP) Market Size and Share Forecast Outlook 2025 to 2035
Food Grade Cassia Gum Powder Market Size and Share Forecast Outlook 2025 to 2035
Food Grade Dry Film Lubricant Market Size and Share Forecast Outlook 2025 to 2035
Tray Market Forecast and Outlook 2025 to 2035
Foodservice Equipment Market Analysis - Size, Share, and Forecast Outlook 2025 to 2035
Food Basket Market Forecast and Outlook 2025 to 2035
Food Grade Tremella Polysaccharide Market Size and Share Forecast Outlook 2025 to 2035
Tray Sealing Machines Market Size and Share Forecast Outlook 2025 to 2035
Food Sorting Machine Market Size and Share Forecast Outlook 2025 to 2035
Foodservice Paper Bag Market Size and Share Forecast Outlook 2025 to 2035
Food Stabilizers Market Size and Share Forecast Outlook 2025 to 2035
Food Packaging Film Market Size and Share Forecast Outlook 2025 to 2035
Food Certification Market Size and Share Forecast Outlook 2025 to 2035
Food & Beverage Industrial Disinfection and Cleaning Market Size and Share Forecast Outlook 2025 to 2035

Thank you!
You will receive an email from our Business Development Manager. Please be sure to check your SPAM/JUNK folder too.
Chat With
MaRIA