Increase in pork consumption across various regions to help lift the global swine respiratory diseases treatment market in the coming decade
Pigs are mostly affected with respiratory diseases such as PRRS (Porcine Reproductive and Respiratory Syndrome), which is a one of the common diseases. The Porcine Respiratory and Reproductive Syndrome is caused by a virus and is categorised under arterivirus. PRRS disease is also known as blue-ear pig disease. The PRRS was identified in USA during the 1980’s and is also known as the mystery swine disease. The PRRS disease is rapidly spreading in all the countries that are into pig productions, very few countries are left which are PRRS free today. The consumption of pork is increasing over the years across all the regions, which directly boosts the pork industry to produce more pork that is disease free, to enable the pork industry to meet the increasing demand for pork in the global market.
Market snapshot of the top regions in the global swine respiratory diseases treatment market
APEJ: APEJ is expected to lead the global swine respiratory diseases treatment market with its market size reaching a value of over US$ 1,100 Mn in 2027, growing at a CAGR 6.7%. However it is in close competition with Eastern Europe, which is leading in terms of CAGR, with a robust market growth at 6.9% CAGR during the forecast period. The animal industry is one of the fastest growing sectors in most countries of the Asia Pacific region. It is a vital industry linked to millions of jobs in related industries. However, the health and growth of this industry are being threatened by the emergence of animal diseases. APEJ’s market includes China’s pig industry, where the Chinese government is willing to invest and increase the pig industry by implementing supporting policies to support large pig farmers. Chinese scholars have indicated that they have found a new strain of PRRS virus (PRRSV) GDsg that was isolated in the Guangdong province of China, which caused high fever, high morbidity and high mortality for sow and piglets. This is helping APEJ’s swine respiratory diseases treatment market to grow exceptionally.
North America: The demand of pork in countries such as US and Canada is increasing, as a result the production of pork is increasing to meet the needs of the market. The pathogen free pork is directly contributing to the demand of the meat industry. In the pork industry in North America, especially in the U.S, most of the pork farms are using vaccines as the pork industry is looking forward to produce pork which is disease free. Vaccines are mostly used as preventive process to overcome the harmful pathogens. The use of vaccines for PRRS (porcine reproductive and respiratory syndrome) and mycoplasma is increasing, the vaccine is directly given to breeding females, to enable the new born pig to be pathogen free. The increase in use of vaccines has helped North America’s market to reach a size of over US$ 780 Mn in 2027, growing at a CAGR of 6.5% during the forecast period. Also, the market is quite positive for investors in the animal healthcare sector and it seems like a win-win situation for both the parties (investors and manufacturers) in the long term.
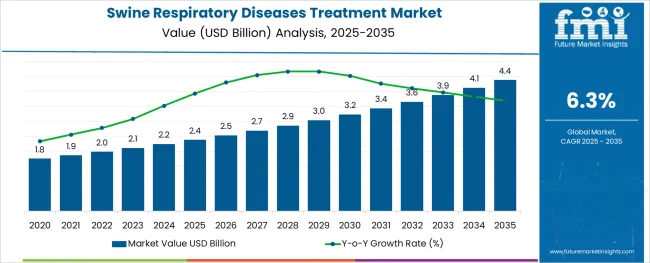
A new research report by Future Market Insights titled ‘Swine Respiratory Diseases Treatment Market: Global Industry Analysis 2012 – 2016 and Opportunity Assessment 2017 – 2027’ gives clear insights on the global swine respiratory diseases treatment market. This comprehensive research report includes the global market share, pricing analysis, Y-o-Y growth rate and also a comparative analysis. It depicts how various companies in the industry are focussing on new product launches and reducing the costs of swine respiratory diseases treatment products in order to gain maximum market share.
Our extensive team of analysts at Future Market Insights have worked vigorously to carry out a research process that highlights various aspects of the market and also the factors that impact the global swine respiratory diseases treatment market such as the drivers boosting market revenue growth, the restraints that are limiting the growth of the market and also the trends that are governing the overall market. In order to assist the reader with a holistic view of the market, the analysts have presented a detailed regional analysis of the global market. This covers all the major regions and their market scenario for swine respiratory diseases treatment.
Segmentation of the Global Swine Respiratory Diseases Treatment Market
The segmentation of the global swine respiratory diseases treatment market helps readers simplify the market study and understanding, by dividing the market into different segments on the basis of various parameters. The report provides an individual analysis of each and every segment, thus covering every part of the market.
By Region |
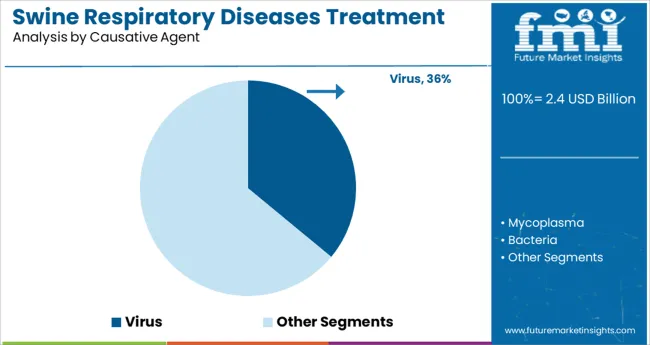
By Causative Agent |
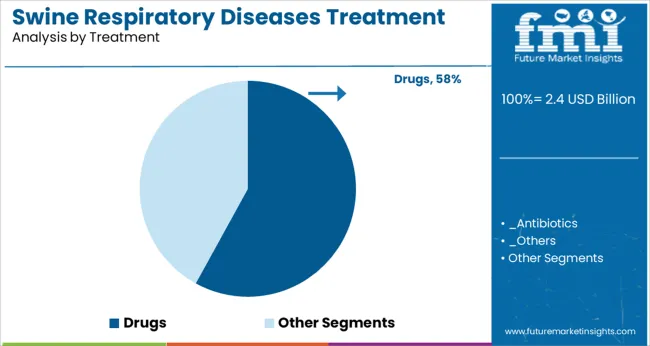
By Treatment Type |
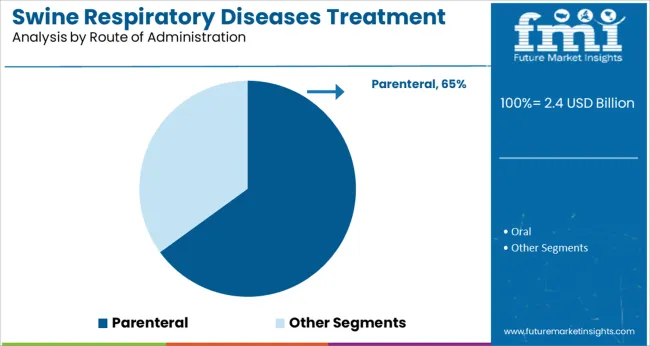
By Route of Administration |
By Distribution Channel |
---|---|---|---|---|
|
|
|
|
|
Report Structure and Research Methodology
Our team of analysts follow a systematic approach when studying any market. This process has a number of levels, in which the data is collected from different sources and also validated at different stages. The report begins with the basic definition of the market and summary of the report outcomes, which includes global market share, CAGR, trends and drivers. This builds a strong base for the readers to understand the market. This is followed by market segmentation and separate analysis for each segment of the market. The report also covers competitive analysis of the global market briefing the competitive scenario and major developments of the key players in the market. This can help key stakeholders understand their competitors and prepare their counter strategies. In order to gather all the required data, a thorough primary and secondary research takes place. The secondary research helps in identifying the industry scenario, market trends, key manufacturers, suppliers, and also all the market related numbers. It is followed by preparing a list of key players and experts in the market. Once the experts are identified, they are interviewed to get further key insights into the market. All the data being gathered goes through a triangulation method of validation wherein primary and secondary research data along with Future Market Insights analysis contribute to the final data.
1. Executive Summary
1.1. Market Overview
1.2. Market Analysis
1.3. FMI Analysis and Recommendations
1.4. Wheel of Fortune
2. Market Introduction
2.1. Market Taxonomy
2.2. Market Definition
3. Swine Respiratory Treatment Market View Point
3.1. Macro-Economic Factors
3.2. Opportunity Analysis
3.3. Swine respiratory diseases cause agent and effects
3.4. Regulatory Scenario
4. North America Swine Respiratory Treatment Market Analysis 2012–2016 and Forecast 2017–2027
4.1. Introduction
4.2. Regional Market Dynamics
4.2.1.cDrivers
4.2.2. Restraints
4.2.3. Trends
4.3. Historical Market Size (US$ Mn) Analysis By Country, 2012-2016
4.3.1. U.S.
4.3.2. Canada
4.4. Market Size (US$ Mn) Forecast By Country, 2017-2027
4.4.1. U.S.
4.4.2. Canada
4.5. Historical Market Size (US$ Mn) Analysis By Causative Agent, 2012-2016
4.5.1. Virus
4.5.2. Mycoplasma
4.5.3. Bacteria
4.5.4. Others
4.6. Market Size (US$ Mn) Forecast By Causative Agent, 2017-2027
4.6.1. Virus
4.6.2. Mycoplasma
4.6.3. Bacteria
4.6.4. Others
4.7. Historical Market Size (US$ Mn) Analysis By Treatment Type, 2012-2016
4.7.1. Drugs
4.7.1.1. Antibiotics
4.7.1.2. Others
4.7.2. Vaccines
4.8. Market Size (US$ Mn) Forecast By Treatment Type, 2017-2027
4.8.1. Drugs
4.8.1.1. Antibiotics
4.8.1.2. Others
4.8.2. Vaccines
4.9. Historical Market Size (US$ Mn) Analysis By Route of Administration Type, 2012-2016
4.9.1. Oral
4.9.2. Parenteral
4.10.Market Size (US$ Mn) Forecast By Route of Administration, 2017-2027
4.10.1. Oral
4.10.2. Parenteral
4.11.Historical Market Size (US$ Mn) Analysis By Distribution Channel, 2012-2016
4.11.1. Veterinary Hospitals
4.11.2. Veterinary Clinics
4.11.3. Pharmacies
4.11.4. Others
4.12.Market Size (US$ Mn) Forecast By Distribution Channel, 2017-2027
4.12.1. Veterinary Hospitals
4.12.2. Veterinary Clinics
4.12.3. Pharmacies
4.12.4. Others
4.13.Drivers and Restraints: Impact Analysis
4.14.Market Attractiveness Analysis
4.14.1. By Country
4.14.2. By Causative Agent
4.14.3. By Treatment Type
4.14.4. By Route of Administration
4.14.5. By Distribution Channel
4.15.Key Representative Market Participants
4.16.Key Participants Market Presence (Intensity Map)
5. Latin America Swine Respiratory Treatment Market Analysis 2012–2016 and Forecast 2017–2027
5.1. Introduction
5.2. Regional Market Dynamics
5.2.1. Drivers
5.2.2. Restraints
5.2.3. Trends
5.3. Historical Market Size (US$ Mn) Analysis By Country, 2012-2016
5.3.1. Brazil
5.3.2. Mexico
5.3.3. Rest of Latin America
5.4. Market Size (US$ Mn) Forecast By Country, 2017-2027
5.4.1. Brazil
5.4.2. Mexico
5.4.3. Rest of Latin America
5.5. Historical Market Size (US$ Mn) Analysis By Causative Agent, 2012-2016
5.5.1. Virus
5.5.2. Mycoplasma
5.5.3. Bacteria
5.5.4. Others
5.6. Market Size (US$ Mn) Forecast By Causative Agent, 2017-2027
5.6.1. Virus
5.6.2. Mycoplasma
5.6.3. Bacteria
5.6.4. Others
5.7. Historical Market Size (US$ Mn) Analysis By Treatment Type, 2012-2016
5.7.1. Drugs
5.7.1.1. Antibiotics
5.7.1.2. Others
5.7.2. Vaccines
5.8. Market Size (US$ Mn) Forecast By Treatment Type, 2017-2027
5.8.1. Drugs
5.8.1.1. Antibiotics
5.8.1.2. Others
5.8.2. Vaccines
5.9. Historical Market Size (US$ Mn) Analysis By Route of Administration Type, 2012-2016
5.9.1. Oral
5.9.2. Parenteral
5.10.Market Size (US$ Mn) Forecast By Route of Administration, 2017-2027
5.10.1. Oral
5.10.2. Parenteral
5.11.Historical Market Size (US$ Mn) Analysis By Distribution Channel, 2012-2016
5.11.1. Veterinary Hospitals
5.11.2. Veterinary Clinics
5.11.3. Pharmacies
5.11.4. Others
5.12.Market Size (US$ Mn) Forecast By Distribution Channel, 2017-2027
5.12.1. Veterinary Hospitals
5.12.2. Veterinary Clinics
5.12.3. Pharmacies
5.12.4. Others
5.13.Drivers and Restraints: Impact Analysis
5.14.Market Attractiveness Analysis
5.14.1. By Country
5.14.2. By Causative Agent
5.14.3. By Treatment Type
5.14.4. By Route of Administration
5.14.5. By Distribution Channel
5.15.Key Representative Market Participants
Key Participants Market Presence (Intensity Map)
6. Western Europe Swine Respiratory Treatment Market Analysis 2012–2016 and Forecast 2017–2027
6.1. Introduction
6.2. Regional Market Dynamics
6.2.1. Drivers
6.2.2. Restraints
6.2.3. Trends
6.3. Historical Market Size (US$ Mn) Analysis By Country, 2012-2016
6.3.1. Germany
6.3.2. UK
6.3.3. France
6.3.4. Spain
6.3.5. Italy
6.3.6. Nordic Countries
6.3.7. Rest of Western Europe
6.4. Market Size (US$ Mn) Forecast By Country, 2017-2027
6.4.1. Germany
6.4.2. UK
6.4.3. France
6.4.4. Spain
6.4.5. Italy
6.4.6. Nordic Countries
6.4.7. Rest of Western Europe
6.5. Historical Market Size (US$ Mn) Analysis By Causative Agent, 2012-2016
6.5.1. Virus
6.5.2. Mycoplasma
6.5.3. Bacteria
6.5.4. Others
6.6. Market Size (US$ Mn) Forecast By Causative Agent, 2017-2027
6.6.1. Virus
6.6.2. Mycoplasma
6.6.3. Bacteria
6.6.4. Others
6.7. Historical Market Size (US$ Mn) Analysis By Treatment Type, 2012-2016
6.7.1. Drugs
6.7.1.1. Antibiotics
6.7.1.2. Others
6.7.2. Vaccines
6.8. Market Size (US$ Mn) Forecast By Treatment Type, 2017-2027
6.8.1. Drugs
6.8.1.1. Antibiotics
6.8.1.2. Others
6.8.2. Vaccines
6.9. Historical Market Size (US$ Mn) Analysis By Route of Administration Type, 2012-2016
6.9.1. Oral
6.9.2. Parenteral
6.10.Market Size (US$ Mn) Forecast By Route of Administration, 2017-2027
6.10.1. Oral
6.10.2. Parenteral
6.11.Historical Market Size (US$ Mn) Analysis By Distribution Channel, 2012-2016
6.11.1. Veterinary Hospitals
6.11.2. Veterinary Clinics
6.11.3. Pharmacies
6.11.4. Others
6.12.Market Size (US$ Mn) Forecast By Distribution Channel, 2017-2027
6.12.1. Veterinary Hospitals
6.12.2. Veterinary Clinics
6.12.3. Pharmacies
6.12.4. Others
6.13.Drivers and Restraints: Impact Analysis
6.14.Market Attractiveness Analysis
6.14.1. By Country
6.14.2. By Causative Agent
6.14.3. By Treatment Type
6.14.4. By Route of Administration
6.14.5. By Distribution Channel
6.15.Key Representative Market Participants
6.16.Key Participants Market Presence (Intensity Map)
7. Eastern Europe Swine Respiratory Treatment Market Analysis 2012–2016 and Forecast 2017–2027
7.1. Introduction
7.2. Regional Market Dynamics
7.2.1. Drivers
7.2.2. Restraints
7.2.3. Trends
7.3. Historical Market Size (US$ Mn) Analysis By Country, 2012-2016
7.3.1. Russia
7.3.2. Poland
7.3.3. Rest of Eastern Europe
7.4. Market Size (US$ Mn) Forecast By Country, 2017-2027
7.4.1. Russia
7.4.2. Poland
7.4.3. Rest of Eastern Europe
7.5. Historical Market Size (US$ Mn) Analysis By Causative Agent, 2012-2016
7.5.1. Virus
7.5.2. Mycoplasma
7.5.3. Bacteria
7.5.4. Others
7.6. Market Size (US$ Mn) Forecast By Causative Agent, 2017-2027
7.6.1. Virus
7.6.2. Mycoplasma
7.6.3. Bacteria
7.6.4. Others
7.7. Historical Market Size (US$ Mn) Analysis By Treatment Type, 2012-2016
7.7.1. Drugs
7.7.1.1. Antibiotics
7.7.1.2. Others
7.7.2. Vaccines
7.8. Market Size (US$ Mn) Forecast By Treatment Type, 2017-2027
7.8.1. Drugs
7.8.1.1. Antibiotics
7.8.1.2. Others
7.8.2. Vaccines
7.9. Historical Market Size (US$ Mn) Analysis By Route of Administration Type, 2012-2016
7.9.1. Oral
7.9.2. Parenteral
7.10.Market Size (US$ Mn) Forecast By Route of Administration, 2017-2027
7.10.1. Oral
7.10.2. Parenteral
7.11.Historical Market Size (US$ Mn) Analysis By Distribution Channel, 2012-2016
7.11.1. Veterinary Hospitals
7.11.2. Veterinary Clinics
7.11.3. Pharmacies
7.11.4. Others
7.12.Market Size (US$ Mn) Forecast By Distribution Channel, 2017-2027
7.12.1. Veterinary Hospitals
7.12.2. Veterinary Clinics
7.12.3. Pharmacies
7.12.4. Others
7.13.Drivers and Restraints: Impact Analysis
7.14.Market Attractiveness Analysis
7.14.1. By Country
7.14.2. By Causative Agent
7.14.3. By Treatment Type
7.14.4. By Route of Administration
7.14.5. By Distribution Channel
7.15.Key Representative Market Participants
7.16.Key Participants Market Presence (Intensity Map)
8. Asia Pacific Excluding Japan Swine Respiratory Treatment Market Analysis 2012–2016 and Forecast 2017–2027
8.1. Introduction
8.2. Regional Market Dynamics
8.2.1. Drivers
8.2.2. Restraints
8.2.3. Trends
8.3. Historical Market Size (US$ Mn) and Analysis By Country, 2012-2016
8.3.1. China
8.3.2. Philippine
8.3.3. South Korea
8.3.4. India
8.3.5. Australia
8.3.6. Rest of Asia Pacifc
8.4. Market Size (US$ Mn) and Forecast By Country, 2017-2027
8.4.1. China
8.4.2. Philippine
8.4.3. South Korea
8.4.4. India
8.4.5. Australia
8.4.6. Rest of Asia Pacifc
8.5. Historical Market Size (US$ Mn) Analysis By Causative Agent, 2012-2016
8.5.1. Virus
8.5.2. Mycoplasma
8.5.3. Bacteria
8.5.4. Others
8.6. Market Size (US$ Mn) Forecast By Causative Agent, 2017-2027
8.6.1. Virus
8.6.2. Mycoplasma
8.6.3. Bacteria
8.6.4. Others
8.7. Historical Market Size (US$ Mn) Analysis By Treatment Type, 2012-2016
8.7.1. Drugs
8.7.1.1. Antibiotics
8.7.1.2. Others
8.7.2. Vaccines
8.8. Market Size (US$ Mn) Forecast By Treatment Type, 2017-2027
8.8.1. Drugs
8.8.1.1. Antibiotics
8.8.1.2. Others
8.8.2. Vaccines
8.9. Historical Market Size (US$ Mn) Analysis By Route of Administration Type, 2012-2016
8.9.1. Oral
8.9.2. Parenteral
8.10.Market Size (US$ Mn) Forecast By Route of Administration, 2017-2027
8.10.1. Oral
8.10.2. Parenteral
8.11.Historical Market Size (US$ Mn) Analysis By Distribution Channel, 2012-2016
8.11.1. Veterinary Hospitals
8.11.2. Veterinary Clinics
8.11.3. Pharmacies
8.11.4. Others
8.12.Market Size (US$ Mn) Forecast By Distribution Channel, 2017-2027
8.12.1. Veterinary Hospitals
8.12.2. Veterinary Clinics
8.12.3. Pharmacies
8.12.4. Others
8.13.Drivers and Restraints: Impact Analysis
8.14.Market Attractiveness Analysis
8.14.1. By Country
8.14.2. By Causative Agent
8.14.3. By Treatment Type
8.14.4. By Route of Administration
8.14.5. By Distribution Channel
8.15.Key Representative Market Participants
8.16.Key Participants Market Presence (Intensity Map)
9. Japan Swine Respiratory Treatment Market Analysis 2012–2016 and Forecast 2017–2027
9.1. Introduction
9.2. Japan Market Dynamics
9.2.1. Drivers
9.2.2. Restraints
9.2.3. Trends
9.3. Historical Market Size (US$ Mn) Analysis By Causative Agent, 2012-2016
9.3.1. Virus
9.3.2. Mycoplasma
9.3.3. Bacteria
9.3.4. Others
9.4. Market Size (US$ Mn) Forecast By Causative Agent, 2017-2027
9.4.1. Virus
9.4.2. Mycoplasma
9.4.3. Bacteria
9.4.4. Others
9.5. Historical Market Size (US$ Mn) Analysis By Treatment Type, 2012-2016
9.5.1. Drugs
9.5.1.1. Antibiotics
9.5.1.2. Others
9.5.2. Vaccines
9.6. Market Size (US$ Mn) Forecast By Treatment Type, 2017-2027
9.6.1. Drugs
9.6.1.1. Antibiotics
9.6.1.2. Others
9.6.2. Vaccines
9.7. Historical Market Size (US$ Mn) Analysis By Route of Administration Type, 2012-2016
9.7.1. Oral
9.7.2. Parenteral
9.8. Market Size (US$ Mn) Forecast By Route of Administration, 2017-2027
9.8.1. Oral
9.8.2. Parenteral
9.9. Historical Market Size (US$ Mn) Analysis By Distribution Channel, 2012-2016
9.9.1. Veterinary Hospitals
9.9.2. Veterinary Clinics
9.9.3. Pharmacies
9.9.4. Others
9.10.Market Size (US$ Mn) Forecast By Distribution Channel, 2017-2027
9.10.1. Veterinary Hospitals
9.10.2. Veterinary Clinics
9.10.3. Pharmacies
9.10.4. Others
9.11.Drivers and Restraints: Impact Analysis
9.12.Market Attractiveness Analysis
9.12.1. By Causative Agent
9.12.2. By Treatment Type
9.12.3. By Route of Administration
9.12.4. By Distribution Channel
9.13.Key Representative Market Participants
9.14.Key Participants Market Presence (Intensity Map)
10. Middle East and Africa Swine Respiratory Treatment Market Analysis 2012–2016 and Forecast 2017–2027
10.1.Introduction
10.2.Regional Market Dynamics
10.2.1. Drivers
10.2.2. Restraints
10.2.3. Trends
10.3.Historical Market Size (US$ Mn) Analysis By Country, 2012-2016
10.3.1. GCC Countries
10.3.2. South Africa
10.3.3. Rest of Middle East and Africa
10.4.Market Size (US$ Mn) Forecast By Country, 2017-2027
10.4.1. GCC Countries
10.4.2. South Africa
10.4.3. Rest of Middle East and Africa
10.5.Historical Market Size (US$ Mn) Analysis By Causative Agent, 2012-2016
10.5.1. Virus
10.5.2. Mycoplasma
10.5.3. Bacteria
10.5.4. Others
10.6.Market Size (US$ Mn) Forecast By Causative Agent, 2017-2027
10.6.1. Virus
10.6.2. Mycoplasma
10.6.3. Bacteria
10.6.4. Others
10.7.Historical Market Size (US$ Mn) Analysis By Treatment Type, 2012-2016
10.7.1. Drugs
10.7.1.1. Antibiotics
10.7.1.2. Others
10.7.2. Vaccines
10.8.Market Size (US$ Mn) Forecast By Treatment Type, 2017-2027
10.8.1. Drugs
10.8.1.1. Antibiotics
10.8.1.2. Others
10.8.2. Vaccines
10.9.Historical Market Size (US$ Mn) Analysis By Route of Administration Type, 2012-2016
10.9.1. Oral
10.9.2. Parenteral
10.10. Market Size (US$ Mn) Forecast By Route of Administration, 2017-2027
10.10.1. Oral
10.10.2. Parenteral
10.11. Historical Market Size (US$ Mn) Analysis By Distribution Channel, 2012-2016
10.11.1. Veterinary Hospitals
10.11.2. Veterinary Clinics
10.11.3. Pharmacies
10.11.4. Others
10.12. Market Size (US$ Mn) Forecast By Distribution Channel, 2017-2027
10.12.1. Veterinary Hospitals
10.12.2. Veterinary Clinics
10.12.3. Pharmacies
10.12.4. Others
10.13. Drivers and Restraints: Impact Analysis
10.14. Market Attractiveness Analysis
10.14.1. By Country
10.14.2. By Causative Agent
10.14.3. By Treatment Type
10.14.4. By Route of Administration
10.14.5. By Distribution Channel
10.15. Key Representative Market Participants
10.16. Key Participants Market Presence (Intensity Map)
11. Forecast Factors: Relevance and Impact
12. Forecast Assumptions
13. Competition Landscape
13.1.Competition Dashboard
13.2.Company Profiles (Details – Overview, Financials, Strategy, Recent Developments)
13.2.1. Zoetis
13.2.2. Bayer AG
13.2.3. Boehringer Ingelheim GmbH
13.2.4. Elanco Animal Health (Sub. Eli Lilly)
13.2.5. Virbac
13.2.6. Norbrook
13.2.7. Ceva Santé Animale
13.2.8. Intervet Inc., (Sub. Merck & Co. Inc.)
13.2.9. Vetoquinol SA
13.2.10. Bimeda, Inc.
13.2.11. Kyoritsu Seiyaku Corporation
13.2.12. HIPRA
14. Global Swine Respiratory Treatment Market Analysis 2012–2016 and Forecast 2017–2027 By Region
14.1.Introduction / Key Findings
14.2.Historical Market Size (US$ Mn) Analysis By Region
14.2.1. North America
14.2.2. Latin America
14.2.3. Western Europe
14.2.4. Eastern Europe
14.2.5. Asia Pacific Excluding Japan
14.2.6. Japan
14.2.7. Middle East and Africa
14.3.Market Size (US$ Mn) Forecast By Region
14.3.1. North America
14.3.2. Latin America
14.3.3. Western Europe
14.3.4. Eastern Europe
14.3.5. Asia Pacific Excluding Japan
14.3.6. Japan
14.3.7. Middle East and Africa
14.4.Market Attractiveness Analysis By Region
15. Global Swine Respiratory Treatment Market Analysis 2012–2016 and Forecast 2017–2027, By Causative Agent
15.1.Introduction/Key Finding
15.2.Historical Market Size (US$ Mn) Analysis By Causative Agent, 2012-2016
15.2.1. Virus
15.2.2. Mycoplasma
15.2.3. Bacteria
15.2.4. Others
15.3.Market Size (US$ Mn) Forecast By Causative Agent, 2017-2027
15.3.1. Virus
15.3.2. Mycoplasma
15.3.3. Bacteria
15.3.4. Others
15.4.Market Attractiveness Analysis By Causative Agent
16. Global Swine Respiratory Treatment Market Analysis 2012–2016 and Forecast 2017–2027, By Treatment Type
16.1.Introduction/Key Finding
16.2.Historical Market Size (US$ Mn) Analysis By Treatment Type, 2012-2016
16.2.1. Drugs
16.2.1.1. Antibiotics
16.2.1.2. Others
16.2.2. Vaccines
16.3.Market Size (US$ Mn) Forecast By Treatment Type, 2017-2027
16.3.1. Drugs
16.3.1.1. Antibiotics
16.3.1.2. Others
16.3.2. Vaccines
16.4.Market Attractiveness Analysis By Treatment Type
17. Global Swine Respiratory Treatment Market Analysis 2012–2016 and Forecast 2017–2027, By Route of Administration
17.1.Introduction/Key Finding
17.2.Historical Market Size (US$ Mn) Analysis By Route of Administration, 2012-2016
17.2.1. Oral
17.2.2. Parenteral
17.3.Market Size (US$ Mn) Forecast By Route of Administration, 2017-2027
17.3.1. Oral
17.3.2. Parenteral
17.4.Market Attractiveness Analysis By Route of Administration
18. Global Swine Respiratory Treatment Market Analysis 2012–2016 and Forecast 2017–2027, By Distribution Channel
18.1.Introduction/Key Finding
18.2.Historical Market Size (US$ Mn) Analysis By Distribution Channel, 2012-2016
18.2.1. Veterinary Hospitals
18.2.2. Veterinary Clinics
18.2.3. Pharmacies
18.2.4. Others
18.3.Market Size (US$ Mn) Forecast By Distribution Channel, 2017-2027
18.3.1. Veterinary Hospitals
18.3.2. Veterinary Clinics
18.3.3. Pharmacies
18.3.4. Others
18.4.Market Attractiveness Analysis By Distribution Channel
19. Global Swine Respiratory Treatment Market Analysis 2012–2016 and Forecast 2017–2027
19.1.Market Size and Y-o-Y Growth
19.2.Absolute $ Opportunity
19.3.Value Chain
20. Assumptions and Acronyms Used
21. Research Methodology
Table 01 : North America Swine Respiratory Diseases Treatment Market Size (US$ Mn) Analysis-2012–2016 and Forecast 2017–2027, By Country
Table 02 : North America Swine Respiratory Diseases Treatment Market Size (US$ Mn) Analysis-2012–2016 and Forecast 2017–2027, By Causative Agent Segment
Table 03 : North America Swine Respiratory Diseases Treatment Market Size (US$ Mn) Analysis-2012–2016 and Forecast 2017–2027, By Treatment Type Segment
Table 04 : North America Swine Respiratory Diseases Treatment Market Size (US$ Mn) Analysis-2012–2016 and Forecast 2017–2027, By Route of Administration Segment
Table 05: North America Swine Respiratory Diseases Treatment Market Size (US$ Mn) Analysis-2012–2016 and Forecast 2017–2027, By Distribution Channel Segment
Table 06 : Latin America Swine Respiratory Diseases Treatment Market Size (US$ Mn) Analysis-2012–2016 and Forecast 2017–2027, By Country
Table 07 : Latin America Swine Respiratory Diseases Treatment Market Size (US$ Mn) Analysis-2012–2016 and Forecast 2017–2027, By Causative Agent Segment
Table 08 : Latin America Swine Respiratory Diseases Treatment Market Size (US$ Mn) Analysis-2012–2016 and Forecast 2017–2027, By Treatment Type Segment
Table 09 : Latin America Swine Respiratory Diseases Treatment Market Size (US$ Mn) Analysis-2012–2016 and Forecast 2017–2027, By Route of Administration Segment
Table 10 : Latin America Swine Respiratory Diseases Treatment Market Size (US$ Mn) Analysis-2012–2016 and Forecast 2017–2027, By Distribution Channel Segment
Table 11 : Western Europe Swine Respiratory Diseases Treatment Market Size (US$ Mn) Analysis-2012–2016 and Forecast 2017–2027, By Country
Table 12 : Western Europe Swine Respiratory Diseases Treatment Market Size (US$ Mn) Analysis-2012–2016 and Forecast 2017–2027, By Causative Agent Segment
Table 13 : Western Europe Swine Respiratory Diseases Treatment Market Size (US$ Mn) Analysis-2012–2016 and Forecast 2017–2027, By Treatment Type Segment
Table 14 : Western Europe Swine Respiratory Diseases Treatment Market Size (US$ Mn) Analysis-2012–2016 and Forecast 2017–2027, By Route of Administration Segment
Table 15 : Western Europe Swine Respiratory Diseases Treatment Market Size (US$ Mn) Analysis-2012–2016 and Forecast 2017–2027, By Distribution Channel Segment
Table 16 : Eastern Europe Swine Respiratory Diseases Treatment Market Size (US$ Mn) Analysis-2012–2016 and Forecast 2017–2027, By Country
Table 17 : Eastern Europe Swine Respiratory Diseases Treatment Market Size (US$ Mn) Analysis-2012–2016 and Forecast 2017–2027, By Causative Agent Segment
Table 18 : Eastern Europe Swine Respiratory Diseases Treatment Market Size (US$ Mn) Analysis-2012–2016 and Forecast 2017–2027, By Treatment Type Segment
Table 19 : Eastern Europe Swine Respiratory Diseases Treatment Market Size (US$ Mn) Analysis-2012–2016 and Forecast 2017–2027, By Route of Administration Segment
Table 20 : Eastern Europe Swine Respiratory Diseases Treatment Market Size (US$ Mn) Analysis-2012–2016 and Forecast 2017–2027, By Distribution Channel Segment
Table 21 : APEJ Swine Respiratory Diseases Treatment Market Size (US$ Mn) Analysis-2012–2016 and Forecast 2017–2027, by Country
Table 22 : APEJ Swine Respiratory Diseases Treatment Market Size (US$ Mn) Analysis-2012–2016 and Forecast 2017–2027, By Causative Agent Segment
Table 23 : APEJ Swine Respiratory Diseases Treatment Market Size (US$ Mn) Analysis-2012–2016 and Forecast 2017–2027, By Treatment Type Segment
Table 24 : APEJ Swine Respiratory Diseases Treatment Market Size (US$ Mn) Analysis-2012–2016 and Forecast 2017–2027, By Route of Administration Segment
Table 25 : APEJ Swine Respiratory Diseases Treatment Market Size (US$ Mn) Analysis-2012–2016 and Forecast 2017–2027, By Distribution Channel Segment
Table 26 : Japan Swine Respiratory Diseases Treatment Market Size (US$ Mn) Analysis-2012–2016 and Forecast 2017–2027, By Causative Agent Segment
Table 27 : Japan Swine Respiratory Diseases Treatment Market Size (US$ Mn) Analysis-2012–2016 and Forecast 2017–2027, By Treatment Type Segment
Table 28 : Japan Swine Respiratory Diseases Treatment Market Size (US$ Mn) Analysis-2012–2016 and Forecast 2017–2027, By Route of Administration Segment
Table 29 : Japan Swine Respiratory Diseases Treatment Market Size (US$ Mn) Analysis-2012–2016 and Forecast 2017–2027, By Distribution Channel Segment
Table 30 : MEA Swine Respiratory Diseases Treatment Market Size (US$ Mn) Analysis-2012–2016 and Forecast 2017–2027, By Country
Table 31 : MEA Swine Respiratory Diseases Treatment Market Size (US$ Mn) Analysis-2012–2016 and Forecast 2017–2027, By Causative Agent Segment
Table 32 : MEA Swine Respiratory Diseases Treatment Market Size (US$ Mn) Analysis-2012–2016 and Forecast 2017–2027, By Treatment Type Segment
Table 33 : MEA Swine Respiratory Diseases Treatment Market Size (US$ Mn) Analysis-2012–2016 and Forecast 2017–2027, By Route of Administration Segment
Table 34 : MEA Swine Respiratory Diseases Treatment Market Size (US$ Mn) Analysis-2012–2016 and Forecast 2017–2027, By Distribution Channel Segment
Table 35 : Global Swine Respiratory Diseases Treatment Market Size (US$ Mn) Forecast by Region, 2012–2017
Table 36 : Global Swine Respiratory Diseases Treatment Market Size (US$ Mn) Forecast By Causative Agent, 2012–2017
Table 37 : Global Swine Respiratory Diseases Treatment Market Size (US$ Mn) Forecast By Treatment Type, 2012–2017
Table 38 : Global Swine Respiratory Diseases Treatment Market Size (US$ Mn) Forecast by Route of Administration, 2012–2017
Table 39 : Global Swine Respiratory Diseases Treatment Market Size (US$ Mn) Forecast by Distribution Channel, 2012–2017
Figure 01 : North America Swine Respiratory Diseases Treatment Market Value Share By Causative Agent (2017)
Figure 02 : North America Swine Respiratory Diseases Treatment Market Value Share By Treatment Type (2017)
Figure 03 : North America Swine Respiratory Diseases Treatment Market Value Share By Route of Administration (2017)
Figure 04 : North America Swine Respiratory Diseases Treatment Market Value Share By Distribution Channel (2017)
Figure 05 : North America Swine Respiratory Diseases Treatment Market Forecast 2017 and 2027
Figure 06 : North America Swine Respiratory Diseases Treatment Market Size (US$ Mn) Analysis, 2012–2016
Figure 07 : North America Swine Respiratory Diseases Treatment Market Size (US$ Mn) & Y-o-Y Growth (%), 2017–2027
Figure 08 : North America Swine Respiratory Diseases Treatment Market Size (US$ Mn) Analysis, 2012–2016, by Virus Segment
Figure 09 : North America Swine Respiratory Diseases Treatment Market Size (US$ Mn) & Y-o-Y Growth (%) (US$ Mn) Analysis, 2017–2027, by Virus Segment
Figure 10 : North America Swine Respiratory Diseases Treatment Market Size (US$ Mn) Analysis, 2012–2016, by Mycoplasma Segment
Figure 11 : North America Swine Respiratory Diseases Treatment Market Size (US$ Mn) & Y-o-Y Growth (%), 2017–2027, by Mycoplasma Segment
Figure 12 : North America Swine Respiratory Diseases Treatment Market Size (US$ Mn) Analysis, 2012–2016, by Bacteria Segment
Figure 13 : North America Swine Respiratory Diseases Treatment Market Size (US$ Mn) & Y-o-Y Growth (%) (US$ Mn) Analysis, 2017–2027, by Bacteria Segment
Figure 14 : North America Swine Respiratory Diseases Treatment Market Size (US$ Mn) Analysis, 2012–2016, by Others Segment
Figure 15 : North America Swine Respiratory Diseases Treatment Market Size (US$ Mn) & Y-o-Y Growth (%), 2017–2027, by Others Segment
Figure 16 : North America Swine Respiratory Diseases Treatment Market Size (US$ Mn) Analysis, 2012–2016, by Drugs Segment
Figure 17 : North America Swine Respiratory Diseases Treatment Market Size (US$ Mn) & Y-o-Y Growth (%), 2017–2027, by Drugs Segment
Figure 18 : North America Swine Respiratory Diseases Treatment Market Size (US$ Mn) Analysis, 2012–2016, by Vaccines Segment
Figure 19 : North America Swine Respiratory Diseases Treatment Market Size (US$ Mn) & Y-o-Y Growth (%), 2017–2027, by Vaccines Segment
Figure 20 : North America Swine Respiratory Diseases Treatment Market Size (US$ Mn) Analysis, 2012–2016, by Oral Segment
Figure 21 : North America Swine Respiratory Diseases Treatment Market Size (US$ Mn) & Y-o-Y Growth (%), 2017–2027, by Oral Segment
Figure 22 : North America Swine Respiratory Diseases Treatment Market Size (US$ Mn) Analysis, 2012–2016, by Parenteral Segment
Figure 23 : North America Swine Respiratory Diseases Treatment Market Size (US$ Mn) & Y-o-Y Growth (%), 2017–2027, by Parenteral Segment
Figure 24 : North America Swine Respiratory Diseases Treatment Market Size (US$ Mn) Analysis, 2012–2016, by Veterinary Hospitals Segment
Figure 25 : North America Swine Respiratory Diseases Treatment Market Size (US$ Mn) & Y-o-Y Growth (%), 2017–2027, by Veterinary Hospitals Segment
Figure 26 : North America Swine Respiratory Diseases Treatment Market Size (US$ Mn) Analysis, 2012–2016, by Veterinary Clinics Segment
Figure 27 : North America Swine Respiratory Diseases Treatment Market Size (US$ Mn) & Y-o-Y Growth (%), 2017–2027, by Veterinary Clinics Segment
Figure 28 : North America Swine Respiratory Diseases Treatment Market Size (US$ Mn) Analysis, 2012–2016, by Pharmacies Segment
Figure 29 : North America Swine Respiratory Diseases Treatment Market Size (US$ Mn) & Y-o-Y Growth (%), 2017–2027, by Pharmacies Segment
Figure 30 : North America Swine Respiratory Diseases Treatment Market Size (US$ Mn) Analysis, 2012–2016, by Others Segment
Figure 31 : North America Swine Respiratory Diseases Treatment Market Size (US$ Mn) & Y-o-Y Growth (%), 2017–2027, by Others Segment
Figure 32 : North America Swine Respiratory Diseases Treatment Market Attractiveness Analysis, 2017–2027, By Causative Agent
Figure 33 : North America Swine Respiratory Diseases Treatment Market Attractiveness Analysis, 2017–2027, By Treatment Type Type
Figure 34 : North America Swine Respiratory Diseases Treatment Market Attractiveness Analysis, 2017–2027, by Route of Administration
Figure 35 : North America Swine Respiratory Diseases Treatment Market Attractiveness Analysis, 2017–2027, by Distribution Channel
Figure 36 : North America Swine Respiratory Diseases Treatment Market Attractiveness Analysis, 2017–2027, by Country
Figure 37 : Latin America Swine Respiratory Diseases Treatment Market Value Share By Causative Agent (2017)
Figure 38 : Latin America Swine Respiratory Diseases Treatment Market Value Share By Treatment Type (2017)
Figure 39 : Latin America Swine Respiratory Diseases Treatment Market Value Share By Route of Administration (2017)
Figure 40 : Latin America Swine Respiratory Diseases Treatment Market Value Share By Distribution Channel (2017)
Figure 41 : Latin America Swine Respiratory Diseases Treatment Market Forecast 2017 and 2027
Figure 42 : Latin America Swine Respiratory Diseases Treatment Market Size (US$ Mn) Analysis, 2012–2016
Figure 43 : Latin America Swine Respiratory Diseases Treatment Market Size (US$ Mn) & Y-o-Y Growth (%), 2017–2027
Figure 44 : Latin America Swine Respiratory Diseases Treatment Market Size (US$ Mn) Analysis, 2012–2016, by Virus Segment
Figure 45 : Latin America Swine Respiratory Diseases Treatment Market Size (US$ Mn) & Y-o-Y Growth (%) (US$ Mn) Analysis, 2017–2027, by Virus Segment
Figure 46 : Latin America Swine Respiratory Diseases Treatment Market Size (US$ Mn) Analysis, 2012–2016, by Mycoplasma Segment
Figure 47 : Latin America Swine Respiratory Diseases Treatment Market Size (US$ Mn) & Y-o-Y Growth (%), 2017–2027, by Mycoplasma Segment
Figure 48 : Latin America Swine Respiratory Diseases Treatment Market Size (US$ Mn) Analysis, 2012–2016, by Bacteria Segment
Figure 49 : Latin America Swine Respiratory Diseases Treatment Market Size (US$ Mn) & Y-o-Y Growth (%) (US$ Mn) Analysis, 2017–2027, by Bacteria Segment
Figure 50 : Latin America Swine Respiratory Diseases Treatment Market Size (US$ Mn) Analysis, 2012–2016, by Others Segment
Figure 51 : Latin America Swine Respiratory Diseases Treatment Market Size (US$ Mn) & Y-o-Y Growth (%), 2017–2027, by Others Segment
Figure 52 : Latin America Swine Respiratory Diseases Treatment Market Size (US$ Mn) Analysis, 2012–2016, by Drugs Segment
Figure 53 : Latin America Swine Respiratory Diseases Treatment Market Size (US$ Mn) & Y-o-Y Growth (%), 2017–2027, by Drugs Segment
Figure 54 : Latin America Swine Respiratory Diseases Treatment Market Size (US$ Mn) Analysis, 2012–2016, by Vaccines Segment
Figure 55 : Latin America Swine Respiratory Diseases Treatment Market Size (US$ Mn) & Y-o-Y Growth (%), 2017–2027, by Vaccines Segment
Figure 56 : Latin America Swine Respiratory Diseases Treatment Market Size (US$ Mn) Analysis, 2012–2016, by Oral Segment
Figure 57 : Latin America Swine Respiratory Diseases Treatment Market Size (US$ Mn) & Y-o-Y Growth (%), 2017–2027, by Oral Segment
Figure 58 : Latin America Swine Respiratory Diseases Treatment Market Size (US$ Mn) Analysis, 2012–2016, by Parenteral Segment
Figure 59 : Latin America Swine Respiratory Diseases Treatment Market Size (US$ Mn) & Y-o-Y Growth (%), 2017–2027, by Parenteral Segment
Figure 60 : Latin America Swine Respiratory Diseases Treatment Market Size (US$ Mn) Analysis, 2012–2016, by Veterinary Hospitals Segment
Figure 61 : Latin America Swine Respiratory Diseases Treatment Market Size (US$ Mn) & Y-o-Y Growth (%), 2017–2027, by Veterinary Hospitals Segment
Figure 62 : Latin America Swine Respiratory Diseases Treatment Market Size (US$ Mn) Analysis, 2012–2016, by Veterinary Clinics Segment
Figure 63 : Latin America Swine Respiratory Diseases Treatment Market Size (US$ Mn) & Y-o-Y Growth (%), 2017–2027, by Veterinary Clinics Segment
Figure 64 : Latin America Swine Respiratory Diseases Treatment Market Size (US$ Mn) Analysis, 2012–2016, by Pharmacies Segment
Figure 65 : Latin America Swine Respiratory Diseases Treatment Market Size (US$ Mn) & Y-o-Y Growth (%), 2017–2027, by Pharmacies Segment
Figure 66 : Latin America Swine Respiratory Diseases Treatment Market Size (US$ Mn) Analysis, 2012–2016, by Others Segment
Figure 67 : Latin America Swine Respiratory Diseases Treatment Market Size (US$ Mn) & Y-o-Y Growth (%), 2017–2027, by Others Segment
Figure 68 : Latin America Swine Respiratory Diseases Treatment Market Attractiveness Analysis, 2017–2027, By Causative Agent
Figure 69 : Latin America Swine Respiratory Diseases Treatment Market Attractiveness Analysis, 2017–2027, By Treatment Type Type
Figure 70 : Latin America Swine Respiratory Diseases Treatment Market Attractiveness Analysis, 2017–2027, by Route of Administration
Figure 71 : Latin America Swine Respiratory Diseases Treatment Market Attractiveness Analysis, 2017–2027, by Distribution Channel
Figure 72 : Latin America Swine Respiratory Diseases Treatment Market Attractiveness Analysis, 2017–2027, by Country
Figure 73 : Western Europe Swine Respiratory Diseases Treatment Market Value Share By Causative Agent (2017)
Figure 74 : Western Europe Swine Respiratory Diseases Treatment Market Value Share By Treatment Type (2017)
Figure 75 : Western Europe Swine Respiratory Diseases Treatment Market Value Share By Route of Administration (2017)
Figure 76 : Western Europe Swine Respiratory Diseases Treatment Market Value Share By Distribution Channel (2017)
Figure 77 : Western Europe Swine Respiratory Diseases Treatment Market Forecast 2017 and 2027
Figure 78 : Western Europe Swine Respiratory Diseases Treatment Market Size (US$ Mn) Analysis, 2012–2016
Figure 79 : Western Europe Swine Respiratory Diseases Treatment Market Size (US$ Mn) & Y-o-Y Growth (%), 2017–2027
Figure 80 : Western Europe Swine Respiratory Diseases Treatment Market Size (US$ Mn) Analysis, 2012–2016, by Virus Segment
Figure 81 : Western Europe Swine Respiratory Diseases Treatment Market Size (US$ Mn) & Y-o-Y Growth (%) (US$ Mn) Analysis, 2017–2027, by Virus Segment
Figure 82 : Western Europe Swine Respiratory Diseases Treatment Market Size (US$ Mn) Analysis, 2012–2016, by Mycoplasma Segment
Figure 83 : Western Europe Swine Respiratory Diseases Treatment Market Size (US$ Mn) & Y-o-Y Growth (%), 2017–2027, by Mycoplasma Segment
Figure 84 : Western Europe Swine Respiratory Diseases Treatment Market Size (US$ Mn) Analysis, 2012–2016, by Bacteria Segment
Figure 85 : Western Europe Swine Respiratory Diseases Treatment Market Size (US$ Mn) & Y-o-Y Growth (%) (US$ Mn) Analysis, 2017–2027, by Bacteria Segment
Figure 86 : Western Europe Swine Respiratory Diseases Treatment Market Size (US$ Mn) Analysis, 2012–2016, by Others Segment
Figure 87 : Western Europe Swine Respiratory Diseases Treatment Market Size (US$ Mn) & Y-o-Y Growth (%), 2017–2027, by Others Segment
Figure 88 : Western Europe Swine Respiratory Diseases Treatment Market Size (US$ Mn) Analysis, 2012–2016, by Drugs Segment
Figure 89 : Western Europe Swine Respiratory Diseases Treatment Market Size (US$ Mn) & Y-o-Y Growth (%), 2017–2027, by Drugs Segment
Figure 90 : Western Europe Swine Respiratory Diseases Treatment Market Size (US$ Mn) Analysis, 2012–2016, by Vaccines Segment
Figure 91 : Western Europe Swine Respiratory Diseases Treatment Market Size (US$ Mn) & Y-o-Y Growth (%), 2017–2027, by Vaccines Segment
Figure 92 : Western Europe Swine Respiratory Diseases Treatment Market Size (US$ Mn) Analysis, 2012–2016, by Oral Segment
Figure 93 : Western Europe Swine Respiratory Diseases Treatment Market Size (US$ Mn) & Y-o-Y Growth (%), 2017–2027, by Oral Segment
Figure 94 : Western Europe Swine Respiratory Diseases Treatment Market Size (US$ Mn) Analysis, 2012–2016, by Parenteral Segment
Figure 95 : Western Europe Swine Respiratory Diseases Treatment Market Size (US$ Mn) & Y-o-Y Growth (%), 2017–2027, by Parenteral Segment
Figure 96 : Western Europe Swine Respiratory Diseases Treatment Market Size (US$ Mn) Analysis, 2012–2016, by Veterinary Hospitals Segment
Figure 97 : Western Europe Swine Respiratory Diseases Treatment Market Size (US$ Mn) & Y-o-Y Growth (%), 2017–2027, by Veterinary Hospitals Segment
Figure 98 : Western Europe Swine Respiratory Diseases Treatment Market Size (US$ Mn) Analysis, 2012–2016, by Veterinary Clinics Segment
Figure 99 : Western Europe Swine Respiratory Diseases Treatment Market Size (US$ Mn) & Y-o-Y Growth (%), 2017–2027, by Veterinary Clinics Segment
Figure 100 : Western Europe Swine Respiratory Diseases Treatment Market Size (US$ Mn) Analysis, 2012–2016, by Pharmacies Segment
Figure 101 : Western Europe Swine Respiratory Diseases Treatment Market Size (US$ Mn) & Y-o-Y Growth (%), 2017–2027, by Pharmacies Segment
Figure 102 : Western Europe Swine Respiratory Diseases Treatment Market Size (US$ Mn) Analysis, 2012–2016, by Others Segment
Figure 103 : Western Europe Swine Respiratory Diseases Treatment Market Size (US$ Mn) & Y-o-Y Growth (%), 2017–2027, by Others Segment
Figure 104 : Western Europe Swine Respiratory Diseases Treatment Market Attractiveness Analysis, 2017–2027, By Causative Agent
Figure 105 : Western Europe Swine Respiratory Diseases Treatment Market Attractiveness Analysis, 2017–2027, By Treatment Type Type
Figure 106 : Western Europe Swine Respiratory Diseases Treatment Market Attractiveness Analysis, 2017–2027, by Route of Administration
Figure 107 : Western Europe Swine Respiratory Diseases Treatment Market Attractiveness Analysis, 2017–2027, by Distribution Channel
Figure 108 : Western Europe Swine Respiratory Diseases Treatment Market Attractiveness Analysis, 2017–2027, by Country
Figure 109 : Eastern Europe Swine Respiratory Diseases Treatment Market Value Share By Causative Agent (2017)
Figure 110 : Eastern Europe Swine Respiratory Diseases Treatment Market Value Share By Treatment Type (2017)
Figure 111 : Eastern Europe Swine Respiratory Diseases Treatment Market Value Share By Route of Administration (2017)
Figure 112 : Eastern Europe Swine Respiratory Diseases Treatment Market Value Share By Distribution Channel (2017)
Figure 113: Eastern Europe Swine Respiratory Diseases Treatment Market Forecast 2017 and 2027
Figure 114 : Eastern Europe Swine Respiratory Diseases Treatment Market Size (US$ Mn) Analysis, 2012–2016
Figure 115 : Eastern Europe Swine Respiratory Diseases Treatment Market Size (US$ Mn) & Y-o-Y Growth (%), 2017–2027
Figure 116 : Eastern Europe Swine Respiratory Diseases Treatment Market Size (US$ Mn) Analysis, 2012–2016, by Virus Segment
Figure 117 : Eastern Europe Swine Respiratory Diseases Treatment Market Size (US$ Mn) & Y-o-Y Growth (%) (US$ Mn) Analysis, 2017–2027, by Virus Segment
Figure 118 : Eastern Europe Swine Respiratory Diseases Treatment Market Size (US$ Mn) Analysis, 2012–2016, by Mycoplasma Segment
Figure 119 : Eastern Europe Swine Respiratory Diseases Treatment Market Size (US$ Mn) & Y-o-Y Growth (%), 2017–2027, by Mycoplasma Segment
Figure 120 : Eastern Europe Swine Respiratory Diseases Treatment Market Size (US$ Mn) Analysis, 2012–2016, by Bacteria Segment
Figure 121 : Eastern Europe Swine Respiratory Diseases Treatment Market Size (US$ Mn) & Y-o-Y Growth (%) (US$ Mn) Analysis, 2017–2027, by Bacteria Segment
Figure 122 : Eastern Europe Swine Respiratory Diseases Treatment Market Size (US$ Mn) Analysis, 2012–2016, by Others Segment
Figure 123 : Eastern Europe Swine Respiratory Diseases Treatment Market Size (US$ Mn) & Y-o-Y Growth (%), 2017–2027, by Others Segment
Figure 124 : Eastern Europe Swine Respiratory Diseases Treatment Market Size (US$ Mn) Analysis, 2012–2016, by Drugs Segment
Figure 125 : Eastern Europe Swine Respiratory Diseases Treatment Market Size (US$ Mn) & Y-o-Y Growth (%), 2017–2027, by Drugs Segment
Figure 126 : Eastern Europe Swine Respiratory Diseases Treatment Market Size (US$ Mn) Analysis, 2012–2016, by Vaccines Segment
Figure 127 : Eastern Europe Swine Respiratory Diseases Treatment Market Size (US$ Mn) & Y-o-Y Growth (%), 2017–2027, by Vaccines Segment
Figure 128 : Eastern Europe Swine Respiratory Diseases Treatment Market Size (US$ Mn) Analysis, 2012–2016, by Oral Segment
Figure 129 : Eastern Europe Swine Respiratory Diseases Treatment Market Size (US$ Mn) & Y-o-Y Growth (%), 2017–2027, by Oral Segment
Figure 130 : Eastern Europe Swine Respiratory Diseases Treatment Market Size (US$ Mn) Analysis, 2012–2016, by Parenteral Segment
Figure 131 : Eastern Europe Swine Respiratory Diseases Treatment Market Size (US$ Mn) & Y-o-Y Growth (%), 2017–2027, by Parenteral Segment
Figure 132 : Eastern Europe Swine Respiratory Diseases Treatment Market Size (US$ Mn) Analysis, 2012–2016, by Veterinary Hospitals Segment
Figure 133 : Eastern Europe Swine Respiratory Diseases Treatment Market Size (US$ Mn) & Y-o-Y Growth (%), 2017–2027, by Veterinary Hospitals Segment
Figure 134 : Eastern Europe Swine Respiratory Diseases Treatment Market Size (US$ Mn) Analysis, 2012–2016, by Veterinary Clinics Segment
Figure 135 : Eastern Europe Swine Respiratory Diseases Treatment Market Size (US$ Mn) & Y-o-Y Growth (%), 2017–2027, by Veterinary Clinics Segment
Figure 136 : Eastern Europe Swine Respiratory Diseases Treatment Market Size (US$ Mn) Analysis, 2012–2016, by Pharmacies Segment
Figure 137 : Eastern Europe Swine Respiratory Diseases Treatment Market Size (US$ Mn) & Y-o-Y Growth (%), 2017–2027, by Pharmacies Segment
Figure 138 : Eastern Europe Swine Respiratory Diseases Treatment Market Size (US$ Mn) Analysis, 2012–2016, by Others Segment
Figure 139 : Eastern Europe Swine Respiratory Diseases Treatment Market Size (US$ Mn) & Y-o-Y Growth (%), 2017–2027, by Others Segment
Figure 140 : Eastern Europe Swine Respiratory Diseases Treatment Market Attractiveness Analysis, 2017–2027, By Causative Agent
Figure 141 : Eastern Europe Swine Respiratory Diseases Treatment Market Attractiveness Analysis, 2017–2027, By Treatment Type Type
Figure 142 : Eastern Europe Swine Respiratory Diseases Treatment Market Attractiveness Analysis, 2017–2027, by Route of Administration
Figure 143 : Eastern Europe Swine Respiratory Diseases Treatment Market Attractiveness Analysis, 2017–2027, by Distribution Channel
Figure 144 : Eastern Europe Swine Respiratory Diseases Treatment Market Attractiveness Analysis, 2017–2027, by Country
Figure 145 : APEJ Swine Respiratory Diseases Treatment Market Value Share By Causative Agent (2017)
Figure 146 : APEJ Swine Respiratory Diseases Treatment Market Value Share By Treatment Type (2017)
Figure 147 : APEJ Swine Respiratory Diseases Treatment Market Value Share By Route of Administration (2017)
Figure 148 : APEJ Swine Respiratory Diseases Treatment Market Value Share By Distribution Channel (2017)
Figure 149 : APEJ Swine Respiratory Diseases Treatment Market Forecast 2017 and 2027
Figure 150 : APEJ Swine Respiratory Diseases Treatment Market Size (US$ Mn) Analysis, 2012–2016
Figure 151 : APEJ Swine Respiratory Diseases Treatment Market Size (US$ Mn) & Y-o-Y Growth (%), 2017–2027
Figure 152 : APEJ Swine Respiratory Diseases Treatment Market Size (US$ Mn) Analysis, 2012–2016, by Virus Segment
Figure 153 : APEJ Swine Respiratory Diseases Treatment Market Size (US$ Mn) & Y-o-Y Growth (%) (US$ Mn) Analysis, 2017–2027, by Virus Segment
Figure 154 : APEJ Swine Respiratory Diseases Treatment Market Size (US$ Mn) Analysis, 2012–2016, by Mycoplasma Segment
Figure 155: APEJ Swine Respiratory Diseases Treatment Market Size (US$ Mn) & Y-o-Y Growth (%), 2017–2027, by Mycoplasma Segment
Figure 156 : APEJ Swine Respiratory Diseases Treatment Market Size (US$ Mn) Analysis, 2012–2016, by Bacteria Segment
Figure 157 : APEJ Swine Respiratory Diseases Treatment Market Size (US$ Mn) & Y-o-Y Growth (%) (US$ Mn) Analysis, 2017–2027, by Bacteria Segment
Figure 158 : APEJ Swine Respiratory Diseases Treatment Market Size (US$ Mn) Analysis, 2012–2016, by Others Segment
Figure 159 : APEJ Swine Respiratory Diseases Treatment Market Size (US$ Mn) & Y-o-Y Growth (%), 2017–2027, by Others Segment
Figure 160 : APEJ Swine Respiratory Diseases Treatment Market Size (US$ Mn) Analysis, 2012–2016, by Drugs Segment
Figure 161 : APEJ Swine Respiratory Diseases Treatment Market Size (US$ Mn) & Y-o-Y Growth (%), 2017–2027, by Drugs Segment
Figure 162 : APEJ Swine Respiratory Diseases Treatment Market Size (US$ Mn) Analysis, 2012–2016, by Vaccines Segment
Figure 163 : APEJ Swine Respiratory Diseases Treatment Market Size (US$ Mn) & Y-o-Y Growth (%), 2017–2027, by Vaccines Segment
Figure 164 : APEJ Swine Respiratory Diseases Treatment Market Size (US$ Mn) Analysis, 2012–2016, by Oral Segment
Figure 165 : APEJ Swine Respiratory Diseases Treatment Market Size (US$ Mn) & Y-o-Y Growth (%), 2017–2027, by Oral Segment
Figure 166 : APEJ Swine Respiratory Diseases Treatment Market Size (US$ Mn) Analysis, 2012–2016, by Parenteral Segment
Figure 167 : APEJ Swine Respiratory Diseases Treatment Market Size (US$ Mn) & Y-o-Y Growth (%), 2017–2027, by Parenteral Segment
Figure 168 : APEJ Swine Respiratory Diseases Treatment Market Size (US$ Mn) Analysis, 2012–2016, by Veterinary Hospitals Segment
Figure 169 : APEJ Swine Respiratory Diseases Treatment Market Size (US$ Mn) & Y-o-Y Growth (%), 2017–2027, by Veterinary Hospitals Segment
Figure 170 : APEJ Swine Respiratory Diseases Treatment Market Size (US$ Mn) Analysis, 2012–2016, by Veterinary Clinics Segment
Figure171 : APEJ Swine Respiratory Diseases Treatment Market Size (US$ Mn) & Y-o-Y Growth (%), 2017–2027, by Veterinary Clinics Segment
Figure 172 : APEJ Swine Respiratory Diseases Treatment Market Size (US$ Mn) Analysis, 2012–2016, by Pharmacies Segment
Figure 173 : APEJ Swine Respiratory Diseases Treatment Market Size (US$ Mn) & Y-o-Y Growth (%), 2017–2027, by Pharmacies Segment
Figure 174 : APEJ Swine Respiratory Diseases Treatment Market Size (US$ Mn) Analysis, 2012–2016, by Others Segment
Figure 175 : APEJ Swine Respiratory Diseases Treatment Market Size (US$ Mn) & Y-o-Y Growth (%), 2017–2027, by Others Segment
Figure 176 : APEJ Swine Respiratory Diseases Treatment Market Attractiveness Analysis, 2017–2027, By Causative Agent
Figure 177 : APEJ Swine Respiratory Diseases Treatment Market Attractiveness Analysis, 2017–2027, By Treatment Type Type
Figure 178 : APEJ Swine Respiratory Diseases Treatment Market Attractiveness Analysis, 2017–2027, by Route of Administration
Figure 179 : APEJ Swine Respiratory Diseases Treatment Market Attractiveness Analysis, 2017–2027, by Distribution Channel
Figure 180 : APEJ Swine Respiratory Diseases Treatment Market Attractiveness Analysis, 2017–2027, by Country
Figure 181 : Japan Swine Respiratory Diseases Treatment Market Value Share By Causative Agent (2017)
Figure 182 : Japan Swine Respiratory Diseases Treatment Market Value Share By Treatment Type (2017)
Figure 183 : Japan Swine Respiratory Diseases Treatment Market Value Share By Route of Administration (2017)
Figure 184 : Japan Swine Respiratory Diseases Treatment Market Value Share By Distribution Channel (2017)
Figure 185 : Japan Swine Respiratory Diseases Treatment Market Forecast 2017 and 2027
Figure 186 : Japan Swine Respiratory Diseases Treatment Market Size (US$ Mn) Analysis, 2012–2016
Figure 187 : Japan Swine Respiratory Diseases Treatment Market Size (US$ Mn) & Y-o-Y Growth (%), 2017–2027
Figure 188 : Japan Swine Respiratory Diseases Treatment Market Size (US$ Mn) Analysis, 2012–2016, by Virus Segment
Figure 189 : Japan Swine Respiratory Diseases Treatment Market Size (US$ Mn) & Y-o-Y Growth (%) (US$ Mn) Analysis, 2017–2027, by Virus Segment
Figure 190 : Japan Swine Respiratory Diseases Treatment Market Size (US$ Mn) Analysis, 2012–2016, by Mycoplasma Segment
Figure 191 : Japan Swine Respiratory Diseases Treatment Market Size (US$ Mn) & Y-o-Y Growth (%), 2017–2027, by Mycoplasma Segment
Figure 192 : Japan Swine Respiratory Diseases Treatment Market Size (US$ Mn) Analysis, 2012–2016, by Bacteria Segment
Figure 193 : Japan Swine Respiratory Diseases Treatment Market Size (US$ Mn) & Y-o-Y Growth (%) (US$ Mn) Analysis, 2017–2027, by Bacteria Segment
Figure 194 : Japan Swine Respiratory Diseases Treatment Market Size (US$ Mn) Analysis, 2012–2016, by Others Segment
Figure 195 : Japan Swine Respiratory Diseases Treatment Market Size (US$ Mn) & Y-o-Y Growth (%), 2017–2027, by Others Segment
Figure 196 : Japan Swine Respiratory Diseases Treatment Market Size (US$ Mn) Analysis, 2012–2016, by Drugs Segment
Figure 197 : Japan Swine Respiratory Diseases Treatment Market Size (US$ Mn) & Y-o-Y Growth (%), 2017–2027, by Drugs Segment
Figure 198 : Japan Swine Respiratory Diseases Treatment Market Size (US$ Mn) Analysis, 2012–2016, by Vaccines Segment
Figure 199 : Japan Swine Respiratory Diseases Treatment Market Size (US$ Mn) & Y-o-Y Growth (%), 2017–2027, by Vaccines Segment
Figure 200 : Japan Swine Respiratory Diseases Treatment Market Size (US$ Mn) Analysis, 2012–2016, by Oral Segment
Figure 201 : Japan Swine Respiratory Diseases Treatment Market Size (US$ Mn) & Y-o-Y Growth (%), 2017–2027, by Oral Segment
Figure 202 : Japan Swine Respiratory Diseases Treatment Market Size (US$ Mn) Analysis, 2012–2016, by Parenteral Segment
Figure 203 : Japan Swine Respiratory Diseases Treatment Market Size (US$ Mn) & Y-o-Y Growth (%), 2017–2027, by Parenteral Segment
Figure 204 : Japan Swine Respiratory Diseases Treatment Market Size (US$ Mn) Analysis, 2012–2016, by Veterinary Hospitals Segment
Figure 205 : Japan Swine Respiratory Diseases Treatment Market Size (US$ Mn) & Y-o-Y Growth (%), 2017–2027, by Veterinary Hospitals Segment
Figure 206 : Japan Swine Respiratory Diseases Treatment Market Size (US$ Mn) Analysis, 2012–2016, by Veterinary Clinics Segment
Figure 207 : Japan Swine Respiratory Diseases Treatment Market Size (US$ Mn) & Y-o-Y Growth (%), 2017–2027, by Veterinary Clinics Segment
Figure 208 : Japan Swine Respiratory Diseases Treatment Market Size (US$ Mn) Analysis, 2012–2016, by Pharmacies Segment
Figure 209 : Japan Swine Respiratory Diseases Treatment Market Size (US$ Mn) & Y-o-Y Growth (%), 2017–2027, by Pharmacies Segment
Figure 210 : Japan Swine Respiratory Diseases Treatment Market Size (US$ Mn) Analysis, 2012–2016, by Others Segment
Figure 211 : Japan Swine Respiratory Diseases Treatment Market Size (US$ Mn) & Y-o-Y Growth (%), 2017–2027, by Others Segment
Figure 212 : Japan Swine Respiratory Diseases Treatment Market Attractiveness Analysis, 2017–2027, By Causative Agent
Figure 213 : Japan Swine Respiratory Diseases Treatment Market Attractiveness Analysis, 2017–2027, By Treatment Type Type
Figure 214 : Japan Swine Respiratory Diseases Treatment Market Attractiveness Analysis, 2017–2027, by Route of Administration
Figure 215 : Japan Swine Respiratory Diseases Treatment Market Attractiveness Analysis, 2017–2027, by Distribution Channel
Figure 216 : MEA Swine Respiratory Diseases Treatment Market Value Share By Causative Agent (2017)
Figure 217 : MEA Swine Respiratory Diseases Treatment Market Value Share By Treatment Type (2017)
Figure 218 : MEA Swine Respiratory Diseases Treatment Market Value Share By Route of Administration (2017)
Figure 219 : MEA Swine Respiratory Diseases Treatment Market Value Share By Distribution Channel (2017)
Figure 220 : MEA Swine Respiratory Diseases Treatment Market Forecast 2017 and 2027
Figure 221 : MEA Swine Respiratory Diseases Treatment Market Size (US$ Mn) Analysis, 2012–2016
Figure 222 : MEA Swine Respiratory Diseases Treatment Market Size (US$ Mn) & Y-o-Y Growth (%), 2017–2027
Figure 223 : MEA Swine Respiratory Diseases Treatment Market Size (US$ Mn) Analysis, 2012–2016, by Virus Segment
Figure 224 : MEA Swine Respiratory Diseases Treatment Market Size (US$ Mn) & Y-o-Y Growth (%) (US$ Mn) Analysis, 2017–2027, by Virus Segment
Figure 225 : MEA Swine Respiratory Diseases Treatment Market Size (US$ Mn) Analysis, 2012–2016, by Mycoplasma Segment
Figure 226 : MEA Swine Respiratory Diseases Treatment Market Size (US$ Mn) & Y-o-Y Growth (%), 2017–2027, by Mycoplasma Segment
Figure 227 : MEA Swine Respiratory Diseases Treatment Market Size (US$ Mn) Analysis, 2012–2016, by Bacteria Segment
Figure 228 : MEA Swine Respiratory Diseases Treatment Market Size (US$ Mn) & Y-o-Y Growth (%) (US$ Mn) Analysis, 2017–2027, by Bacteria Segment
Figure 229 : MEA Swine Respiratory Diseases Treatment Market Size (US$ Mn) Analysis, 2012–2016, by Others Segment
Figure 230 : MEA Swine Respiratory Diseases Treatment Market Size (US$ Mn) & Y-o-Y Growth (%), 2017–2027, by Others Segment
Figure 231 : MEA Swine Respiratory Diseases Treatment Market Size (US$ Mn) Analysis, 2012–2016, by Drugs Segment
Figure 232 : MEA Swine Respiratory Diseases Treatment Market Size (US$ Mn) & Y-o-Y Growth (%), 2017–2027, by Drugs Segment
Figure 233 : MEA Swine Respiratory Diseases Treatment Market Size (US$ Mn) Analysis, 2012–2016, by Vaccines Segment
Figure 234 : MEA Swine Respiratory Diseases Treatment Market Size (US$ Mn) & Y-o-Y Growth (%), 2017–2027, by Vaccines Segment
Figure 235 : MEA Swine Respiratory Diseases Treatment Market Size (US$ Mn) Analysis, 2012–2016, by Oral Segment
Figure 236 : MEA Swine Respiratory Diseases Treatment Market Size (US$ Mn) & Y-o-Y Growth (%), 2017–2027, by Oral Segment
Figure 237 : MEA Swine Respiratory Diseases Treatment Market Size (US$ Mn) Analysis, 2012–2016, by Parenteral Segment
Figure 238 : MEA Swine Respiratory Diseases Treatment Market Size (US$ Mn) & Y-o-Y Growth (%), 2017–2027, by Parenteral Segment
Figure 239 : MEA Swine Respiratory Diseases Treatment Market Size (US$ Mn) Analysis, 2012–2016, by Veterinary Hospitals Segment
Figure 240 : MEA Swine Respiratory Diseases Treatment Market Size (US$ Mn) & Y-o-Y Growth (%), 2017–2027, by Veterinary Hospitals Segment
Figure 241 : MEA Swine Respiratory Diseases Treatment Market Size (US$ Mn) Analysis, 2012–2016, by Veterinary Clinics Segment
Figure 242 : MEA Swine Respiratory Diseases Treatment Market Size (US$ Mn) & Y-o-Y Growth (%), 2017–2027, by Veterinary Clinics Segment
Figure 243 : MEA Swine Respiratory Diseases Treatment Market Size (US$ Mn) Analysis, 2012–2016, by Pharmacies Segment
Figure 244 : MEA Swine Respiratory Diseases Treatment Market Size (US$ Mn) & Y-o-Y Growth (%), 2017–2027, by Pharmacies Segment
Figure 245 : MEA Swine Respiratory Diseases Treatment Market Size (US$ Mn) Analysis, 2012–2016, by Others Segment
Figure 246 : MEA Swine Respiratory Diseases Treatment Market Size (US$ Mn) & Y-o-Y Growth (%), 2017–2027, by Others Segment
Figure 247 : MEA Swine Respiratory Diseases Treatment Market Attractiveness Analysis, 2017–2027, By Causative Agent
Figure 248 : MEA Swine Respiratory Diseases Treatment Market Attractiveness Analysis, 2017–2027, By Treatment Type Type
Figure 249 : MEA Swine Respiratory Diseases Treatment Market Attractiveness Analysis, 2017–2027, by Route of Administration
Figure 250 : MEA Swine Respiratory Diseases Treatment Market Attractiveness Analysis, 2017–2027, by Distribution Channel
Figure 251 : MEA Swine Respiratory Diseases Treatment Market Attractiveness Analysis, 2017–2027, by Country
Figure 252 : Global Swine Respiratory Diseases Treatment Market Attractiveness Analysis by Region, 2017–2027
Figure 253 : Global Swine Respiratory Diseases Treatment Market Attractiveness Analysis By Causative Agent, 2017–2027
Figure 254 : Global Swine Respiratory Diseases Treatment Market Attractiveness Analysis By Treatment Type, 2017–2027
Figure 255 : Global Swine Respiratory Diseases Treatment Market Attractiveness Analysis by Route of Administration, 2017–2027
Figure 256 : Global Swine Respiratory Diseases Treatment Market Attractiveness Analysis by Distribution Channel, 2017–2027
Figure 257 : Global Swine Respiratory Diseases Treatment Market Value Analysis and Forecast, 2016–2027 (US$ Mn)
Figure 258 : Global Swine Respiratory Diseases Treatment Market Absolute $ Opportunity (US$ Mn), 2012–2016
Figure 259 : Global Swine Respiratory Diseases Treatment Market Absolute $ Opportunity (US$ Mn), 2016–2027