The therapeutic respiratory devices market is estimated to attain a market value of US$ 50.6 billion in the year 2023. From the period 2023 to 2033, the market is assessed to reach US$ 80.2 billion by 2033, registering a CAGR of 4.7%. The therapeutic respiratory devices industry is predicted to rise due to the surging prevalence of respiratory diseases, such as COPD and sleep apnea.
The therapeutic respiratory devices market is driven by the growing elderly population, increased prevalence of respiratory diseases, and rapid technical improvements. This market is further expected to propel due to the rising demand for therapeutic respiratory devices, such as humidifiers, nebulizers, and oxygen concentrators.
The increasing need for emergency treatment for prolonged illnesses and protracted treatment associated with lung diseases in children and adults is expected to fuel the growth of the therapeutic respiratory devices industry.
Attributes | Details |
---|---|
Therapeutic Respiratory Devices Market CAGR (2023 to 2033) | 4.7% |
Therapeutic Respiratory Devices Market (2033) | US$ 80.2 billion |
Drivers for Therapeutic Respiratory Devices Market Attraction | Rapid Urbanization, Prevalence of respiratory disorders, Technical innovation,Growing adoption of respiratory therapeutic devices |
Don't pay for what you don't need
Customize your report by selecting specific countries or regions and save 30%!
In the historical period, the therapeutic respiratory devices market recorded a CAGR of 8.5%. Going forward, the market is projected to expand at a CAGR of 4.7% over the forecast period. In 2023, the market is anticipated to attain US$ 50.6 billion.
In the preceding years, the market was positively influenced by the growing population density of elderly people. The increased frequency of respiratory diseases also supported the market expansion. In addition, the outbreak of coronavirus also favored the market growth in the historical period. The virus targeted the respiratory system of a human being. As the cases surged, so did the market.
Given below are the key drivers assessed for market expansion of therapeutic respiratory devices in respect to the mentioned duration slots:
Attribute | Valuation |
---|---|
2025 | US$ 55.47 billion |
2028 | US$ 63.66 billion |
2032 | US$ 76.50 billion |
Historical CAGR (2017 to 2022) | 8.5% |
---|---|
Forecast CAGR (2023 to 2033) | 4.7% |
Doctors or physicians recommend therapeutic respiratory devices to treat respiratory problems, because they benefit patients with both acute and chronic conditions. These devices are easy to use and require little upkeep. As a result of ongoing technological breakthroughs, the market demand for therapeutic respiratory devices is anticipated to expand during the forecast period.
The rising frequency of respiratory disorders, such as asthma and chronic obstructive pulmonary disease, drives the demand for therapeutic respiratory devices. Furthermore, high rates of cigarette smoking and high pollution levels are also contributing towards market expansion. Heightened vulnerability to airborne illnesses, and accidents resulting in the chest and nasal injuries that lead to respiratory difficulties, are propelling market growth. These therapeutic respiratory devices are projected to see the significant expansion in the upcoming years.
Just like the therapeutic respiratory devices (TRDs) market, the market for home-based light-weight and rechargeable battery-operated TRDs is predicted to rise quickly during the forecast period. These factors are predicted to undoubtedly contribute to the creation of new therapeutic respiratory devices that are anticipated to be favored over traditional equipment by specialists.
Therapeutic respiratory devices market expansion has been limited to some extent by a lack of awareness resulting in a substantial under-diagnosed and under-treated population. This market is currently confronted with a lack of reimbursements for numerous diagnostic tests.
Reimbursement policies vary across Europe and are only accessible in a few countries for Positive Airway Pressure (PAP) devices and oral appliances (devices that are not covered by insurance have a low market share in the region). In addition, the majority of countries in Asia and Rest of the World countries have minimal reimbursement coverage for therapeutic respiratory devices. This is likely to hinder the therapeutic respiratory devices growth prospects.
The emergence of smart inhalers is expected to provide lucrative growth opportunities for the therapeutic respiratory devices market through 2033.
Smart inhalers are devices that serve three purposes, i.e., to tell the patient about the daily dosage limit, the amount of dosage left, and the patient's health status. As technology improves, it becomes increasingly valuable for healthcare products. People who take numerous asthma drugs, on the other hand, must consent to use multiple medications, thus aiding the market growth.
Demand from the United States for smart inhalers is predicted to be quite significant due to the rising occurrence of respiratory ailments, increased pollution, and an ageing population.
Patients are well-informed about respiratory diseases, thanks to proliferation of internet and affordable smart devices that help them acquire information rapidly. This is another growth prospect for the therapeutic respiratory devices market.
During the forecast period, the rising incidence of respiratory disorders, and the high prevalence of tobacco smoking, are projected to stimulate the market expansion. Additionally, factors like the growing geriatric population and the massive need for enhanced portable devices are expected to fuel the therapeutic respiratory devices expansion.
Intelligent ventilators, portable PAP devices, smart inhalers, and nebulizers are all on the rise in therapeutic respiratory devices, helping to provide real-time monitoring and data transfer to clinicians. Therapeutic respiratory devices manufacturers are now working on high technology PAP devices to treat sleep apnea. Due to the high prevalence of respiratory disorders in India, Brazil, China, and Japan, the therapeutic respiratory devices market is likely to rise significantly in terms of CAGR rate during the forecast period.
High global smoking population, increasing the illness burden, is the primary driver of the respiratory device market. About 90% of lung cancer fatalities and 80% of deaths from the chronic obstructive pulmonary disease are caused by smoking. It has been discovered that smokers are 12-13 times more likely than non-smokers to die from COPD.
Wireless monitoring technologies, which improve device efficiency and support automated remediation operations, can also be blamed for the surge in demand for therapeutic respiratory devices. As a result of such advancements, numerous breathing parameters can be improved, resulting in significant alleviation for patients and increased therapeutic respiratory devices sales.
Healthcare businesses are focusing their efforts on the therapeutic respiratory devices market on producing polysomnography (PSG) sensors that offer information to healthcare providers, increasing their market share. The PSG's deployment in the healthcare business, combined with signal analysis and machine learning, is likely to boost the demand for therapeutic respiratory devices.
Get the data you need at a Fraction of the cost
Personalize your report by choosing insights you need
and save 40%!
Taxonomy | Product |
---|---|
Top Segment | Positive Airway Pressure Devices |
Forecast CAGR | 4.6% |
Taxonomy | End-use |
---|---|
Top Segment | Hospital |
Forecast CAGR | 4.2% |
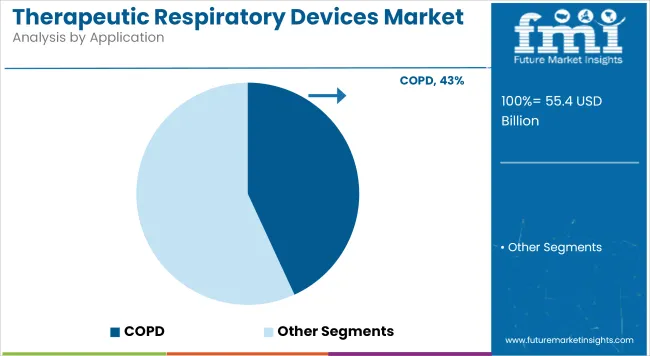
The chronic obstructive pulmonary disease (COPD) application segment is projected to hold the significant share in the therapeutic respiratory devices market. Due to the growing elderly population and rising air pollution in metropolitan areas, the COPD segment is projected to expand.
The therapeutic respiratory devices market is segmented into hospitals, home care settings, and emergency centers, based on end-use. Due to rising healthcare expenditure to provide effective diagnosis, treatment, and improved patient care in hospitals, the hospital segment is estimated to register a CAGR of 4.2%.
The therapeutic respiratory devices market is projected to grow as the number of hospital diagnoses and treatments increases. As a result of these instances, the demand for therapeutic respiratory equipment in hospitals is expected to increase.
Historical CAGR (2017 to 2022) | 8% |
---|---|
Forecast CAGR (2023 to 2033) | 4.2% |
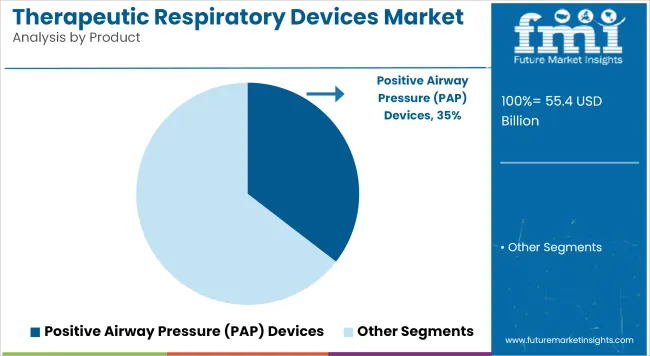
Due to technical improvements in therapeutic respiratory devices, the positive airway pressure devices category is projected to expand, led by rising product approval and new product launches. Continuous positive airway pressure (CPAP) devices, auto-titrating positive airway pressure (APAP) devices, and bi-level positive airway pressure (BiPAP) devices, are the three types of PAP devices.
During the study period, such breakthroughs in therapeutic respiratory devices are projected to boost the market growth. For example, ResMed released AirSense11, a next-generation PAP therapy device, in August 2021. It contains a feature that allows for remote software updates, making therapy easy to start and provide comfort during night-time use.
Historical CAGR (2017 to 2022) | 8.2% |
---|---|
Forecast CAGR (2023 to 2033) | 4.6% |
Country | The United States |
---|---|
CAGR (2023 to 2033) | 4.5% |
Market Size (2033) | US$ 28.4 billion |
Country | The United Kingdom |
---|---|
CAGR (2023 to 2033) | 3.8% |
Market Size (2033) | US$ 3.4 billion |
Country | China |
---|---|
CAGR (2023 to 2033) | 4.1% |
Market Size (2033) | US$ 5.8 billion |
Country | Japan |
---|---|
CAGR (2023 to 2033) | 3.3% |
Market Size (2033) | US$ 4.7 billion |
Country | South Korea |
---|---|
CAGR (2023 to 2033) | 2.5% |
Market Size (2033) | US$ 2.8 billion |
Attributes | Details |
---|---|
Market Size (2033) | US$ 28.4 billion |
Market Absolute Dollar Growth (US$ million/billion) | US$ 10.1 billion |
The United States therapeutic respiratory devices market is projected to hold a significant share of the overall market. The market is estimated to attain market revenue of US$ 28.4 billion by 2033, expanding at a brisk CAGR of 4.5%. The market growth in the country can be attributed to the surging incidences of COPD, tuberculosis, pneumonia, and asthma.
In April 2021, the Asthma and Allergy Foundation of America released the statistics, revealing beyond 20 million people in the United States aged 18+ suffer from asthma. Therefore, the rising frequency of such diseases is necessitating the requirement for therapeutic respiratory devices in the country.
Key market players operating in the country aim to launch new products for supporting the market growth in the coming years. In May 2022, Honeywell International Inc. released respiratory DC365 Small Surgical N95 Respirator products that are NIOSH-certified to meet the demands of healthcare personnel.
In July 2022, a new study was released in the Pulmonary Therapy, called “Respiratory Symptoms among US Adults: A Cross-sectional Health Survey Study”. The study revealed that the extremely common respiratory symptom, succeeded by a cough and shortness of breath, impacts 17% of adults in America.
Historical CAGR (2017 to 2022) | 8.2% |
---|---|
Forecast CAGR (2023 to 2033) | 4.5% |
Attributes | Details |
---|---|
Market Size (2033) | US$ 5.8 billion |
Market Absolute Dollar Growth (US$ million/billion) | US$ 1.9 billion |
China is projected to lead the market at second position in the following period. The market valuation, estimated by FMI, for China's market is US$ 5.8 billion by 2033. The market is expected to surge at a CAGR of 4.1% over the forecast period. The market growth is predicted to be assisted by the growing prevalence of illnesses, such as asthma in adults and children alike. Moreover, the new technological advances in the market are predicted to boost the market development over the forecast period.
The upsurge in the development of hospitals and ambulatory surgical centers has also opened up more opportunities for medical oxygen concentrators in these premises. Additionally, growing demand for these devices in home healthcare settings is also supporting the market development.
Historical CAGR (2017 to 2022) | 7.8% |
---|---|
Forecast CAGR (2023 to 2033) | 4.1% |
Attributes | Details |
---|---|
Market Size (2033) | US$ 3.4 billion |
Market Absolute Dollar Growth (US$ million/billion) | US$ 1.1 billion |
The United Kingdom therapeutic respiratory devices market is expected to attain US$ 3.4 billion by 2033. The market is projected to expand at a CAGR of 3.8%.
The regional growth can be attributed to the frequent occurrences of respiratory diseases, such as tuberculosis, lung cancer, COPD, and asthma. Furthermore, the incessant exposure to occupational irritants, and increase in the indoor air pollution levels, are contributing to several respiratory issues. As a result, the demand for therapeutic respiratory devices is rising.
Historical CAGR (2017 to 2022) | 7.2% |
---|---|
Forecast CAGR (2023 to 2033) | 3.8% |
Attributes | Details |
---|---|
Market Size (2033) | US$ 4.7 billion |
Market Absolute Dollar Growth (US$ million/billion) | US$ 1.3 billion |
The market in Japan is estimated to amount for US$ 4.7 billion by 2033. The market is projected to move at a pace of 3.3% CAGR over the forecast period. The top companies operational in the country are striving to leverage their strengths and expertise to develop therapeutic respiratory solutions to meet the unmet patient requirements for respiratory issues.
Rising initiatives to treat patients dealing with advanced disease to breathe easily and enjoy a better quality of life, sans surgical intervention, is projected to boost market development.
In November 2022, Pulmonx Corporation, a global leading provider of minimally invasive treatments for extreme lung disease, announced the approval received for Zephyr® Endobronchial Valve.
This breakthrough technology has recently received approval from the Japanese Ministry of Health, Labor and Welfare (MHLW) to treat extreme cases of COPD/emphysema patients. The drug can help deliver noticeable benefits to patients, such as improvements in lung function, quality of life, and exercise capacity.
Historical CAGR (2017 to 2022) | 6.7% |
---|---|
Forecast CAGR (2023 to 2033) | 3.3% |
To maintain competitiveness in the therapeutic respiratory devices market, key players employ various growth strategies, such as mergers and acquisitions, collaborations, and product releases.
Major players in the therapeutic respiratory devices market include:
Recent Developments in the Therapeutic Respiratory Devices Market:
Attribute | Details |
---|---|
Market Size Value in 2023 | US$ 50.6 billion |
Market Forecast Value in 2033 | US$ 80.2 billion |
Global Growth Rate | 4.7% |
Forecast Period | 2023 to 2033 |
Historical Data Available for | 2017 to 2022 |
Market Analysis | US$ billion/million for Value |
Key Regions Covered | North America; Latin America; Europe; Asia Pacific; Middle East and Africa |
Key Countries Covered | The United States, Brazil, Mexico, Canada, the United Kingdom, Germany, France, Spain, Italy, Russia, Argentina, Brunei, Cambodia, Indonesia, Laos, Malaysia, Myanmar, the Philippines, Singapore, Thailand, Vietnam, Australia, Poland, China, New Zealand, Japan, North Africa, GCC countries, Ethiopia, South Africa, others |
Key Market Segments Covered | Product, Application, End-use, Region |
Key Companies Profiled | Aerin Medical; BMC Medical Co., Ltd.; CareFusion Corporation; Covidien Plc; Drägerwerk AG & Co. KGaA; Fisher & Paykel Healthcare Limited; GE Healthcare; Hamilton Medical; Invacare Corporation; Koninklijke Philips N.V.; Medtronic; Nidek Medical Products, Inc.; Teleflex Incorporated; Smiths Medical |
Pricing | Available upon Request |
The therapeutic respiratory devices market CAGR 2033 is 4.7%.
The market is estimated to secure a size of US$ 50.6 billion in 2023.
The projected market value of the market for 2033 is US$ 80.2 billion.
Key players are developing the market by introducing innovative products.
The market is gaining momentum due to the increasing prevalence of respiratory diseases.
1. Executive Summary | Therapeutic Respiratory Devices Market 1.1. Global Market Outlook 1.2. Demand-side Trends 1.3. Supply-side Trends 1.4. Technology Roadmap Analysis 1.5. Analysis and Recommendations 2. Market Overview 2.1. Market Coverage / Taxonomy 2.2. Market Definition / Scope / Limitations 3. Market Background 3.1. Market Dynamics 3.1.1. Drivers 3.1.2. Restraints 3.1.3. Opportunity 3.1.4. Trends 3.2. Scenario Forecast 3.2.1. Demand in Optimistic Scenario 3.2.2. Demand in Likely Scenario 3.2.3. Demand in Conservative Scenario 3.3. Opportunity Map Analysis 3.4. Investment Feasibility Matrix 3.5. PESTLE and Porter’s Analysis 3.6. Regulatory Landscape 3.6.1. By Key Regions 3.6.2. By Key Countries 3.7. Regional Parent Market Outlook 4. Global Market Analysis 2017 to 2022 and Forecast, 2023 to 2033 4.1. Historical Market Size Value (US$ Million) Analysis, 2017 to 2022 4.2. Current and Future Market Size Value (US$ Million) Projections, 2023 to 2033 4.2.1. Y-o-Y Growth Trend Analysis 4.2.2. Absolute $ Opportunity Analysis 5. Global Market Analysis 2017 to 2022 and Forecast 2023 to 2033, By Product 5.1. Introduction / Key Findings 5.2. Historical Market Size Value (US$ Million) Analysis By Product, 2017 to 2022 5.3. Current and Future Market Size Value (US$ Million) Analysis and Forecast By Product, 2023 to 2033 5.3.1. Positive Airway Pressure Devices 5.3.1.1. Continuous Positive Airway Pressure Devices 5.3.1.2. Auto-titrating Positive Airway Pressure Devices 5.3.1.3. Bi-level Positive Airway Pressure Devices 5.3.2. Oxygen Concentrator 5.3.2.1. Fixed Oxygen Concentrators 5.3.2.2. Portable Oxygen Concentrators 5.3.3. Ventilators 5.3.3.1. Adult Ventilators 5.3.3.2. Neonatal Ventilators 5.3.4. Inhalers 5.3.4.1. Metered Dose Inhaler 5.3.4.2. Dry Powder Inhaler 5.3.4.3. Soft Mist Inhaler 5.3.5. Nebulizers 5.3.5.1. Compressor-based Nebulizers 5.3.5.2. Piston-based Hand-held Nebulizers 5.3.5.3. Ultrasonic Nebulizers 5.3.6. Humidifiers 5.3.6.1. Heated Humidifiers 5.3.6.2. Passover Humidifiers 5.3.6.3. Integrated Humidifiers 5.3.6.4. Built-in Humidifiers 5.3.6.5. Standalone Humidifiers 5.3.7. Others 5.4. Y-o-Y Growth Trend Analysis By Product, 2017 to 2022 5.5. Absolute $ Opportunity Analysis By Product, 2023 to 2033 6. Global Market Analysis 2017 to 2022 and Forecast 2023 to 2033, By Application 6.1. Introduction / Key Findings 6.2. Historical Market Size Value (US$ Million) Analysis By Application, 2017 to 2022 6.3. Current and Future Market Size Value (US$ Million) Analysis and Forecast By Application, 2023 to 2033 6.3.1. COPD 6.3.2. Obstructive Sleep Apnea 6.3.3. Asthma 6.3.4. Respiratory Distress Syndrome 6.3.5. Cystic Fibrosis 6.3.6. Others 6.4. Y-o-Y Growth Trend Analysis By Application, 2017 to 2022 6.5. Absolute $ Opportunity Analysis By Application, 2023 to 2033 7. Global Market Analysis 2017 to 2022 and Forecast 2023 to 2033, By End-use 7.1. Introduction / Key Findings 7.2. Historical Market Size Value (US$ Million) Analysis By End-use , 2017 to 2022 7.3. Current and Future Market Size Value (US$ Million) Analysis and Forecast By End-use , 2023 to 2033 7.3.1. Hospital 7.3.2. Homecare Settings 7.3.3. Emergency Centers 7.4. Y-o-Y Growth Trend Analysis By End-use, 2017 to 2022 7.5. Absolute $ Opportunity Analysis By End-use, 2023 to 2033 8. Global Market Analysis 2017 to 2022 and Forecast 2023 to 2033, By Region 8.1. Introduction 8.2. Historical Market Size Value (US$ Million) Analysis By Region, 2017 to 2022 8.3. Current Market Size Value (US$ Million) Analysis and Forecast By Region, 2023 to 2033 8.3.1. North America 8.3.2. Latin America 8.3.3. Europe 8.3.4. Asia Pacific 8.3.5. Middle East and Africa 8.4. Market Attractiveness Analysis By Region 9. North America Market Analysis 2017 to 2022 and Forecast 2023 to 2033, By Country 9.1. Historical Market Size Value (US$ Million) Trend Analysis By Market Taxonomy, 2017 to 2022 9.2. Market Size Value (US$ Million) Forecast By Market Taxonomy, 2023 to 2033 9.2.1. By Country 9.2.1.1. The USA 9.2.1.2. Canada 9.2.2. By Product 9.2.3. By Application 9.2.4. By End-use 9.3. Market Attractiveness Analysis 9.3.1. By Country 9.3.2. By Product 9.3.3. By Application 9.3.4. By End-use 9.4. Key Takeaways 10. Latin America Market Analysis 2017 to 2022 and Forecast 2023 to 2033, By Country 10.1. Historical Market Size Value (US$ Million) Trend Analysis By Market Taxonomy, 2017 to 2022 10.2. Market Size Value (US$ Million) Forecast By Market Taxonomy, 2023 to 2033 10.2.1. By Country 10.2.1.1. Brazil 10.2.1.2. Mexico 10.2.1.3. Rest of Latin America 10.2.2. By Product 10.2.3. By Application 10.2.4. By End-use 10.3. Market Attractiveness Analysis 10.3.1. By Country 10.3.2. By Product 10.3.3. By Application 10.3.4. By End-use 10.4. Key Takeaways 11. Europe Market Analysis 2017 to 2022 and Forecast 2023 to 2033, By Country 11.1. Historical Market Size Value (US$ Million) Trend Analysis By Market Taxonomy, 2017 to 2022 11.2. Market Size Value (US$ Million) Forecast By Market Taxonomy, 2023 to 2033 11.2.1. By Country 11.2.1.1. United Kingdom (UK) 11.2.1.2. Spain 11.2.1.3. Germany 11.2.1.4. Italy 11.2.1.5. France 11.2.1.6. Rest of Europe 11.2.2. By Product 11.2.3. By Application 11.2.4. By End-use 11.3. Market Attractiveness Analysis 11.3.1. By Country 11.3.2. By Product 11.3.3. By Application 11.3.4. By End-use 11.4. Key Takeaways 12. Asia Pacific Market Analysis 2017 to 2022 and Forecast 2023 to 2033, By Country 12.1. Historical Market Size Value (US$ Million) Trend Analysis By Market Taxonomy, 2017 to 2022 12.2. Market Size Value (US$ Million) Forecast By Market Taxonomy, 2023 to 2033 12.2.1. By Country 12.2.1.1. India 12.2.1.2. China 12.2.1.3. Japan 12.2.1.4. Australia & New Zealand 12.2.1.5. Rest of Asia Pacific 12.2.2. By Product 12.2.3. By Application 12.2.4. By End-use 12.3. Market Attractiveness Analysis 12.3.1. By Country 12.3.2. By Product 12.3.3. By Application 12.3.4. By End-use 12.4. Key Takeaways 13. Middle East and Africa Market Analysis 2017 to 2022 and Forecast 2023 to 2033, By Country 13.1. Historical Market Size Value (US$ Million) Trend Analysis By Market Taxonomy, 2017 to 2022 13.2. Market Size Value (US$ Million) Forecast By Market Taxonomy, 2023 to 2033 13.2.1. By Country 13.2.1.1. South Africa 13.2.1.2. GCC Countries 13.2.1.3. Rest of Middle East and Africa 13.2.2. By Product 13.2.3. By Application 13.2.4. By End-use 13.3. Market Attractiveness Analysis 13.3.1. By Country 13.3.2. By Product 13.3.3. By Application 13.3.4. By End-use 13.4. Key Takeaways 14. Key Countries Market Analysis 14.1. USA 14.1.1. Pricing Analysis 14.1.2. Market Share Analysis, 2022 14.1.2.1. By Product 14.1.2.2. By Application 14.1.2.3. By End-use 14.2. Canada 14.2.1. Pricing Analysis 14.2.2. Market Share Analysis, 2022 14.2.2.1. By Product 14.2.2.2. By Application 14.2.2.3. By End-use 14.3. Brazil 14.3.1. Pricing Analysis 14.3.2. Market Share Analysis, 2022 14.3.2.1. By Product 14.3.2.2. By Application 14.3.2.3. By End-use 14.4. Mexico 14.4.1. Pricing Analysis 14.4.2. Market Share Analysis, 2022 14.4.2.1. By Product 14.4.2.2. By Application 14.4.2.3. By End-use 14.5. UK 14.5.1. Pricing Analysis 14.5.2. Market Share Analysis, 2022 14.5.2.1. By Product 14.5.2.2. By Application 14.5.2.3. By End-use 14.6. Spain 14.6.1. Pricing Analysis 14.6.2. Market Share Analysis, 2022 14.6.2.1. By Product 14.6.2.2. By Application 14.6.2.3. By End-use 14.7. Germany 14.7.1. Pricing Analysis 14.7.2. Market Share Analysis, 2022 14.7.2.1. By Product 14.7.2.2. By Application 14.7.2.3. By End-use 14.8. Italy 14.8.1. Pricing Analysis 14.8.2. Market Share Analysis, 2022 14.8.2.1. By Product 14.8.2.2. By Application 14.8.2.3. By End-use 14.9. France 14.9.1. Pricing Analysis 14.9.2. Market Share Analysis, 2022 14.9.2.1. By Product 14.9.2.2. By Application 14.9.2.3. By End-use 14.10. India 14.10.1. Pricing Analysis 14.10.2. Market Share Analysis, 2022 14.10.2.1. By Product 14.10.2.2. By Application 14.10.2.3. By End-use 14.11. China 14.11.1. Pricing Analysis 14.11.2. Market Share Analysis, 2022 14.11.2.1. By Product 14.11.2.2. By Application 14.11.2.3. By End-use 14.12. Japan 14.12.1. Pricing Analysis 14.12.2. Market Share Analysis, 2022 14.12.2.1. By Product 14.12.2.2. By Application 14.12.2.3. By End-use 14.13. Australia & New Zealand 14.13.1. Pricing Analysis 14.13.2. Market Share Analysis, 2022 14.13.2.1. By Product 14.13.2.2. By Application 14.13.2.3. By End-use 14.14. South Africa 14.14.1. Pricing Analysis 14.14.2. Market Share Analysis, 2022 14.14.2.1. By Product 14.14.2.2. By Application 14.14.2.3. By End-use 14.15. GCC Countries 14.15.1. Pricing Analysis 14.15.2. Market Share Analysis, 2022 14.15.2.1. By Product 14.15.2.2. By Application 14.15.2.3. By End-use 15. Market Structure Analysis 15.1. Competition Dashboard 15.2. Competition Benchmarking 15.3. Market Share Analysis of Top Players 15.3.1. By Regional 15.3.2. By Product 15.3.3. By Application 15.3.4. By End-use 16. Competition Analysis 16.1. Competition Deep Dive 16.1.1. Aerin Medical 16.1.1.1. Overview 16.1.1.2. Product Portfolio 16.1.1.3. Profitability by Market Segments 16.1.1.4. Sales Footprint 16.1.1.5. Strategy Overview 16.1.1.5.1. Marketing Strategy 16.1.2. BMC Medical Co., Ltd. 16.1.2.1. Overview 16.1.2.2. Product Portfolio 16.1.2.3. Profitability by Market Segments 16.1.2.4. Sales Footprint 16.1.2.5. Strategy Overview 16.1.2.5.1. Marketing Strategy 16.1.3. CareFusion Corporation 16.1.3.1. Overview 16.1.3.2. Product Portfolio 16.1.3.3. Profitability by Market Segments 16.1.3.4. Sales Footprint 16.1.3.5. Strategy Overview 16.1.3.5.1. Marketing Strategy 16.1.4. Covidien Plc 16.1.4.1. Overview 16.1.4.2. Product Portfolio 16.1.4.3. Profitability by Market Segments 16.1.4.4. Sales Footprint 16.1.4.5. Strategy Overview 16.1.4.5.1. Marketing Strategy 16.1.5. Drägerwerk AG & Co. KGaA 16.1.5.1. Overview 16.1.5.2. Product Portfolio 16.1.5.3. Profitability by Market Segments 16.1.5.4. Sales Footprint 16.1.5.5. Strategy Overview 16.1.5.5.1. Marketing Strategy 16.1.6. Fisher & Paykel Healthcare Limited 16.1.6.1. Overview 16.1.6.2. Product Portfolio 16.1.6.3. Profitability by Market Segments 16.1.6.4. Sales Footprint 16.1.6.5. Strategy Overview 16.1.6.5.1. Marketing Strategy 16.1.7. GE Healthcare 16.1.7.1. Overview 16.1.7.2. Product Portfolio 16.1.7.3. Profitability by Market Segments 16.1.7.4. Sales Footprint 16.1.7.5. Strategy Overview 16.1.7.5.1. Marketing Strategy 16.1.8. Hamilton Medical 16.1.8.1. Overview 16.1.8.2. Product Portfolio 16.1.8.3. Profitability by Market Segments 16.1.8.4. Sales Footprint 16.1.8.5. Strategy Overview 16.1.8.5.1. Marketing Strategy 16.1.9. Invacare Corporation 16.1.9.1. Overview 16.1.9.2. Product Portfolio 16.1.9.3. Profitability by Market Segments 16.1.9.4. Sales Footprint 16.1.9.5. Strategy Overview 16.1.9.5.1. Marketing Strategy 16.1.10. Koninklijke Philips N.V. 16.1.10.1. Overview 16.1.10.2. Product Portfolio 16.1.10.3. Profitability by Market Segments 16.1.10.4. Sales Footprint 16.1.10.5. Strategy Overview 16.1.10.5.1. Marketing Strategy 16.1.11. Medtronic 16.1.11.1. Overview 16.1.11.2. Product Portfolio 16.1.11.3. Profitability by Market Segments 16.1.11.4. Sales Footprint 16.1.11.5. Strategy Overview 16.1.11.5.1. Marketing Strategy 16.1.12. Nidek Medical Products, Inc. 16.1.12.1. Overview 16.1.12.2. Product Portfolio 16.1.12.3. Profitability by Market Segments 16.1.12.4. Sales Footprint 16.1.12.5. Strategy Overview 16.1.12.5.1. Marketing Strategy 16.1.13. Teleflex Incorporated 16.1.13.1. Overview 16.1.13.2. Product Portfolio 16.1.13.3. Profitability by Market Segments 16.1.13.4. Sales Footprint 16.1.13.5. Strategy Overview 16.1.13.5.1. Marketing Strategy 16.1.14. Smiths Medical 16.1.14.1. Overview 16.1.14.2. Product Portfolio 16.1.14.3. Profitability by Market Segments 16.1.14.4. Sales Footprint 16.1.14.5. Strategy Overview 16.1.14.5.1. Marketing Strategy 17. Assumptions & Acronyms Used 18. Research Methodology
Explore Healthcare Insights
View Reports