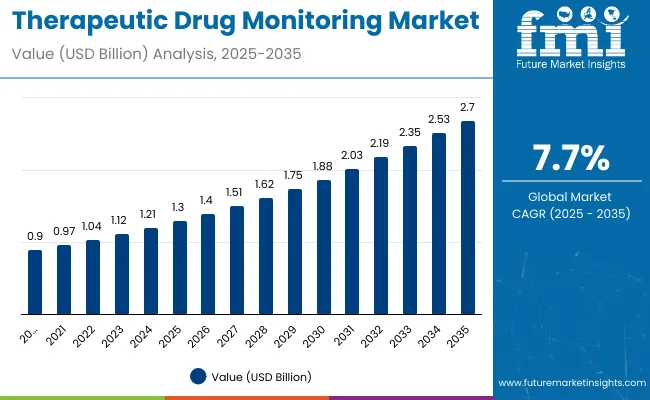
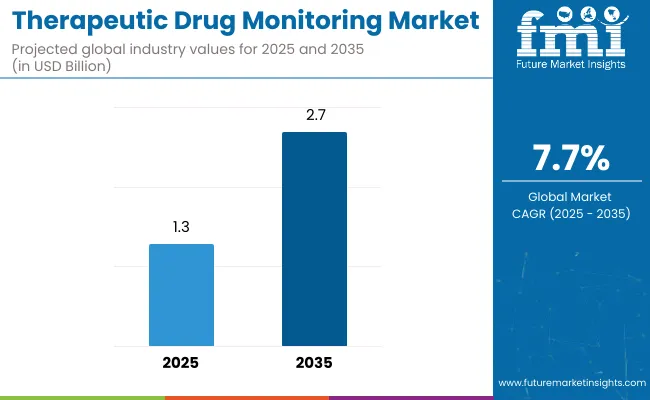
The therapeutic drug monitoring (TDM) market is estimated to be valued at USD 1.3 billion in 2025 and is projected to reach USD 2.7 billion by 2035, registering a compound annual growth rate (CAGR) of 7.7%. The market is projected to add an absolute dollar opportunity of USD 1.4 billion over the forecast period.
| Metric | Value |
|---|---|
| Market Value (2025) | USD 1.3 billion |
| Market Value (2035) | USD 2.7 billion |
| CAGR (2025 to 2035) | 7.7% |
This reflects a 2.08 times growth at a compound annual growth rate of 7.7%. The market’s evolution is expected to be shaped by increasing demand for personalized medicine, rising prevalence of chronic diseases requiring long-term drug therapy, and growing awareness of drug toxicity and therapeutic efficacy, particularly in oncology, psychiatry, and transplant care settings.
By 2030, the market is projected to reach nearly USD 1.88 billion, highlighting solid mid-term growth. This progression reflects expanding applications in hospitals, diagnostic laboratories, and pharmaceutical companies. Innovations in immunoassay and chromatography techniques, along with gradual adoption in emerging regions, support sustained market resilience.
Over 2025 to 2035, the sector is poised to achieve an absolute growth of about USD 1.4 billion, underscoring consistent reliance on therapeutic drug monitoring to enhance treatment outcomes, patient safety, and personalized healthcare globally.
Leading companies such as Abbott Laboratories, Thermo Fisher Scientific Inc., F. Hoffmann-La Roche Ltd., Siemens Healthineers AG, and Bio-Rad Laboratories, Inc. are consolidating their positions by strengthening product portfolios and advancing next-generation therapeutic drug monitoring technologies.
Their focus includes enhanced immunoassay platforms, liquid chromatography-tandem mass spectrometry (LC-MS/MS) techniques, and software solutions for precision pharmacotherapy. These innovations minimize testing errors, improve sensitivity, and enable rapid, accurate drug level quantification, facilitating stronger market penetration across developed healthcare systems and emerging regions.
The market holds a critical position in personalized medicine and chronic disease management, capturing demand primarily from antiepileptic and immunosuppressant drug monitoring, which account for significant shares due to their narrow therapeutic windows and critical dosing requirements.
Reagents and consumables, which represent more than 70% of product usage, are central to laboratory workflows for maintaining high accuracy and repeatability. This sector contributes substantially to the broader in-vitro diagnostics landscape, driven by consistent clinical need, advances in assay technology, and increasing adoption of TDM in emerging healthcare markets.
The market is evolving with innovations like multiplex assays, point-of-care testing, and integrated software analytics that enhance precision, reduce turnaround times, and improve patient outcomes. Companies are strengthening their portfolios with smarter, automated TDM systems aimed at minimizing human error and enabling real-time therapeutic adjustments.
Strategic collaborations with hospitals, diagnostic laboratories, pharmaceutical companies, and research institutes are reshaping accessibility and positioning advanced therapeutic drug monitoring solutions as essential components for personalized therapy optimization worldwide.
The therapeutic drug monitoring (TDM) market is growing due to several key factors driving demand and adoption globally. A primary driver is the increasing emphasis on personalized medicine and precision pharmacotherapy. TDM enables healthcare providers to tailor drug dosages based on individual patient metabolism and response, reducing adverse drug reactions and optimizing therapeutic outcomes. This is particularly critical for drugs with narrow therapeutic windows, such as antiepileptics and immunosuppressants, boosting market need.
Technological advancements contribute significantly to market expansion. Innovations in immunoassay platforms, liquid chromatography-mass spectrometry (LC-MS/MS), and automated testing have enhanced accuracy, sensitivity, and turnaround times. These developments facilitate broader clinical adoption and integration into routine patient care, expanding market penetration across hospitals, diagnostic labs, and pharmaceutical research.
The rising prevalence of chronic diseases requiring long-term drug management, including epilepsy, cancer, autoimmune disorders, and organ transplants, further fuels demand. Growing awareness among clinicians and patients about the benefits of TDM for maintaining therapeutic efficacy supports increased testing volumes.
The market is segmented by product, application, form, and region. By product, the market is bifurcated into natural antioxidants and synthetic antioxidants. Based on application, the market is categorized into fats & oils, snacks & dairy, bakery & confectionery, meat products, beverages, seafood, and others (processed foods and sauces). In terms of form, the market is divided into dry and liquid. Regionally, the market is classified into North America, Latin America, Europe, Asia Pacific, and the Middle East & Africa (MEA).
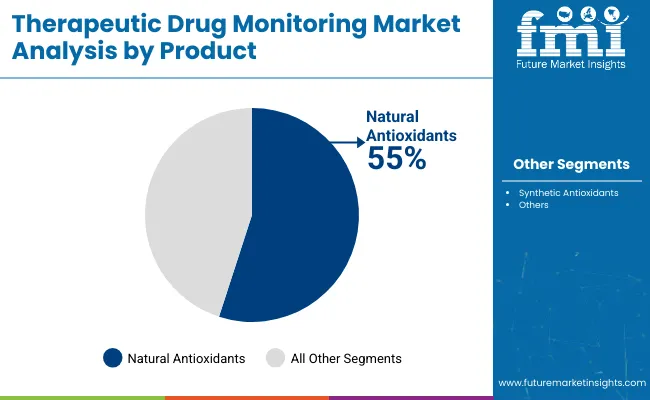
The most lucrative segment in the antioxidants market by product is Natural Antioxidants, commanding 55% market share as of the latest analyses. This dominance is fueled by increasing consumer preference for clean-label, health-promoting, and sustainable ingredients across food, beverage, cosmetic, and pharmaceutical applications.
Natural antioxidants such as Vitamin C, Vitamin E, polyphenols, carotenoids, and flavonoids are highly prized for their efficacy in combating oxidative stress and enhancing overall health. Growing awareness of the adverse effects related to synthetic additives also propels this segment’s expansion.
Furthermore, stringent government regulations favoring natural over synthetic ingredients for food safety and cosmetics propel demand. Key growth drivers include rising demand in emerging markets, increased incorporation in functional foods and nutraceuticals, and widespread adoption within organic product lines.
Companies continuously innovate extraction and formulation technologies, enhancing natural antioxidants’ bioavailability and effectiveness, driving higher market traction. Consequently, natural antioxidants present significant profit margins and sustainable growth opportunities compared to synthetic counterparts, consolidating their position as the most lucrative product segment in the market.
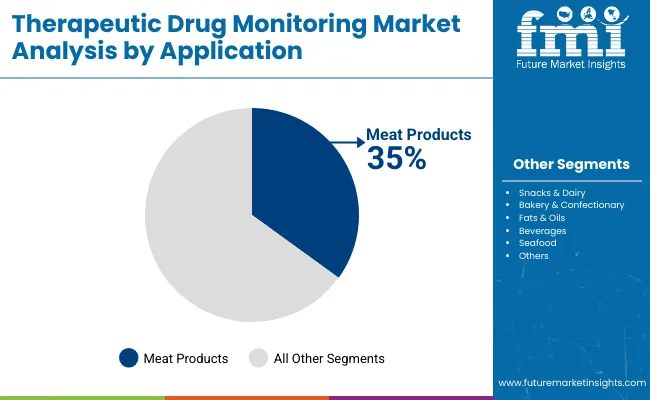
The meat products segment is the leading application in the antioxidants market, holding 35% of the market share. This dominance is primarily due to the high susceptibility of meat to oxidative degradation, which leads to spoilage, off-flavors, discoloration, and reduced shelf life.
Antioxidants play a crucial role in preserving the quality, freshness, and safety of meat products by inhibiting lipid oxidation and microbial growth. As consumer preference for high-quality, fresh, and minimally processed meat products rises, the demand for natural and effective antioxidants in this segment increases.
Additionally, the growing global meat consumption, particularly in emerging economies, drives the incorporation of antioxidants to meet food safety regulations and extend product shelf stability during storage and transportation. Innovations in natural antioxidant extracts specifically tailored for meat applications, such as rosemary and tocopherols, further strengthen this segment’s position. Overall, the meat products segment remains highly lucrative and strategic for antioxidant manufacturers due to its ongoing need for preservation and improving consumer trust in meat quality.
The market from 2025 to 2035 is driven by the growing prevalence of chronic diseases requiring precise drug dosing, increasing demand for personalized medicine, and expanding healthcare infrastructure worldwide. Technological advancements such as automated immunoassays, liquid chromatography-mass spectrometry (LC-MS/MS), and multiplex testing platforms are enhancing accuracy and efficiency, encouraging wider clinical adoption. Increasing access in emerging regions like India and China supports market expansion.
Health Awareness and Clinical Innovation Boost Therapeutic Drug Monitoring Market Growth
Rising awareness among healthcare professionals and patients about the importance of drug level monitoring to optimize therapy and reduce adverse drug reactions is a key driver of the TDM market. Innovations in rapid, sensitive, and automated diagnostic platforms improve patient outcomes by enabling timely therapeutic adjustments. The growing use of TDM in oncology, immunosuppressive therapy, and neurological disorders further fuels market growth.
Innovation and Sustainability Expanding Therapeutic Drug Monitoring Market Opportunities
Innovation in TDM technology is broadening market opportunities beyond traditional assay methods. Advances include point-of-care testing, multiplex assays, integrated software analytics, and high-throughput platforms that enhance precision and reduce turnaround times. Manufacturers emphasize quality standards, regulatory compliance, and sustainable manufacturing processes that resonate with healthcare providers. These innovations support personalized treatment approaches and long-term patient management, fostering sustained market growth and resilience.
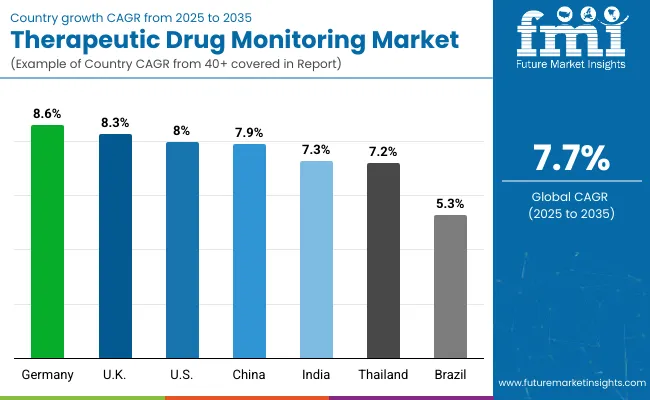
| Country | CAGR (%) |
|---|---|
| Germany | 8.6 |
| United Kingdom | 8.3 |
| United States | 8.0 |
| China | 7.9 |
| India | 7.3 |
| Thailand | 7.2 |
| Brazil | 5.3 |
The market shows varied growth across countries influenced by healthcare infrastructure and government support. Germany leads with an 8.6% CAGR due to advanced systems and strong regulations. The United States follows at 8%, driven by high healthcare spending and reimbursement policies.
The UK grows at 8.3%, supported by NHS initiatives and digital healthcare investments. China and India expand rapidly at 7.9% and 7.3%, respectively, fueled by increased healthcare access and chronic disease prevalence. Thailand’s 7.2% growth is backed by healthcare reforms, while Brazil shows steady 5.3% growth despite cost and access challenges.
The report covers an in-depth analysis of 40+ countries; seven top-performing OECD countries are highlighted below.
Revenue from therapeutic drug monitoring in Germany is projected to grow at a robust CAGR of 8.6%, making it a leading market due to its advanced healthcare infrastructure and strong emphasis on personalized medicine. The country benefits from supportive regulatory frameworks encouraging integration of TDM in clinical practice.
Collaborations between pharmaceutical companies and diagnostic technology providers enhance innovation and market penetration. High healthcare expenditure and aging population drive demand for precise drug dosing and monitoring. Germany’s robust R&D ecosystem accelerates development of next-generation TDM assays and platforms.
Hospitals increasingly adopt automated and sensitive testing technologies to improve patient outcomes. Government initiatives promote safer drug therapies and personalized treatment approaches. These factors collectively fuel steady growth and position Germany as a key player in the global TDM landscape.
Revenue from therapeutic drug monitoring in the United Kingdom exhibits strong growth with an impressive CAGR of 8.3%, propelled by national health policies favoring personalized medicine. NHS programs encourage widespread adoption of TDM across hospital and outpatient settings, improving clinical decision-making. Continuous investments in diagnostic infrastructure and digital healthcare solutions boost market accessibility.
The UK’s focus on clinical guidelines for accurate drug dosing enhances test volumes and reliability. Public-private partnerships foster innovation in assay development and automation. Rising awareness of adverse drug reactions drives routine monitoring uptake. Expanding diagnostic laboratories specializing in TDM support the market’s solid expansion. These factors position the UK as a growth leader within the evolving TDM market.
Demand for therapeutic drug monitoring in India is projected to grow rapidly at a CAGR of 7.3%, is growing rapidly amid expanding healthcare infrastructure and increasing prevalence of chronic diseases. The growing affordability of diagnostic testing and rising government healthcare initiatives increase market penetration beyond metropolitan areas. Clinician awareness of TDM benefits in optimizing therapy is steadily strengthening.
The pharmaceutical sector’s expansion and rise in clinical trials stimulate demand for precise drug monitoring solutions. Urbanization accelerates healthcare access improvement in tier 2 and 3 cities. Diagnostic service providers are broadening their portfolios with innovative TDM assays. Educational campaigns and training enhance acceptance among healthcare professionals. Together, these drivers support sustained growth in India’s TDM landscape.
Demand for therapeutic drug monitoring in Thailand advances with a CAGR of 7.2% steadily backed by healthcare reforms and increased diagnostic investments. The efforts to improve patient safety and medication effectiveness drive TDM demand across public and private sectors. Growth in private diagnostic labs broadens regional coverage and accessibility.
Government reimbursement schemes encourage wider adoption of monitoring tests. Collaborative ties with international technology providers enable transfer of advanced assay platforms. Awareness campaigns educate clinicians and patients on personalized medicine benefits. Expansion of chronic disease management programs boosts monitoring frequency. These elements collectively foster innovation and market progression in Thailand’s TDM sector.
Demand for therapeutic drug monitoring in Brazil with a CAGR of 5.3%, demonstrates consistent but moderated growth influenced by expanding healthcare coverage and modernization of diagnostic facilities. The national healthcare programs focus on better management of chronic illnesses, encouraging drug monitoring adoption. Urban healthcare infrastructure upgrades improve access to testing services.
Pharmaceutical R&D activities, including clinical trials, drive demand for TDM assays. Cost constraints and disparities in rural healthcare delivery pose challenges. Despite these, partnerships with global diagnostic providers enhance technology availability. Increased awareness among clinicians supports gradual market expansion. Brazil’s market is poised for steady growth amid ongoing healthcare reforms and infrastructure development.
Revenue from therapeutic drug monitoring in the United States remains the largest globally, with a robust CAGR of 8%, supported by rapid adoption of advanced diagnostic technologies. Strong reimbursement policies and high healthcare spending enable widespread use of TDM in managing chronic and transplant patients. Precision medicine initiatives highlight the necessity of accurate drug level monitoring to avoid toxicity and improve outcomes.
Investment in high-throughput, automated assay platforms increases testing efficiency. Extensive clinical research supports continuous innovation in assay development. Collaboration between pharmaceutical companies and diagnostic labs fosters new solutions. Rising chronic disease prevalence drives growing test volumes. The USA market continues to lead globally in technology sophistication and market size.
Rapid Expansion in Therapeutic Drug Monitoring Market in China
Revenue from therapeutic drug monitoring in China experiences rapid growth, with a CAGR of 7.9%, fueled by expanding healthcare infrastructure and government support for innovation. Increasing burden of chronic diseases and growing precision medicine adoption drive demand for TDM services. Investments in domestic diagnostic technology manufacturing and partnerships with global companies accelerate market development.
Urban population growth improves healthcare accessibility and testing volume. Reimbursement reforms facilitate affordability and wider test adoption. Increased focus on drug safety and efficacy reinforces TDM integration within healthcare protocols. Growing awareness among clinicians and patients enhances market traction. These factors collectively propel China’s therapeutic drug monitoring sector forward.
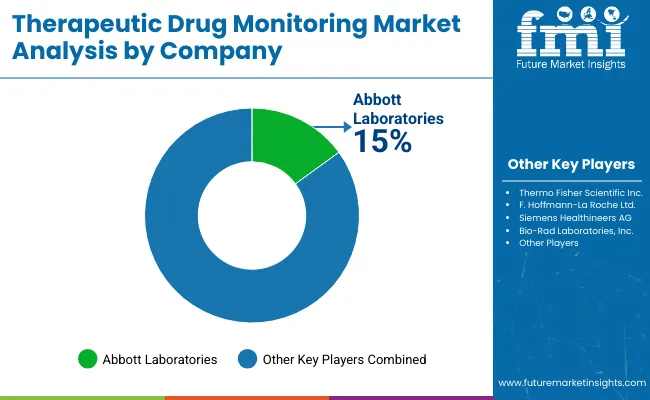
The competitive landscape of the market is characterized by the presence of several global and regional players focusing on innovation, strategic partnerships, and portfolio expansion to maintain and grow market share. Leading companies such as Abbott Laboratories, Thermo Fisher Scientific Inc., F. Hoffmann-La Roche Ltd., Siemens Healthineers AG, and Bio-Rad Laboratories, Inc. dominate the market with advanced diagnostic platforms, including automated immunoassays and liquid chromatography-mass spectrometry (LC-MS/MS) systems.
These companies are investing heavily in research and development to introduce next-generation testing technologies that improve sensitivity, speed, and ease of use. Strategic collaborations and partnerships with hospitals, diagnostic labs, and pharmaceutical firms enable broader market penetration and adoption of TDM solutions. In addition, companies focus on geographic expansion, particularly in emerging markets, to capitalize on rising healthcare infrastructure and growing demand for personalized medicine.
| Items | Values |
|---|---|
| Quantitative Units (2025) | USD 1.3 billion |
| Product | Natural Antioxidants and Synthetic Antioxidants |
| Application | Fats & Oils, Snacks & Dairy, Bakery & Confectionary, Meat Products, Beverages, Seafood |
| Form | Dry and Liquid |
| Regions Covered | North America, Europe, Asia Pacific, Latin America, Middle East & Africa |
| Countries Covered | United States, Canada, United Kingdom, Germany, France, China, India, Japan, Brazil, Australia, and 40+ countries |
| Key Companies Profiled | Archer Daniels Midland Company, Eastman Chemical Company, Koninklijke DSM N.V., Kemin Industries, Inc., Camlin Fine Sciences, Ltd., Barentz Group, Kalsec Inc., and BASF SE. |
| Additional Attributes | Revenue by product type and drug category; regional demand trends; competitive landscape; adoption of automated and multiplex testing platforms; personalized medicine expansion; chronic disease prevalence; advancements in point-of-care testing technologies |
The global therapeutic drug monitoring market is estimated to be valued at USD 1.3 billion in 2025.
The market size for therapeutic drug monitoring is projected to reach USD 2.7 billion by 2035.
The therapeutic drug monitoring market is expected to grow at a 7.7% CAGR between 2025 and 2035.
Natural antioxidants are projected to lead in the therapeutic drug monitoring market with 55% market share in 2025.
In terms of application, meat products segment is projected to command 35% share in the therapeutic drug monitoring market in 2025.


Our Research Products

The "Full Research Suite" delivers actionable market intel, deep dives on markets or technologies, so clients act faster, cut risk, and unlock growth.

The Leaderboard benchmarks and ranks top vendors, classifying them as Established Leaders, Leading Challengers, or Disruptors & Challengers.

Locates where complements amplify value and substitutes erode it, forecasting net impact by horizon

We deliver granular, decision-grade intel: market sizing, 5-year forecasts, pricing, adoption, usage, revenue, and operational KPIs—plus competitor tracking, regulation, and value chains—across 60 countries broadly.

Spot the shifts before they hit your P&L. We track inflection points, adoption curves, pricing moves, and ecosystem plays to show where demand is heading, why it is changing, and what to do next across high-growth markets and disruptive tech

Real-time reads of user behavior. We track shifting priorities, perceptions of today’s and next-gen services, and provider experience, then pace how fast tech moves from trial to adoption, blending buyer, consumer, and channel inputs with social signals (#WhySwitch, #UX).

Partner with our analyst team to build a custom report designed around your business priorities. From analysing market trends to assessing competitors or crafting bespoke datasets, we tailor insights to your needs.
Supplier Intelligence
Discovery & Profiling
Capacity & Footprint
Performance & Risk
Compliance & Governance
Commercial Readiness
Who Supplies Whom
Scorecards & Shortlists
Playbooks & Docs
Category Intelligence
Definition & Scope
Demand & Use Cases
Cost Drivers
Market Structure
Supply Chain Map
Trade & Policy
Operating Norms
Deliverables
Buyer Intelligence
Account Basics
Spend & Scope
Procurement Model
Vendor Requirements
Terms & Policies
Entry Strategy
Pain Points & Triggers
Outputs
Pricing Analysis
Benchmarks
Trends
Should-Cost
Indexation
Landed Cost
Commercial Terms
Deliverables
Brand Analysis
Positioning & Value Prop
Share & Presence
Customer Evidence
Go-to-Market
Digital & Reputation
Compliance & Trust
KPIs & Gaps
Outputs
Full Research Suite comprises of:
Market outlook & trends analysis
Interviews & case studies
Strategic recommendations
Vendor profiles & capabilities analysis
5-year forecasts
8 regions and 60+ country-level data splits
Market segment data splits
12 months of continuous data updates
DELIVERED AS:
PDF EXCEL ONLINE
Anticoagulant Therapeutic Drug Monitoring Assay Kits Market
Therapeutic Robots Market Size and Share Forecast Outlook 2025 to 2035
Therapeutic Apheresis Market Analysis - Size, Share, and Forecast Outlook 2025 to 2035
Therapeutic Respiratory Devices Market Overview - Trends & Forecast 2025 to 2035
Therapeutic Contact Lenses Market Report - Trends, Demand & Outlook 2025 to 2035
Therapeutic Diet for Pet Market Analysis by Age Group, Health Condition, Distribution Channel and Others Through 2035
Therapeutic Hair Oil Market Insights - Size, Trends & Forecast 2025 to 2035
Therapeutic Nuclear Medicine Market Analysis – Size, Share & Forecast 2024-2034
Biotherapeutics Virus Removal Filters Market Trends – Growth & Forecast 2025 to 2035
Pain Therapeutic Injectables Market Size and Share Forecast Outlook 2025 to 2035
Pain Therapeutic Solutions Market Size and Share Forecast Outlook 2025 to 2035
COPD Therapeutics Market Report – Growth, Demand & Industry Forecast 2023-2033
Psychotherapeutic Combinations Market Analysis - Size, Share, and Forecast Outlook 2025 to 2035
Sinus Therapeutic Drugs Market – Trends, Growth & Forecast 2022-2032
Digital Therapeutics and Wellness Market Size and Share Forecast Outlook 2025 to 2035
Digital Therapeutics Market Size and Share Forecast Outlook 2025 to 2035
At-Home Therapeutic Beauty Devices Market Analysis - Size, Share, and Forecast Outlook 2025 to 2035
Elastic Therapeutic Tape Market Growth – Trends & Forecast 2025 to 2035
Peptide Therapeutics Market Analysis - Growth & Forecast 2024 to 2034
Advanced Therapeutics Pharmaceutical Outsourcing Market Size and Share Forecast Outlook 2025 to 2035

Thank you!
You will receive an email from our Business Development Manager. Please be sure to check your SPAM/JUNK folder too.
Chat With
MaRIA