Psychotherapeutic Combinations Market Forecast and Outlook 2025 to 2035

The global psychotherapeutic combinations market is projected to grow from USD 805.6 million in 2025 to approximately USD 1,376.1 million by 2035, recording an absolute increase of USD 570.5 million over the forecast period. This translates into a total growth of 70.8%, with the market forecast to expand at a compound annual growth rate (CAGR) of 5.5% between 2025 and 2035.
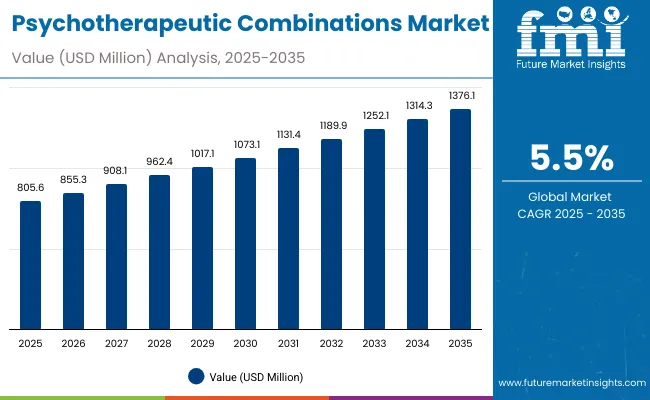
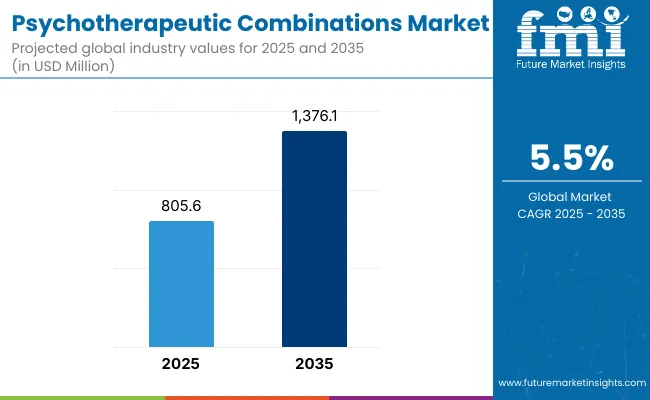
Psychotherapeutic Combinations Market Value Analysis

  • Psychotherapeutic Combinations Market Value (2025): USD 805.6 million
  • Psychotherapeutic Combinations Market Forecast Value (2035): USD 1,376.1 million
  • Psychotherapeutic Combinations Market Forecast CAGR: 5.5%
  • Leading Drug Class in Psychotherapeutic Combinations Market: Antidepressant + Antipsychotic (46.7%)
  • Key Growth Regions in Psychotherapeutic Combinations Market: North America, Europe, and Asia Pacific
  • Top Key Players in Psychotherapeutic Combinations Market: Eli Lilly and Company, Teva Pharmaceutical, Alkermes plc, Bristol Myers Squibb, Zai Lab, Merck & Co., Remedy Repack Inc., Dr. Reddy's Laboratories, Sun Pharma, Micro Labs

Psychotherapeutic Combinations Market

Psychotherapeutic Combinations Market Key Takeaways

Metric Value
Estimated Value in (2025E) USD 805.6 million
Forecast Value in (2035F) USD 1,376.1 million
Forecast CAGR (2025 to 2035) 5.5%

The overall market size is expected to grow by nearly 1.7X during the same period, supported by increasing prevalence of complex psychiatric disorders, rising demand for combination therapies, and growing focus on treatment-resistant mental health conditions.

Quick Stats for Psychotherapeutic Combinations Market

Between 2025 and 2030, the psychotherapeutic combinations market is projected to expand from USD 805.6 million to USD 1,052.9 million, resulting in a value increase of USD 247.3 million, which represents 43.3% of the total forecast growth for the decade.

This phase of growth will be shaped by rising awareness about mental health treatment options, increasing demand for personalized therapeutic approaches, and growing penetration of combination therapies in emerging markets. Pharmaceutical companies are expanding their psychotherapeutic combination portfolios to address the growing demand for effective treatment solutions for complex psychiatric conditions.

From 2030 to 2035, the market is forecast to grow from USD 1,052.9 million to USD 1,376.1 million, adding another USD 323.2 million, which constitutes 56.7% of the overall ten-year expansion. This period is expected to be characterized by expansion of specialized pharmacy channels, integration of digital health platforms with combination therapy management, and development of personalized treatment protocols.

The growing adoption of evidence-based medicine and healthcare provider recommendations will drive demand for clinically proven psychotherapeutic combinations with enhanced efficacy and safety profiles.

Between 2020 and 2025, the psychotherapeutic combinations market experienced steady expansion, driven by increasing recognition of treatment-resistant psychiatric conditions and growing acceptance of combination therapy approaches.

The market developed as healthcare providers recognized the need for comprehensive treatment solutions to address complex mental health disorders. Clinical research and regulatory approvals began emphasizing the importance of combination therapies in achieving better patient outcomes for challenging psychiatric conditions.

Why is the Psychotherapeutic Combinations Market Growing?

Market expansion is being supported by the increasing prevalence of treatment-resistant psychiatric disorders and the corresponding demand for more effective therapeutic approaches. Modern healthcare providers are increasingly focused on combination therapies that can address multiple symptoms simultaneously, improve treatment adherence, and reduce the burden of polypharmacy.

The proven efficacy of specific drug combinations in treating complex conditions like schizophrenia, major depressive disorder, and bipolar disorder makes them essential components of comprehensive psychiatric treatment plans.

The growing emphasis on personalized medicine and precision psychiatry is driving demand for tailored combination therapies that address individual patient needs and genetic profiles. Healthcare provider preference for simplified medication regimens that combine multiple active ingredients in single formulations is creating opportunities for innovative drug development.

The rising influence of clinical guidelines and evidence-based treatment protocols is also contributing to increased adoption of proven psychotherapeutic combinations across different patient populations and therapeutic areas.

Segmental Analysis

The market is segmented by drug class, indication, sales channel, and region. By drug class, the market is divided into antidepressant + antipsychotic, antipsychotic + opioid receptor modulator, antidepressant + benzodiazepine, antidepressant + stimulant, antipsychotic + anticholinergic/muscarinic modulator, and others/emerging classes.

Based on indication, the market is categorized into schizophrenia, major depressive disorder, bipolar disorder, agitation, and other indications. In terms of sales channel, the market is segmented into retail pharmacies, hospital pharmacies, drug stores, and e-commerce pharmacy. Regionally, the market is divided into North America, Europe, East Asia, South Asia & Pacific, Latin America, and Middle East & Africa.
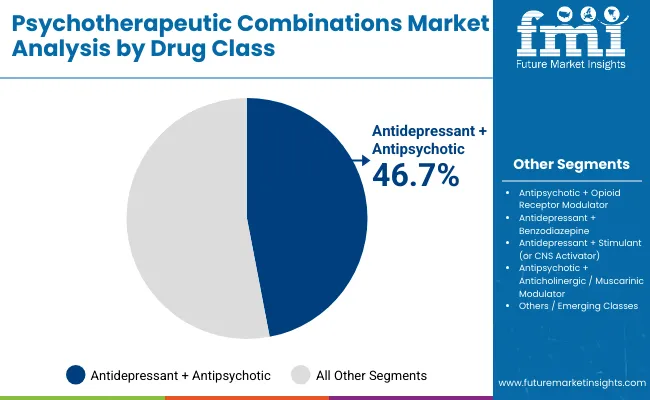
By Drug Class, Antidepressant + Antipsychotic Segment Accounts for 46.7% Market Share

Psychotherapeutic Combinations Market By Drug Class

The antidepressant + antipsychotic combination is projected to account for 46.7% of the psychotherapeutic combinations market in 2025, reaffirming its position as the category's dominant drug class. Healthcare providers increasingly recognize the synergistic benefits of combining antidepressant and antipsychotic medications for treating complex psychiatric conditions, particularly treatment-resistant depression with psychotic features and certain bipolar disorders. This combination addresses both mood symptoms and psychotic manifestations, providing comprehensive therapeutic coverage.

This drug class forms the foundation of most treatment protocols for severe mental health conditions, as it represents the most clinically validated and widely accepted combination approach in psychiatry. Regulatory approvals and extensive clinical research continue to strengthen confidence in these formulations.

With increasing recognition of the complexity of psychiatric disorders requiring multi-targeted approaches, antidepressant + antipsychotic combinations align with both acute treatment and long-term management goals. Their broad therapeutic utility across multiple indications ensures sustained market dominance, making them the central growth driver of psychotherapeutic combination demand.
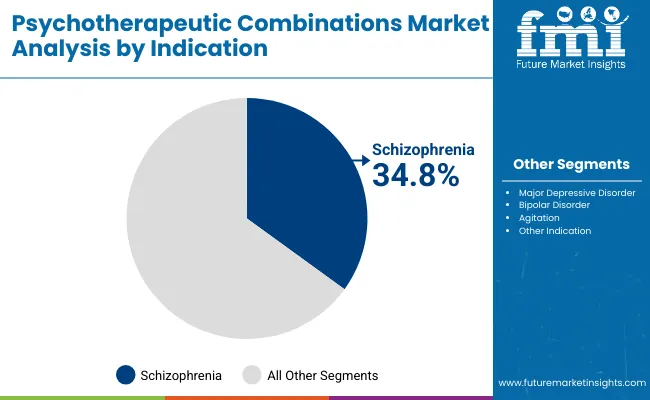
By Indication, Schizophrenia Segment Accounts for 34.8% Market Share

Psychotherapeutic Combinations Market By Indication

Schizophrenia is projected to represent 34.8% of psychotherapeutic combinations demand in 2025, underscoring its role as the primary indication driving combination therapy adoption. Healthcare providers recognize that schizophrenia's complex symptomatology, including positive symptoms, negative symptoms, and cognitive impairments, often requires multi-modal treatment approaches that single-agent therapies cannot adequately address. Combination therapies offer enhanced efficacy in managing treatment-resistant cases and reducing relapse rates.

The segment is supported by the chronic nature of schizophrenia requiring long-term therapeutic management and the growing recognition that combination approaches can improve patient compliance and quality of life. Additionally, healthcare systems are increasingly adopting evidence-based treatment guidelines that recommend specific combinations for optimal outcomes. As clinical understanding of schizophrenia's neurobiological complexity advances, combination therapies will continue to play a crucial role in comprehensive treatment strategies, reinforcing their essential position within the psychotherapeutic market.
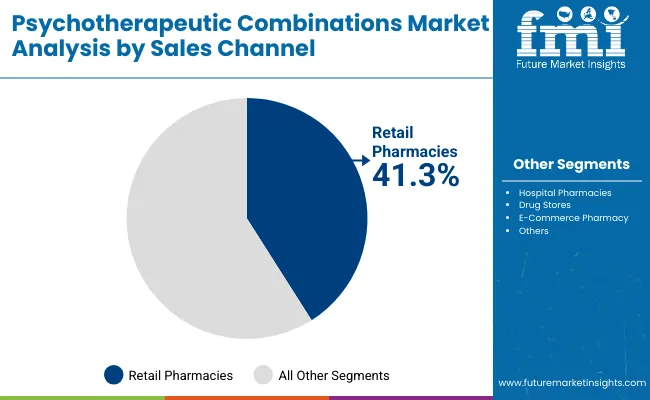
By Sales Channel, Retail Pharmacies Segment Accounts for 41.3% Market Share

Psychotherapeutic Combinations Market By Sales Channel

The retail pharmacies channel is forecasted to contribute 41.3% of the psychotherapeutic combinations market in 2025, reflecting the primary role of community pharmacies in psychiatric medication dispensing and patient care.

Patients with chronic psychiatric conditions rely on accessible, convenient pharmacy services for ongoing medication management, making retail pharmacies the cornerstone of psychotherapeutic combination distribution. This channel provides essential services including medication counseling, adherence monitoring, and coordination with healthcare providers.

The segment benefits from established relationships between patients and pharmacists, who provide continuity of care and medication management support. Retail pharmacies also offer advantages in terms of insurance coverage processing, generic substitution options, and patient convenience through extended hours and multiple locations.

With growing emphasis on community-based mental health care and patient-centered pharmacy services, retail pharmacies serve as critical access points for psychotherapeutic combinations, making them fundamental drivers of market accessibility and growth.

What are the Drivers, Restraints, and Key Trends of the Psychotherapeutic Combinations Market?

The psychotherapeutic combinations market is advancing steadily due to increasing recognition of treatment-resistant psychiatric conditions and growing demand for comprehensive therapeutic approaches. However, the market faces challenges including complex regulatory pathways, potential for increased side effects, and concerns about drug interactions. Innovation in combination formulations and personalized treatment protocols continue to influence product development and market expansion patterns.

Expansion of Hospital Pharmacies and Specialty Care Channels

The growing adoption of specialized psychiatric care facilities is enabling more sophisticated combination therapy management and monitoring. Hospital pharmacies offer comprehensive medication management services, including therapeutic drug monitoring and adverse event management, that are particularly important for complex combination regimens. Specialty care channels provide access to psychiatric specialists who can optimize combination therapy selection and dosing.

Integration of Digital Health Platforms and Medication Management Systems

Modern pharmaceutical companies are incorporating digital health technologies such as medication adherence monitoring, electronic prescribing systems, and patient portal integration to enhance combination therapy management. These technologies improve medication compliance, enable real-time monitoring of therapeutic outcomes, and provide better coordination between healthcare providers. Advanced digital platforms also enable personalized dosing recommendations and early identification of potential drug interactions or adverse events.
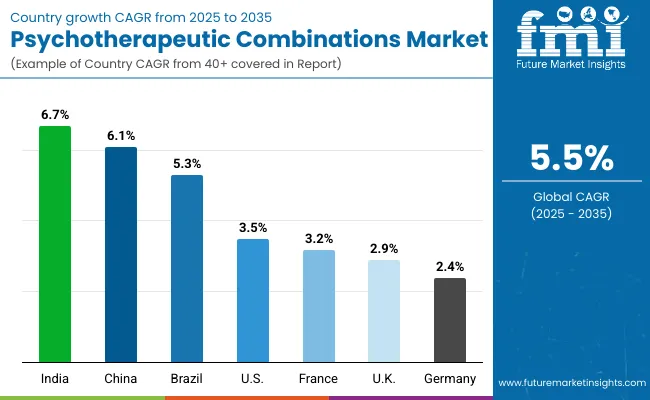
Analysis of Psychotherapeutic Combinations Market by Key Country

Psychotherapeutic Combinations Market Country Wise Analysis

Country CAGR (2025 to 2035)
India 6.7%
China 6.1%
Brazil 5.3%
USA 3.5%
France 3.2%
UK 2.9%
Germany 2.4%

The psychotherapeutic combinations market is experiencing varied growth globally, with India leading at a 6.7% CAGR through 2035, driven by expanding healthcare infrastructure, increasing mental health awareness, and growing access to psychiatric medications. China follows at 6.1%, supported by healthcare system reforms, increasing recognition of mental health importance, and expanding pharmaceutical coverage.

Brazil shows growth at 5.3%, emphasizing improved access to psychiatric care and combination therapy adoption. Europe records 4.0% growth, focusing on evidence-based treatment protocols and comprehensive mental health care systems. The USA shows 3.5% growth, representing a mature market with established treatment patterns and regulatory frameworks.

The report covers an in-depth analysis of 40+ countries; seven top-performing countries are highlighted below.

China Demonstrates Growing Market Potential with Healthcare System Development

Revenue from psychotherapeutic combinations in China is projected to exhibit steady growth with a CAGR of 6.1% through 2035, driven by ongoing healthcare system reforms and increasing recognition of mental health as a priority health issue. The country's expanding healthcare infrastructure and growing availability of specialized psychiatric services are creating significant opportunities for combination therapy adoption. Major international and domestic pharmaceutical companies are establishing comprehensive distribution networks to serve the growing population of patients requiring complex psychiatric treatment across urban and developing regions.

  • Government initiatives supporting mental health care development and insurance coverage expansion are driving demand for evidence-based psychiatric treatments throughout major metropolitan and provincial areas.
  • Healthcare provider education and clinical guideline development are supporting appropriate utilization of combination therapies among psychiatric specialists and primary care providers nationwide.

India Demonstrates Exceptional Market Potential with Healthcare Infrastructure Development

Revenue from psychotherapeutic combinations in India is expanding at a CAGR of 6.7%, supported by increasing healthcare accessibility, growing mental health awareness, and expanding pharmaceutical market presence. The country's large patient population and increasing recognition of psychiatric conditions are driving demand for effective combination therapy solutions. International pharmaceutical companies and domestic manufacturers are establishing distribution channels to serve the growing demand for quality psychiatric medications.
  • Rising awareness about mental health treatment options and reducing stigma are creating opportunities for specialized psychiatric medications across urban and rural healthcare settings.
  • Growing healthcare infrastructure development and insurance coverage expansion are supporting increased access to combination therapies among patients requiring comprehensive psychiatric treatment.

United States Maintains Market Leadership with Established Treatment Protocols

Usa Psychotherapeutic Combinations Market

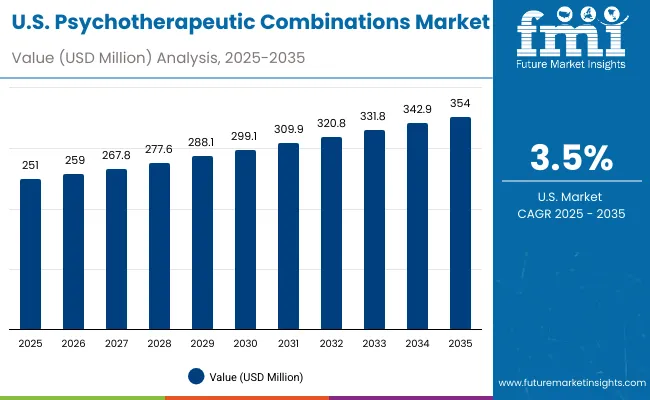
Demand for psychotherapeutic combinations in the USA is projected to grow at a CAGR of 3.5%, supported by well-established psychiatric care systems and evidence-based treatment guidelines. American healthcare providers consistently utilize combination therapies for treatment-resistant conditions and complex psychiatric presentations. The market is characterized by mature treatment protocols, comprehensive insurance coverage, and established relationships between healthcare providers and pharmaceutical companies.

  • Evidence-based treatment guidelines and clinical research are supporting continued utilization of proven combination therapies throughout healthcare systems.
  • Specialty pharmacy networks and managed care organizations are facilitating access to combination therapies while ensuring appropriate utilization and cost management.

Brazil Shows Promising Growth with Healthcare System Expansion

Revenue from psychotherapeutic combinations in Brazil is projected to grow at a CAGR of 5.3% through 2035, driven by healthcare system development, increasing access to psychiatric care, and growing recognition of mental health importance. Brazilian healthcare providers are increasingly adopting combination therapy approaches for complex psychiatric conditions, supported by expanding pharmaceutical market presence and improved treatment accessibility.

  • Public healthcare system development and pharmaceutical access programs are supporting increased availability of combination therapies across diverse patient populations.
  • Growing collaboration between international pharmaceutical companies and local healthcare providers is enhancing treatment options and clinical expertise in combination therapy management.

United Kingdom Demonstrates Stable Growth with NHS Framework Support

Revenue from psychotherapeutic combinations in the UK is projected to grow at a CAGR of 2.9% through 2035, supported by the National Health Service framework and comprehensive evidence-based treatment guidelines that facilitate appropriate use of combination therapies for complex psychiatric conditions. British healthcare providers consistently utilize established protocols for combination therapy management, emphasizing patient outcomes and treatment optimization within integrated care systems.

  • NHS treatment pathways and clinical guidelines are supporting systematic adoption of proven combination therapies across primary care and specialist psychiatric services.
  • Healthcare provider education programs and clinical research initiatives are maintaining high standards for combination therapy utilization and patient safety monitoring.

Germany Anchors Growth with Established Psychiatric Care Infrastructure

Revenue from psychotherapeutic combinations in Germany is projected to grow at a CAGR of 2.4% through 2035, supported by the country's well-established psychiatric care infrastructure, comprehensive healthcare coverage, and systematic approach to mental health treatment. German healthcare providers emphasize evidence-based combination therapy utilization within structured healthcare frameworks that prioritize clinical effectiveness and patient safety.

  • Comprehensive healthcare system coordination and regulatory oversight are supporting stable utilization of combination therapies across diverse healthcare settings and patient populations.
  • Academic medical centers and research institutions are maintaining leadership in combination therapy clinical research and treatment protocol development for optimal patient outcomes.

France Maintains Steady Market Development with Integrated Healthcare Approach

Revenue from psychotherapeutic combinations in France is projected to grow at a CAGR of 3.2% through 2035, supported by the country's comprehensive healthcare system, established psychiatric care infrastructure, and systematic approach to mental health treatment. French healthcare providers emphasize evidence-based combination therapy utilization within integrated care frameworks that prioritize patient outcomes and treatment continuity.
  • Centralized healthcare system coordination and comprehensive pharmaceutical coverage are supporting stable access to combination therapies across diverse patient populations and healthcare settings.
  • Academic medical centers and clinical research institutions are maintaining leadership in combination therapy research and clinical practice guideline development.

Europe Market Split by Country

Europe Psychotherapeutic Combinations Market

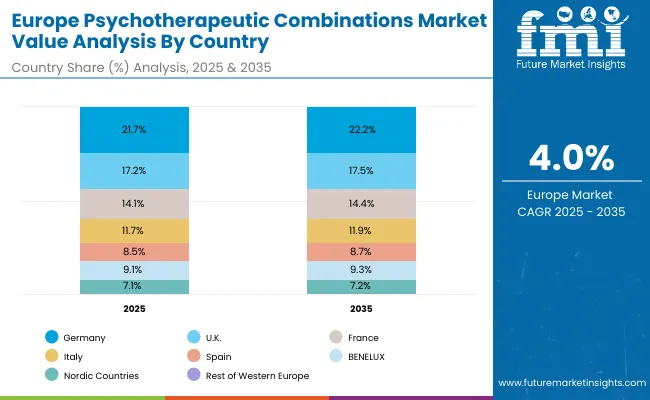
The psychotherapeutic combinations market in Europe is projected to expand steadily through 2035, supported by increasing adoption of polypharmacy in psychiatry, rising prevalence of complex mood and anxiety disorders, and ongoing clinical innovation in multi-target therapies.

Germany will continue to lead the regional market, accounting for 21.7% in 2025 and rising slightly to 22.2% by 2035, supported by a strong clinical research base, reimbursement pathways, and robust psychiatric care infrastructure. The United Kingdom follows with 17.2% in 2025, increasing to 17.5% by 2035, driven by NHS adoption of advanced treatment guidelines, digital mental health integration, and broadening specialist networks.

France holds 14.1% in 2025, edging up to 14.4% by 2035 as psychiatric hospitals expand multi-drug therapy protocols and demand grows for tailored treatment regimens. Italy contributes 11.7% in 2025, remaining broadly stable at 11.9% by 2035, supported by strong regional mental health programs and growing clinical trial participation. Spain represents 8.5% in 2025, inching upward to 8.7% by 2035, underpinned by strengthening access to psychiatric services and patient support programs.

BENELUX markets together account for 9.1% in 2025, moving to 9.3% by 2035, supported by innovation-friendly regulatory frameworks and academic-industry collaboration. The Nordic countries represent 7.1% in 2025, marginally increasing to 7.2% by 2035, with demand fueled by progressive healthcare systems and early adoption of evidence-based psychiatric care. The Rest of Western Europe moderates from 10.6% in 2025 to 8.7% by 2035, as larger core markets capture a greater share of investment, clinical trials, and adoption of combination therapy protocols.
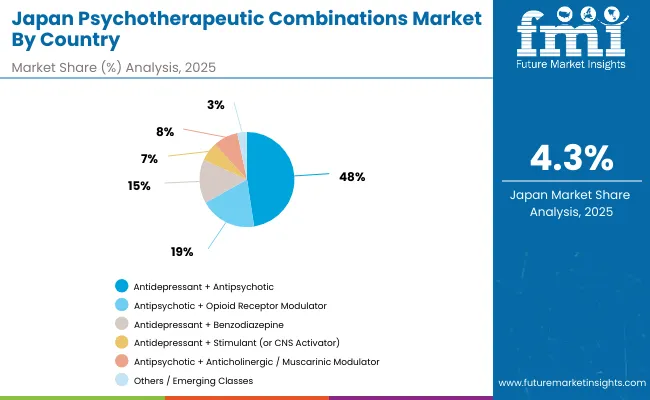
Japan Segmental Share by Country

Japan Psychotherapeutic Combinations Market

The psychotherapeutic combinations market in Japan is set to remain diversified across several therapy pairings in 2025, reflecting clinical preferences in psychiatric practice and evolving prescribing patterns. Antidepressant + Antipsychotic combinations dominate with a 47.6% share in 2025, supported by their central role in managing treatment-resistant depression, bipolar disorder, and psychotic features within mood disorders.

Antipsychotic + Opioid receptor modulator regimens represent 19.3% in 2025, gaining traction from pipeline approvals targeting schizophrenia with adjunctive mood stabilization benefits. Antidepressant + Benzodiazepine therapies hold 14.9%, sustained by their widespread use for acute anxiety comorbidities and rapid symptom relief in depressive disorders.

Meanwhile, Antidepressant + Stimulant (CNS activator) pairings account for 6.5%, driven by off-label use in refractory depression and ADHD-related comorbid presentations. Antipsychotic + Anticholinergic / Muscarinic modulator regimens contribute 8.4%, largely to manage extrapyramidal side effects associated with long-term antipsychotic therapy. The remaining 3.3% is attributed to emerging classes and novel mechanism-based combinations, reflecting the growing role of precision psychiatry and experimental adjunctive approaches entering clinical practice.
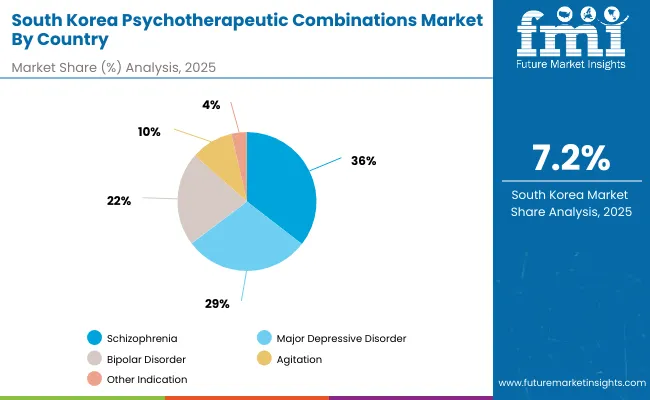
South Korea Segmental Share By Country

South Korea Psychotherapeutic Combinations Market

The psychotherapeutic combinations market in South Korea in 2025 is shaped by strong demand across core psychiatric indications, reflecting both clinical prevalence and treatment guidelines. Schizophrenia accounts for the largest share at 35.5%, supported by high rates of antipsychotic utilization, long-acting injectable adoption, and increasing integration of adjunctive therapies to address treatment resistance.

Major depressive disorder (MDD) follows with 29.2%, driven by the rising burden of depression, heightened mental health awareness, and wider reimbursement for antidepressant-antipsychotic combination protocols. Bipolar disorder contributes 21.8%, supported by the established use of mood stabilizers in tandem with antidepressants and antipsychotics to manage both manic and depressive episodes.

Agitation-related indications hold 9.9%, reflecting growing prescribing of rapid-acting combinations in psychiatric emergencies and elderly care. The remaining 3.6% is attributed to other indications, including anxiety spectrum disorders, PTSD, and emerging neuropsychiatric use cases, highlighting opportunities for pipeline therapies and expanded clinical adoption.
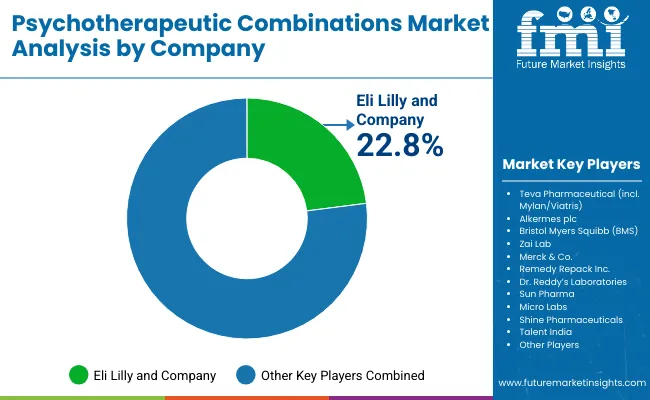
Competitive Landscape of Psychotherapeutic Combinations Market

Psychotherapeutic Combinations Market By Company

The psychotherapeutic combinations market is characterized by competition among established pharmaceutical companies, specialty mental health focused firms, and generic drug manufacturers. Companies are investing in clinical research, regulatory compliance, strategic partnerships, and healthcare provider education to deliver effective, safe, and accessible combination therapy solutions. Drug development, clinical validation, and market access strategies are central to strengthening product portfolios and market presence.

Eli Lilly and Company, USA-based, leads the market with 22.8% global value share, offering clinically-proven psychotherapeutic combinations with a focus on efficacy and patient outcomes. Teva Pharmaceutical provides comprehensive generic and branded combination products with emphasis on accessibility and cost-effectiveness. Alkermes plc focuses on innovative formulation technologies and specialized delivery systems for combination therapies. Bristol Myers Squibb delivers established combination products with strong clinical evidence and healthcare provider acceptance.

Zai Lab operates in key Asian markets with focus on bringing innovative combination therapies to underserved patient populations. Merck & Co. provides comprehensive psychiatric medication portfolios including combination products across multiple therapeutic areas. Remedy Repack Inc. specializes in customized packaging and medication management solutions for combination therapies. Dr. Reddy's Laboratories, Sun Pharma, Micro Labs, and Shine Pharmaceuticals provide generic alternatives and specialized formulations to enhance market accessibility and patient access to essential combination treatments.

Key Players in the Psychotherapeutic Combinations Market

  • Eli Lilly and Company
  • Teva Pharmaceutical (incl. Mylan/Viatris)
  • Alkermes plc
  • Bristol Myers Squibb (BMS)
  • Zai Lab
  • Merck & Co.
  • Remedy Repack Inc.
  • Dr. Reddy's Laboratories
  • Sun Pharma
  • Micro Labs
  • Shine Pharmaceuticals
  • Talent India

Scope of the Report

Items Values
Quantitative Units (2025) USD 805.6 Million
Drug Class Antidepressant + Antipsychotic, Antipsychotic + Opioid Receptor Modulator, Antidepressant + Benzodiazepine, Antidepressant + Stimulant, Antipsychotic + Anticholinergic/Muscarinic Modulator, Others/Emerging Classes
Indication Schizophrenia, Major Depressive Disorder, Bipolar Disorder, Agitation, Other Indication
Sales Channel Retail Pharmacies, Hospital Pharmacies, Drug Stores, E-Commerce Pharmacy
Regions Covered North America, Europe, East Asia, South Asia & Pacific, Latin America, Middle East & Africa
Countries Covered United States, Canada, United Kingdom, Germany, France, China, Japan, South Korea, India, Brazil, Australia and 40+ countries
Key Companies Profiled Eli Lilly and Company, Teva Pharmaceutical, Alkermes plc, Bristol Myers Squibb, Zai Lab, Merck & Co., Remedy Repack Inc., Dr. Reddy's Laboratories, Sun Pharma, Micro Labs
Additional Attributes Dollar sales by combination type and therapeutic indication, regional demand trends, competitive landscape, healthcare provider preferences for specific combinations, integration with specialty pharmacy channels, innovations in extended-release formulations, patient adherence monitoring, and clinical outcome optimization

Psychotherapeutic Combinations Market by Segments

By Drug Class:

  • Antidepressant + Antipsychotic
  • Antipsychotic + Opioid Receptor Modulator
  • Antidepressant + Benzodiazepine
  • Antidepressant + Stimulant (or CNS Activator)
  • Antipsychotic + Anticholinergic / Muscarinic Modulator
  • Others / Emerging Classes

By Indication:

  • Schizophrenia
  • Major Depressive Disorder
  • Bipolar Disorder
  • Agitation
  • Other Indication

By Sales Channel:

  • Retail Pharmacies
  • Hospital Pharmacies
  • Drug Stores
  • E-Commerce Pharmacy

By Region:

  • North America
    • United States
    • Canada
    • Mexico
  • Europe
    • Germany
    • United Kingdom
    • France
    • Italy
    • Spain
    • Nordic
    • BENELUX
    • Rest of Europe
  • East Asia
    • China
    • Japan
    • South Korea
  • South Asia & Pacific
    • India
    • ASEAN
    • Australia & New Zealand
    • Rest of South Asia & Pacific
  • Latin America
    • Brazil
    • Chile
    • Rest of Latin America
  • Middle East & Africa
    • Kingdom of Saudi Arabia
    • Other GCC Countries
    • Turkiye
    • South Africa
    • Other African Union
    • Rest of Middle East & Africa

Table of Content

  1. Executive Summary
    • Global Market Outlook
    • Demand-side Trends
    • Supply-side Trends
    • Technology Roadmap Analysis
    • Analysis and Recommendations
  2. Market Overview
    • Market Coverage / Taxonomy
    • Market Definition / Scope / Limitations
  3. Market Background
    • Market Dynamics
      • Drivers
      • Restraints
      • Opportunity
      • Trends
    • Scenario Forecast
      • Demand in Optimistic Scenario
      • Demand in Likely Scenario
      • Demand in Conservative Scenario
    • Opportunity Map Analysis
    • Product Life Cycle Analysis
    • Supply Chain Analysis
      • Supply Side Participants and their Roles
        • Producers
        • Mid-Level Participants (Traders/ Agents/ Brokers)
        • Wholesalers and Distributors
      • Value Added and Value Created at Node in the Supply Chain
      • List of Raw Material Suppliers
      • List of Existing and Potential Buyer's
    • Investment Feasibility Matrix
    • Value Chain Analysis
      • Profit Margin Analysis
      • Wholesalers and Distributors
      • Retailers
    • PESTLE and Porter's Analysis
    • Regulatory Landscape
      • By Key Regions
      • By Key Countries
    • Regional Parent Market Outlook
    • Production and Consumption Statistics
    • Cross-Border Data Residency & Procurement Patterns
  4. Global Market Analysis 2020 to 2024 and Forecast, 2025 to 2035
    • Historical Market Size Value (USD Million) & Volume (Units) Analysis, 2020 to 2024
    • Current and Future Market Size Value (USD Million) & Volume (Units) Projections, 2025 to 2035
      • Y-o-Y Growth Trend Analysis
      • Absolute $ Opportunity Analysis
  5. Global Market Analysis 2020 to 2024 and Forecast 2025 to 2035, By Drug Class
    • Introduction / Key Findings
    • Historical Market Size Value (USD Million) & Volume (Units) Analysis By Drug Class, 2020 to 2024
    • Current and Future Market Size Value (USD Million) & Volume (Units) Analysis and Forecast By Drug Class, 2025 to 2035
      • Antidepressant + Antipsychotic
      • Antipsychotic + Opioid Receptor Modulator
      • Antidepressant + Benzodiazepine
      • Antidepressant + Stimulant (or CNS Activator)
      • Antipsychotic + Anticholinergic / Muscarinic Modulator
      • Others / Emerging Classes
    • Y-o-Y Growth Trend Analysis By Drug Class, 2020 to 2024
    • Absolute $ Opportunity Analysis By Drug Class, 2025 to 2035
  6. Global Market Analysis 2020 to 2024 and Forecast 2025 to 2035, By Indication
    • Introduction / Key Findings
    • Historical Market Size Value (USD Million) & Volume (Units) Analysis By Indication, 2020 to 2024
    • Current and Future Market Size Value (USD Million) & Volume (Units) Analysis and Forecast By Indication, 2025 to 2035
      • Schizophrenia
      • Major Depressive Disorder
      • Bipolar Disorder
      • Agitation
      • Other Indication
    • Y-o-Y Growth Trend Analysis By Indication, 2020 to 2024
    • Absolute $ Opportunity Analysis By Indication, 2025 to 2035
  7. Global Market Analysis 2020 to 2024 and Forecast 2025 to 2035, By Sales Channel
    • Introduction / Key Findings
    • Historical Market Size Value (USD Million) & Volume (Units) Analysis By Sales Channel, 2020 to 2024
    • Current and Future Market Size Value (USD Million) & Volume (Units) Analysis and Forecast By Sales Channel, 2025 to 2035
      • Retail Pharmacies
      • Hospital Pharmacies
      • Drug Stores
      • E-Commerce Pharmacy
    • Y-o-Y Growth Trend Analysis By Sales Channel, 2020 to 2024
    • Absolute $ Opportunity Analysis By Sales Channel, 2025 to 2035
  8. Global Market Analysis 2020 to 2024 and Forecast 2025 to 2035, By Region
    • Introduction
    • Historical Market Size Value (USD Million) & Volume (Units) Analysis By Region, 2020 to 2024
    • Current Market Size Value (USD Million) & Volume (Units) Analysis and Forecast By Region, 2025 to 2035
      • North America
      • Europe
      • East Asia
      • South Asia & Pacific
      • Latin America
      • Middle East & Africa
    • Market Attractiveness Analysis By Region
  9. North America Market Analysis 2020 to 2024 and Forecast 2025 to 2035, By Country
    • Historical Market Size Value (USD Million) & Volume (Units) Trend Analysis By Market Taxonomy, 2020 to 2024
    • Market Size Value (USD Million) & Volume (Units) Forecast By Market Taxonomy, 2025 to 2035
      • By Country
        • United States
        • Canada
        • Mexico
      • By Drug Class
      • By Indication
      • By Sales Channel
    • Market Attractiveness Analysis
      • By Country
      • By Drug Class
      • By Indication
      • By Sales Channel
    • Key Takeaways
  10. Europe Market Analysis 2020 to 2024 and Forecast 2025 to 2035, By Country
    • Historical Market Size Value (USD Million) & Volume (Units) Trend Analysis By Market Taxonomy, 2020 to 2024
    • Market Size Value (USD Million) & Volume (Units) Forecast By Market Taxonomy, 2025 to 2035
      • By Country
        • Germany
        • United Kingdom
        • France
        • Italy
        • Spain
        • Nordic
        • BENELUX
        • Rest of Europe
      • By Drug Class
      • By Indication
      • By Sales Channel
    • Market Attractiveness Analysis
      • By Country
      • By Drug Class
      • By Indication
      • By Sales Channel
    • Key Takeaways
  11. East Asia Market Analysis 2020 to 2024 and Forecast 2025 to 2035, By Country
    • Historical Market Size Value (USD Million) & Volume (Units) Trend Analysis By Market Taxonomy, 2020 to 2024
    • Market Size Value (USD Million) & Volume (Units) Forecast By Market Taxonomy, 2025 to 2035
      • By Country
        • China
        • Japan
        • South Korea
      • By Drug Class
      • By Indication
      • By Sales Channel
    • Market Attractiveness Analysis
      • By Country
      • By Drug Class
      • By Indication
      • By Sales Channel
    • Key Takeaways
  12. South Asia & Pacific Market Analysis 2020 to 2024 and Forecast 2025 to 2035, By Country
    • Historical Market Size Value (USD Million) & Volume (Units) Trend Analysis By Market Taxonomy, 2020 to 2024
    • Market Size Value (USD Million) & Volume (Units) Forecast By Market Taxonomy, 2025 to 2035
      • By Country
        • India
        • ASEAN
        • Australia & New Zealand
        • Rest of South Asia & Pacific
      • By Drug Class
      • By Indication
      • By Sales Channel
    • Market Attractiveness Analysis
      • By Country
      • By Drug Class
      • By Indication
      • By Sales Channel
    • Key Takeaways
  13. Latin America Market Analysis 2020 to 2024 and Forecast 2025 to 2035, By Country
    • Historical Market Size Value (USD Million) & Volume (Units) Trend Analysis By Market Taxonomy, 2020 to 2024
    • Market Size Value (USD Million) & Volume (Units) Forecast By Market Taxonomy, 2025 to 2035
      • By Country
        • Brazil
        • Chile
        • Rest of Latin America
      • By Drug Class
      • By Indication
      • By Sales Channel
    • Market Attractiveness Analysis
      • By Country
      • By Drug Class
      • By Indication
      • By Sales Channel
    • Key Takeaways
  14. Middle East & Africa Market Analysis 2020 to 2024 and Forecast 2025 to 2035, By Country
    • Historical Market Size Value (USD Million) & Volume (Units) Trend Analysis By Market Taxonomy, 2020 to 2024
    • Market Size Value (USD Million) & Volume (Units) Forecast By Market Taxonomy, 2025 to 2035
      • By Country
        • Kingdom of Saudi Arabia
        • Other GCC Countries
        • Turkiye
        • South Africa
        • Other African Union
        • Rest of Middle East & Africa
      • By Drug Class
      • By Indication
      • By Sales Channel
    • Market Attractiveness Analysis
      • By Country
      • By Drug Class
      • By Indication
      • By Sales Channel
    • Key Takeaways
  15. Key Countries Market Analysis
    • United States
      • Pricing Analysis
      • Market Share Analysis, 2024
        • By Drug Class
        • By Indication
        • By Sales Channel
    • Germany
      • Pricing Analysis
      • Market Share Analysis, 2024
        • By Drug Class
        • By Indication
        • By Sales Channel
    • China
      • Pricing Analysis
      • Market Share Analysis, 2024
        • By Drug Class
        • By Indication
        • By Sales Channel
    • Japan
      • Pricing Analysis
      • Market Share Analysis, 2024
        • By Drug Class
        • By Indication
        • By Sales Channel
    • India
      • Pricing Analysis
      • Market Share Analysis, 2024
        • By Drug Class
        • By Indication
        • By Sales Channel
    • United Kingdom
      • Pricing Analysis
      • Market Share Analysis, 2024
        • By Drug Class
        • By Indication
        • By Sales Channel
    • France
      • Pricing Analysis
      • Market Share Analysis, 2024
        • By Drug Class
        • By Indication
        • By Sales Channel
    • Brazil
      • Pricing Analysis
      • Market Share Analysis, 2024
        • By Drug Class
        • By Indication
        • By Sales Channel
  16. Market Structure Analysis
    • Competition Dashboard
    • Competition Benchmarking
    • Market Share Analysis of Top Players
      • By Regional
      • By Drug Class
      • By Indication
      • By Sales Channel
  17. Competition Analysis
    • Competition Deep Dive
      • Eli Lilly and Company
        • Overview
        • Product Portfolio
        • Profitability by Market Segments (Product/Age/Sales Channel/Region)
        • Sales Footprint
        • Strategy Overview
          • Marketing Strategy
          • Product Strategy
          • Channel Strategy
      • Teva Pharmaceutical
        • Overview
        • Product Portfolio
        • Profitability by Market Segments (Product/Age/Sales Channel/Region)
        • Sales Footprint
        • Strategy Overview
          • Marketing Strategy
          • Product Strategy
          • Channel Strategy
      • Alkermes plc
        • Overview
        • Product Portfolio
        • Profitability by Market Segments (Product/Age/Sales Channel/Region)
        • Sales Footprint
        • Strategy Overview
          • Marketing Strategy
          • Product Strategy
          • Channel Strategy
      • Bristol Myers Squibb
        • Overview
        • Product Portfolio
        • Profitability by Market Segments (Product/Age/Sales Channel/Region)
        • Sales Footprint
        • Strategy Overview
          • Marketing Strategy
          • Product Strategy
          • Channel Strategy
      • Zai Lab
        • Overview
        • Product Portfolio
        • Profitability by Market Segments (Product/Age/Sales Channel/Region)
        • Sales Footprint
        • Strategy Overview
          • Marketing Strategy
          • Product Strategy
          • Channel Strategy
      • Merck & Co.
        • Overview
        • Product Portfolio
        • Profitability by Market Segments (Product/Age/Sales Channel/Region)
        • Sales Footprint
        • Strategy Overview
          • Marketing Strategy
          • Product Strategy
          • Channel Strategy
      • Dr. Reddy's Laboratories
        • Overview
        • Product Portfolio
        • Profitability by Market Segments (Product/Age/Sales Channel/Region)
        • Sales Footprint
        • Strategy Overview
          • Marketing Strategy
          • Product Strategy
          • Channel Strategy
  18. Assumptions & Acronyms Used
  19. Research Methodology

List of Tables

  • Table 1: Global Market Value (USD Million) Forecast by Region, 2020-2035
  • Table 2: Global Market Volume (Units) Forecast by Region, 2020-2035
  • Table 3: Global Market Value (USD Million) Forecast by Drug Class, 2020-2035
  • Table 4: Global Market Volume (Units) Forecast by Drug Class, 2020-2035
  • Table 5: Global Market Value (USD Million) Forecast by Indication, 2020-2035
  • Table 6: Global Market Volume (Units) Forecast by Indication, 2020-2035
  • Table 7: Global Market Value (USD Million) Forecast by Sales Channel, 2020-2035
  • Table 8: Global Market Volume (Units) Forecast by Sales Channel, 2020-2035
  • Table 9: North America Market Value (USD Million) Forecast by Country, 2020-2035
  • Table 10: North America Market Volume (Units) Forecast by Country, 2020-2035
  • Table 11: North America Market Value (USD Million) Forecast by Drug Class, 2020-2035
  • Table 12: North America Market Volume (Units) Forecast by Drug Class, 2020-2035
  • Table 13: North America Market Value (USD Million) Forecast by Indication, 2020-2035
  • Table 14: North America Market Volume (Units) Forecast by Indication, 2020-2035
  • Table 15: North America Market Value (USD Million) Forecast by Sales Channel, 2020-2035
  • Table 16: North America Market Volume (Units) Forecast by Sales Channel, 2020-2035
  • Table 17: Europe Market Value (USD Million) Forecast by Country, 2020-2035
  • Table 18: Europe Market Volume (Units) Forecast by Country, 2020-2035
  • Table 19: Europe Market Value (USD Million) Forecast by Drug Class, 2020-2035
  • Table 20: Europe Market Volume (Units) Forecast by Drug Class, 2020-2035
  • Table 21: Europe Market Value (USD Million) Forecast by Indication, 2020-2035
  • Table 22: Europe Market Volume (Units) Forecast by Indication, 2020-2035
  • Table 23: Europe Market Value (USD Million) Forecast by Sales Channel, 2020-2035
  • Table 24: Europe Market Volume (Units) Forecast by Sales Channel, 2020-2035
  • Table 25: East Asia Market Value (USD Million) Forecast by Country, 2020-2035
  • Table 26: East Asia Market Volume (Units) Forecast by Country, 2020-2035
  • Table 27: East Asia Market Value (USD Million) Forecast by Drug Class, 2020-2035
  • Table 28: East Asia Market Volume (Units) Forecast by Drug Class, 2020-2035
  • Table 29: East Asia Market Value (USD Million) Forecast by Indication, 2020-2035
  • Table 30: East Asia Market Volume (Units) Forecast by Indication, 2020-2035
  • Table 31: East Asia Market Value (USD Million) Forecast by Sales Channel, 2020-2035
  • Table 32: East Asia Market Volume (Units) Forecast by Sales Channel, 2020-2035
  • Table 33: South Asia & Pacific Market Value (USD Million) Forecast by Country, 2020-2035
  • Table 34: South Asia & Pacific Market Volume (Units) Forecast by Country, 2020-2035
  • Table 35: South Asia & Pacific Market Value (USD Million) Forecast by Drug Class, 2020-2035
  • Table 36: South Asia & Pacific Market Volume (Units) Forecast by Drug Class, 2020-2035
  • Table 37: South Asia & Pacific Market Value (USD Million) Forecast by Indication, 2020-2035
  • Table 38: South Asia & Pacific Market Volume (Units) Forecast by Indication, 2020-2035
  • Table 39: South Asia & Pacific Market Value (USD Million) Forecast by Sales Channel, 2020-2035
  • Table 40: South Asia & Pacific Market Volume (Units) Forecast by Sales Channel, 2020-2035
  • Table 41: Latin America Market Value (USD Million) Forecast by Country, 2020-2035
  • Table 42: Latin America Market Volume (Units) Forecast by Country, 2020-2035
  • Table 43: Latin America Market Value (USD Million) Forecast by Drug Class, 2020-2035
  • Table 44: Latin America Market Volume (Units) Forecast by Drug Class, 2020-2035
  • Table 45: Latin America Market Value (USD Million) Forecast by Indication, 2020-2035
  • Table 46: Latin America Market Volume (Units) Forecast by Indication, 2020-2035
  • Table 47: Latin America Market Value (USD Million) Forecast by Sales Channel, 2020-2035
  • Table 48: Latin America Market Volume (Units) Forecast by Sales Channel, 2020-2035
  • Table 49: Middle East & Africa Market Value (USD Million) Forecast by Country, 2020-2035
  • Table 50: Middle East & Africa Market Volume (Units) Forecast by Country, 2020-2035
  • Table 51: Middle East & Africa Market Value (USD Million) Forecast by Drug Class, 2020-2035
  • Table 52: Middle East & Africa Market Volume (Units) Forecast by Drug Class, 2020-2035
  • Table 53: Middle East & Africa Market Value (USD Million) Forecast by Indication, 2020-2035
  • Table 54: Middle East & Africa Market Volume (Units) Forecast by Indication, 2020-2035
  • Table 55: Middle East & Africa Market Value (USD Million) Forecast by Sales Channel, 2020-2035
  • Table 56: Middle East & Africa Market Volume (Units) Forecast by Sales Channel, 2020-2035
  • Table 57: Global Market Share (%) Analysis by Drug Class, 2025 & 2035
  • Table 58: Global Market Share (%) Analysis by Indication, 2025 & 2035
  • Table 59: Global Market Share (%) Analysis by Sales Channel, 2025 & 2035
  • Table 60: Global Market Share (%) Analysis by Region, 2025 & 2035
  • Table 61: Global Market Absolute $ Opportunity Analysis by Drug Class, 2025-2035
  • Table 62: Global Market Absolute $ Opportunity Analysis by Indication, 2025-2035
  • Table 63: Global Market Absolute $ Opportunity Analysis by Sales Channel, 2025-2035
  • Table 64: Global Market Absolute $ Opportunity Analysis by Region, 2025-2035
  • Table 65: North America Market Share (%) Analysis by Country, 2025 & 2035
  • Table 66: North America Market Share (%) Analysis by Drug Class, 2025 & 2035
  • Table 67: North America Market Share (%) Analysis by Indication, 2025 & 2035
  • Table 68: North America Market Share (%) Analysis by Sales Channel, 2025 & 2035
  • Table 69: Europe Market Share (%) Analysis by Country, 2025 & 2035
  • Table 70: Europe Market Share (%) Analysis by Drug Class, 2025 & 2035
  • Table 71: Europe Market Share (%) Analysis by Indication, 2025 & 2035
  • Table 72: Europe Market Share (%) Analysis by Sales Channel, 2025 & 2035
  • Table 73: East Asia Market Share (%) Analysis by Country, 2025 & 2035
  • Table 74: East Asia Market Share (%) Analysis by Drug Class, 2025 & 2035
  • Table 75: East Asia Market Share (%) Analysis by Indication, 2025 & 2035
  • Table 76: East Asia Market Share (%) Analysis by Sales Channel, 2025 & 2035
  • Table 77: South Asia & Pacific Market Share (%) Analysis by Country, 2025 & 2035
  • Table 78: South Asia & Pacific Market Share (%) Analysis by Drug Class, 2025 & 2035
  • Table 79: South Asia & Pacific Market Share (%) Analysis by Indication, 2025 & 2035
  • Table 80: South Asia & Pacific Market Share (%) Analysis by Sales Channel, 2025 & 2035
  • Table 81: Latin America Market Share (%) Analysis by Country, 2025 & 2035
  • Table 82: Latin America Market Share (%) Analysis by Drug Class, 2025 & 2035
  • Table 83: Latin America Market Share (%) Analysis by Indication, 2025 & 2035
  • Table 84: Latin America Market Share (%) Analysis by Sales Channel, 2025 & 2035
  • Table 85: Middle East & Africa Market Share (%) Analysis by Country, 2025 & 2035
  • Table 86: Middle East & Africa Market Share (%) Analysis by Drug Class, 2025 & 2035
  • Table 87: Middle East & Africa Market Share (%) Analysis by Indication, 2025 & 2035
  • Table 88: Middle East & Africa Market Share (%) Analysis by Sales Channel, 2025 & 2035
  • Table 89: United States Market Value (USD Million) Analysis by Drug Class, 2020-2035
  • Table 90: United States Market Value (USD Million) Analysis by Indication, 2020-2035
  • Table 91: United States Market Value (USD Million) Analysis by Sales Channel, 2020-2035
  • Table 92: Germany Market Value (USD Million) Analysis by Drug Class, 2020-2035
  • Table 93: Germany Market Value (USD Million) Analysis by Indication, 2020-2035
  • Table 94: Germany Market Value (USD Million) Analysis by Sales Channel, 2020-2035
  • Table 95: China Market Value (USD Million) Analysis by Drug Class, 2020-2035
  • Table 96: China Market Value (USD Million) Analysis by Indication, 2020-2035
  • Table 97: China Market Value (USD Million) Analysis by Sales Channel, 2020-2035
  • Table 98: Japan Market Value (USD Million) Analysis by Drug Class, 2020-2035
  • Table 99: Japan Market Value (USD Million) Analysis by Indication, 2020-2035
  • Table 100: Japan Market Value (USD Million) Analysis by Sales Channel, 2020-2035
  • Table 101: India Market Value (USD Million) Analysis by Drug Class, 2020-2035
  • Table 102: India Market Value (USD Million) Analysis by Indication, 2020-2035
  • Table 103: India Market Value (USD Million) Analysis by Sales Channel, 2020-2035
  • Table 104: United Kingdom Market Value (USD Million) Analysis by Drug Class, 2020-2035
  • Table 105: United Kingdom Market Value (USD Million) Analysis by Indication, 2020-2035
  • Table 106: United Kingdom Market Value (USD Million) Analysis by Sales Channel, 2020-2035
  • Table 107: France Market Value (USD Million) Analysis by Drug Class, 2020-2035
  • Table 108: France Market Value (USD Million) Analysis by Indication, 2020-2035
  • Table 109: France Market Value (USD Million) Analysis by Sales Channel, 2020-2035
  • Table 110: Brazil Market Value (USD Million) Analysis by Drug Class, 2020-2035
  • Table 111: Brazil Market Value (USD Million) Analysis by Indication, 2020-2035
  • Table 112: Brazil Market Value (USD Million) Analysis by Sales Channel, 2020-2035
  • Table 113: Global Market Pricing Analysis by Drug Class, 2020-2035
  • Table 114: Global Market Pricing Analysis by Indication, 2020-2035
  • Table 115: Global Market Pricing Analysis by Sales Channel, 2020-2035
  • Table 116: Global Market Pricing Analysis by Region, 2020-2035
  • Table 117: North America Market Y-o-Y Growth (%) Analysis by Country, 2021-2035
  • Table 118: North America Market Y-o-Y Growth (%) Analysis by Drug Class, 2021-2035
  • Table 119: North America Market Y-o-Y Growth (%) Analysis by Indication, 2021-2035
  • Table 120: North America Market Y-o-Y Growth (%) Analysis by Sales Channel, 2021-2035
  • Table 121: Europe Market Y-o-Y Growth (%) Analysis by Country, 2021-2035
  • Table 122: Europe Market Y-o-Y Growth (%) Analysis by Drug Class, 2021-2035
  • Table 123: Europe Market Y-o-Y Growth (%) Analysis by Indication, 2021-2035
  • Table 124: Europe Market Y-o-Y Growth (%) Analysis by Sales Channel, 2021-2035
  • Table 125: East Asia Market Y-o-Y Growth (%) Analysis by Country, 2021-2035
  • Table 126: East Asia Market Y-o-Y Growth (%) Analysis by Drug Class, 2021-2035
  • Table 127: East Asia Market Y-o-Y Growth (%) Analysis by Indication, 2021-2035
  • Table 128: East Asia Market Y-o-Y Growth (%) Analysis by Sales Channel, 2021-2035
  • Table 129: South Asia & Pacific Market Y-o-Y Growth (%) Analysis by Country, 2021-2035
  • Table 130: South Asia & Pacific Market Y-o-Y Growth (%) Analysis by Drug Class, 2021-2035
  • Table 131: South Asia & Pacific Market Y-o-Y Growth (%) Analysis by Indication, 2021-2035
  • Table 132: South Asia & Pacific Market Y-o-Y Growth (%) Analysis by Sales Channel, 2021-2035
  • Table 133: Latin America Market Y-o-Y Growth (%) Analysis by Country, 2021-2035
  • Table 134: Latin America Market Y-o-Y Growth (%) Analysis by Drug Class, 2021-2035
  • Table 135: Latin America Market Y-o-Y Growth (%) Analysis by Indication, 2021-2035
  • Table 136: Latin America Market Y-o-Y Growth (%) Analysis by Sales Channel, 2021-2035
  • Table 137: Middle East & Africa Market Y-o-Y Growth (%) Analysis by Country, 2021-2035
  • Table 138: Middle East & Africa Market Y-o-Y Growth (%) Analysis by Drug Class, 2021-2035
  • Table 139: Middle East & Africa Market Y-o-Y Growth (%) Analysis by Indication, 2021-2035
  • Table 140: Middle East & Africa Market Y-o-Y Growth (%) Analysis by Sales Channel, 2021-2035
  • Table 141: Global Market Attractiveness Index by Drug Class, 2025-2035
  • Table 142: Global Market Attractiveness Index by Indication, 2025-2035
  • Table 143: Global Market Attractiveness Index by Sales Channel, 2025-2035
  • Table 144: Global Market Attractiveness Index by Region, 2025-2035
  • Table 145: Global Market Competition Matrix Analysis, 2024
  • Table 146: Global Market Company Market Share Analysis by Revenue, 2024
  • Table 147: Global Market Company Market Share Analysis by Drug Class, 2024
  • Table 148: Global Market Company Market Share Analysis by Region, 2024
  • Table 149: Global Market Regulatory Timeline by Region, 2020-2035
  • Table 150: Global Market Patent Expiry Analysis by Key Products, 2025-2035

List of Figures

  • Figure 1: Global Market Value (USD Million) by Drug Class, 2025-2035
  • Figure 2: Global Market Value (USD Million) by Indication, 2025-2035
  • Figure 3: Global Market Value (USD Million) by Sales Channel, 2025-2035
  • Figure 4: Global Market Value (USD Million) by Region, 2025-2035
  • Figure 5: Global Market Value (USD Million) Analysis by Region, 2020-2035
  • Figure 6: Global Market Volume (Units) Analysis by Region, 2020-2035
  • Figure 7: Global Market Value Share (%) and BPS Analysis by Region, 2025-2035
  • Figure 8: Global Market Y-o-Y Growth (%) Projections by Region, 2025-2035
  • Figure 9: Global Market Value (USD Million) Analysis by Drug Class, 2020-2035
  • Figure 10: Global Market Volume (Units) Analysis by Drug Class, 2020-2035
  • Figure 11: Global Market Value Share (%) and BPS Analysis by Drug Class, 2025-2035
  • Figure 12: Global Market Y-o-Y Growth (%) Projections by Drug Class, 2025-2035
  • Figure 13: Global Market Value (USD Million) Analysis by Indication, 2020-2035
  • Figure 14: Global Market Volume (Units) Analysis by Indication, 2020-2035
  • Figure 15: Global Market Value Share (%) and BPS Analysis by Indication, 2025-2035
  • Figure 16: Global Market Y-o-Y Growth (%) Projections by Indication, 2025-2035
  • Figure 17: Global Market Value (USD Million) Analysis by Sales Channel, 2020-2035
  • Figure 18: Global Market Volume (Units) Analysis by Sales Channel, 2020-2035
  • Figure 19: Global Market Value Share (%) and BPS Analysis by Sales Channel, 2025-2035
  • Figure 20: Global Market Y-o-Y Growth (%) Projections by Sales Channel, 2025-2035
  • Figure 21: Global Market Attractiveness by Drug Class, 2025-2035
  • Figure 22: Global Market Attractiveness by Indication, 2025-2035
  • Figure 23: Global Market Attractiveness by Sales Channel, 2025-2035
  • Figure 24: Global Market Attractiveness by Region, 2025-2035
  • Figure 25: North America Market Value (USD Million) by Drug Class, 2025-2035
  • Figure 26: North America Market Value (USD Million) by Indication, 2025-2035
  • Figure 27: North America Market Value (USD Million) by Sales Channel, 2025-2035
  • Figure 28: North America Market Value (USD Million) by Country, 2025-2035
  • Figure 29: North America Market Value (USD Million) Analysis by Country, 2020-2035
  • Figure 30: North America Market Volume (Units) Analysis by Country, 2020-2035
  • Figure 31: North America Market Value Share (%) and BPS Analysis by Country, 2025-2035
  • Figure 32: North America Market Y-o-Y Growth (%) Projections by Country, 2025-2035
  • Figure 33: North America Market Value (USD Million) Analysis by Drug Class, 2020-2035
  • Figure 34: North America Market Volume (Units) Analysis by Drug Class, 2020-2035
  • Figure 35: North America Market Value Share (%) and BPS Analysis by Drug Class, 2025-2035
  • Figure 36: North America Market Y-o-Y Growth (%) Projections by Drug Class, 2025-2035
  • Figure 37: North America Market Value (USD Million) Analysis by Indication, 2020-2035
  • Figure 38: North America Market Volume (Units) Analysis by Indication, 2020-2035
  • Figure 39: North America Market Value Share (%) and BPS Analysis by Indication, 2025-2035
  • Figure 40: North America Market Y-o-Y Growth (%) Projections by Indication, 2025-2035
  • Figure 41: North America Market Value (USD Million) Analysis by Sales Channel, 2020-2035
  • Figure 42: North America Market Volume (Units) Analysis by Sales Channel, 2020-2035
  • Figure 43: North America Market Value Share (%) and BPS Analysis by Sales Channel, 2025-2035
  • Figure 44: North America Market Y-o-Y Growth (%) Projections by Sales Channel, 2025-2035
  • Figure 45: North America Market Attractiveness by Drug Class, 2025-2035
  • Figure 46: North America Market Attractiveness by Indication, 2025-2035
  • Figure 47: North America Market Attractiveness by Sales Channel, 2025-2035
  • Figure 48: North America Market Attractiveness by Country, 2025-2035
  • Figure 49: Europe Market Value (USD Million) by Drug Class, 2025-2035
  • Figure 50: Europe Market Value (USD Million) by Indication, 2025-2035
  • Figure 51: Europe Market Value (USD Million) by Sales Channel, 2025-2035
  • Figure 52: Europe Market Value (USD Million) by Country, 2025-2035
  • Figure 53: Europe Market Value (USD Million) Analysis by Country, 2020-2035
  • Figure 54: Europe Market Volume (Units) Analysis by Country, 2020-2035
  • Figure 55: Europe Market Value Share (%) and BPS Analysis by Country, 2025-2035
  • Figure 56: Europe Market Y-o-Y Growth (%) Projections by Country, 2025-2035
  • Figure 57: Europe Market Value (USD Million) Analysis by Drug Class, 2020-2035
  • Figure 58: Europe Market Volume (Units) Analysis by Drug Class, 2020-2035
  • Figure 59: Europe Market Value Share (%) and BPS Analysis by Drug Class, 2025-2035
  • Figure 60: Europe Market Y-o-Y Growth (%) Projections by Drug Class, 2025-2035
  • Figure 61: Europe Market Value (USD Million) Analysis by Indication, 2020-2035
  • Figure 62: Europe Market Volume (Units) Analysis by Indication, 2020-2035
  • Figure 63: Europe Market Value Share (%) and BPS Analysis by Indication, 2025-2035
  • Figure 64: Europe Market Y-o-Y Growth (%) Projections by Indication, 2025-2035
  • Figure 65: Europe Market Value (USD Million) Analysis by Sales Channel, 2020-2035
  • Figure 66: Europe Market Volume (Units) Analysis by Sales Channel, 2020-2035
  • Figure 67: Europe Market Value Share (%) and BPS Analysis by Sales Channel, 2025-2035
  • Figure 68: Europe Market Y-o-Y Growth (%) Projections by Sales Channel, 2025-2035
  • Figure 69: Europe Market Attractiveness by Drug Class, 2025-2035
  • Figure 70: Europe Market Attractiveness by Indication, 2025-2035
  • Figure 71: Europe Market Attractiveness by Sales Channel, 2025-2035
  • Figure 72: Europe Market Attractiveness by Country, 2025-2035
  • Figure 73: East Asia Market Value (USD Million) by Drug Class, 2025-2035
  • Figure 74: East Asia Market Value (USD Million) by Indication, 2025-2035
  • Figure 75: East Asia Market Value (USD Million) by Sales Channel, 2025-2035
  • Figure 76: East Asia Market Value (USD Million) by Country, 2025-2035
  • Figure 77: East Asia Market Value (USD Million) Analysis by Country, 2020-2035
  • Figure 78: East Asia Market Volume (Units) Analysis by Country, 2020-2035
  • Figure 79: East Asia Market Value Share (%) and BPS Analysis by Country, 2025-2035
  • Figure 80: East Asia Market Y-o-Y Growth (%) Projections by Country, 2025-2035
  • Figure 81: East Asia Market Value (USD Million) Analysis by Drug Class, 2020-2035
  • Figure 82: East Asia Market Volume (Units) Analysis by Drug Class, 2020-2035
  • Figure 83: East Asia Market Value Share (%) and BPS Analysis by Drug Class, 2025-2035
  • Figure 84: East Asia Market Y-o-Y Growth (%) Projections by Drug Class, 2025-2035
  • Figure 85: East Asia Market Value (USD Million) Analysis by Indication, 2020-2035
  • Figure 86: East Asia Market Volume (Units) Analysis by Indication, 2020-2035
  • Figure 87: East Asia Market Value Share (%) and BPS Analysis by Indication, 2025-2035
  • Figure 88: East Asia Market Y-o-Y Growth (%) Projections by Indication, 2025-2035
  • Figure 89: East Asia Market Value (USD Million) Analysis by Sales Channel, 2020-2035
  • Figure 90: East Asia Market Volume (Units) Analysis by Sales Channel, 2020-2035
  • Figure 91: East Asia Market Value Share (%) and BPS Analysis by Sales Channel, 2025-2035
  • Figure 92: East Asia Market Y-o-Y Growth (%) Projections by Sales Channel, 2025-2035
  • Figure 93: East Asia Market Attractiveness by Drug Class, 2025-2035
  • Figure 94: East Asia Market Attractiveness by Indication, 2025-2035
  • Figure 95: East Asia Market Attractiveness by Sales Channel, 2025-2035
  • Figure 96: East Asia Market Attractiveness by Country, 2025-2035
  • Figure 97: South Asia & Pacific Market Value (USD Million) by Drug Class, 2025-2035
  • Figure 98: South Asia & Pacific Market Value (USD Million) by Indication, 2025-2035
  • Figure 99: South Asia & Pacific Market Value (USD Million) by Sales Channel, 2025-2035
  • Figure 100: South Asia & Pacific Market Value (USD Million) by Country, 2025-2035
  • Figure 101: South Asia & Pacific Market Value (USD Million) Analysis by Country, 2020-2035
  • Figure 102: South Asia & Pacific Market Volume (Units) Analysis by Country, 2020-2035
  • Figure 103: South Asia & Pacific Market Value Share (%) and BPS Analysis by Country, 2025-2035
  • Figure 104: South Asia & Pacific Market Y-o-Y Growth (%) Projections by Country, 2025-2035
  • Figure 105: South Asia & Pacific Market Value (USD Million) Analysis by Drug Class, 2020-2035
  • Figure 106: South Asia & Pacific Market Volume (Units) Analysis by Drug Class, 2020-2035
  • Figure 107: South Asia & Pacific Market Value Share (%) and BPS Analysis by Drug Class, 2025-2035
  • Figure 108: South Asia & Pacific Market Y-o-Y Growth (%) Projections by Drug Class, 2025-2035
  • Figure 109: South Asia & Pacific Market Value (USD Million) Analysis by Indication, 2020-2035
  • Figure 110: South Asia & Pacific Market Volume (Units) Analysis by Indication, 2020-2035
  • Figure 111: South Asia & Pacific Market Value Share (%) and BPS Analysis by Indication, 2025-2035
  • Figure 112: South Asia & Pacific Market Y-o-Y Growth (%) Projections by Indication, 2025-2035
  • Figure 113: South Asia & Pacific Market Value (USD Million) Analysis by Sales Channel, 2020-2035
  • Figure 114: South Asia & Pacific Market Volume (Units) Analysis by Sales Channel, 2020-2035
  • Figure 115: South Asia & Pacific Market Value Share (%) and BPS Analysis by Sales Channel, 2025-2035
  • Figure 116: South Asia & Pacific Market Y-o-Y Growth (%) Projections by Sales Channel, 2025-2035
  • Figure 117: South Asia & Pacific Market Attractiveness by Drug Class, 2025-2035
  • Figure 118: South Asia & Pacific Market Attractiveness by Indication, 2025-2035
  • Figure 119: South Asia & Pacific Market Attractiveness by Sales Channel, 2025-2035
  • Figure 120: South Asia & Pacific Market Attractiveness by Country, 2025-2035
  • Figure 121: Latin America Market Value (USD Million) by Drug Class, 2025-2035
  • Figure 122: Latin America Market Value (USD Million) by Indication, 2025-2035
  • Figure 123: Latin America Market Value (USD Million) by Sales Channel, 2025-2035
  • Figure 124: Latin America Market Value (USD Million) by Country, 2025-2035
  • Figure 125: Latin America Market Value (USD Million) Analysis by Country, 2020-2035
  • Figure 126: Latin America Market Volume (Units) Analysis by Country, 2020-2035
  • Figure 127: Latin America Market Value Share (%) and BPS Analysis by Country, 2025-2035
  • Figure 128: Latin America Market Y-o-Y Growth (%) Projections by Country, 2025-2035
  • Figure 129: Latin America Market Value (USD Million) Analysis by Drug Class, 2020-2035
  • Figure 130: Latin America Market Volume (Units) Analysis by Drug Class, 2020-2035
  • Figure 131: Latin America Market Value Share (%) and BPS Analysis by Drug Class, 2025-2035
  • Figure 132: Latin America Market Y-o-Y Growth (%) Projections by Drug Class, 2025-2035
  • Figure 133: Latin America Market Value (USD Million) Analysis by Indication, 2020-2035
  • Figure 134: Latin America Market Volume (Units) Analysis by Indication, 2020-2035
  • Figure 135: Latin America Market Value Share (%) and BPS Analysis by Indication, 2025-2035
  • Figure 136: Latin America Market Y-o-Y Growth (%) Projections by Indication, 2025-2035
  • Figure 137: Latin America Market Value (USD Million) Analysis by Sales Channel, 2020-2035
  • Figure 138: Latin America Market Volume (Units) Analysis by Sales Channel, 2020-2035
  • Figure 139: Latin America Market Value Share (%) and BPS Analysis by Sales Channel, 2025-2035
  • Figure 140: Latin America Market Y-o-Y Growth (%) Projections by Sales Channel, 2025-2035
  • Figure 141: Latin America Market Attractiveness by Drug Class, 2025-2035
  • Figure 142: Latin America Market Attractiveness by Indication, 2025-2035
  • Figure 143: Latin America Market Attractiveness by Sales Channel, 2025-2035
  • Figure 144: Latin America Market Attractiveness by Country, 2025-2035
  • Figure 145: Middle East & Africa Market Value (USD Million) by Drug Class, 2025-2035
  • Figure 146: Middle East & Africa Market Value (USD Million) by Indication, 2025-2035
  • Figure 147: Middle East & Africa Market Value (USD Million) by Sales Channel, 2025-2035
  • Figure 148: Middle East & Africa Market Value (USD Million) by Country, 2025-2035
  • Figure 149: Middle East & Africa Market Value (USD Million) Analysis by Country, 2020-2035
  • Figure 150: Middle East & Africa Market Volume (Units) Analysis by Country, 2020-2035

Frequently Asked Questions

How big is the psychotherapeutic combinations market in 2025?

The global psychotherapeutic combinations market is valued at USD 805.6 million in 2025.

What will be the size of psychotherapeutic combinations market in 2035?

The size for the psychotherapeutic combinations market is projected to reach USD 1,376.1 million by 2035.

How much will be the psychotherapeutic combinations market growth between 2025 and 2035?

The psychotherapeutic combinations market is expected to grow at a 5.5% CAGR between 2025 and 2035.

What are the key combination type segments in the psychotherapeutic combinations market?

The key combination type segments in the psychotherapeutic combinations market are antidepressant + antipsychotic combinations, anxiolytic + antidepressant combinations, and mood stabilizer + antipsychotic combinations.

Which combination type segment is expected to contribute significant share in the psychotherapeutic combinations market in 2025?

In terms of combination type, antidepressant + antipsychotic combinations segment is set to command 46.7% share in the psychotherapeutic combinations market in 2025.

Explore Similar Insights

Future Market Insights

Psychotherapeutic Combinations Market

Chat With

MaRIA

Hi There, I am MaRIA, Your Market Research Intelligence Assistant. How may I help you?