At-Home Therapeutic Beauty Devices Market Size, Share, and Forecast Outlook 2025 to 2035

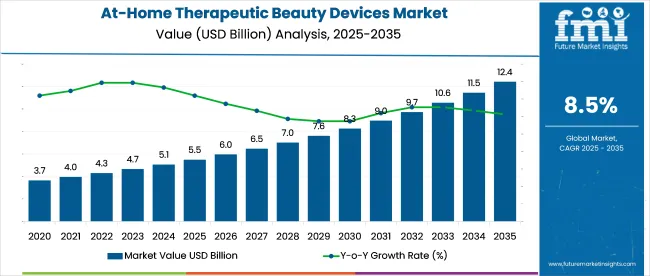
The at-home therapeutic beauty devices market is projected to reach USD 12.4 billion by 2035, advancing from USD 5.5 billion in 2025 at 8.5% CAGR.
Quick Stats of the At-Home Therapeutic Beauty Devices Market

  • Industry Value (2025): USD 5.5 billion
  • Forecast Value (2035): USD 12.4 billion
  • Global CAGR (2025 to 2035): 8.5%
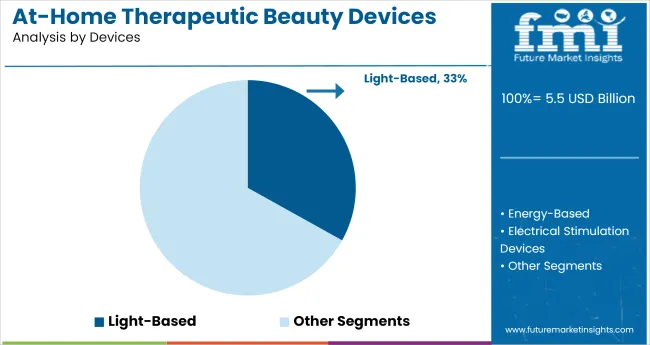
  • Leading Segment in 2025: Light-Based Devices (~33% share)
  • Key Growth Region: South Asia & Pacific
  • Key Players: Panasonic Corporation, NuFACE, L’Oréal, Beurer GmbH, FOREO,

At Home Therapeutic Beauty Devices Market Value Analysis

Metric Value
Industry Size (2025E) USD 5.5 billion
Industry Value (2035F) USD 12.4 billion
CAGR (2025 to 2035) 8.5%

Growth is being concentrated in upper-income urban households where dermatological service gaps, inflation-adjusted procedure costs, and time constraints have driven self-directed skincare. LED therapy masks, microcurrent toners, and RF-based lifting tools are being absorbed into daily routines not as luxuries, but as replacements for scheduled in-clinic care. USA buyers, contributing 29% of global revenue, are favoring FDA-cleared devices with condition-specific claims over general-use models.

At-home therapeutic beauty devices account for approximately 20-25% of the overall beauty devices market and make up nearly 100% of the home-use beauty devices category. Within the personal care appliances segment, their share ranges from 50-60%, reflecting dominance in grooming and skincare tools intended for individual use.

In the skincare and treatment devices category, these devices contribute about 55-80%, driven by growing consumer demand for non-invasive, at-home solutions. Within the expansive beauty and personal care products market, their presence remains limited to just 1-3%, signaling a niche but fast-growing segment.

In October 2024, NuFACE introduced the Trinity+ Complete, a next-generation at-home facial toning device that combines microcurrent therapy with red light technology. Designed for non-invasive skin rejuvenation, the device features three magnetized attachments to target facial muscles, smooth wrinkles, and stimulate ATP production.

It incorporates 36 red LED lights and delivers up to 425 microamps through precision microcurrent tips. Safety mechanisms automatically power down the unit after 20 minutes. “As we get older, we need to exercise more to keep our bodies toned and tight,” says NuFACE co-founder and CEO Tera Peterson. “The same concept goes for delicate facial muscles.”

Analyzing  At-Home Therapeutic Beauty Devices Market by Top Investment Segments

Athome therapeutic beauty devices market is segmented by product type into lightbased devices, radiofrequency devices, ultrasonic devices, and microneedle tools. By application, segmentation covers skin rejuvenation & antiaging, acne treatment, hair removal, pigmentation correction, and others.

Sales channels include ecommerce/brand websites, specialty stores, pharmacies, and multibrand retail chains. Geographic coverage spans North America, Latin America, Western Europe, Eastern Europe, East Asia, South Asia & Pacific, Central Asia.
LightBased Devices Lead the Product Category

At Home Therapeutic Beauty Devices Market Analysis By Devices

Lightbased devices captured 30.2% share in 2024 and are projected to reach 33% in 2025, a 2.9point rise. Consumers are increasingly choosing LED, IPL, and low-level laser devices for at-home use due to ease of application and minimal downtime. Advances in wavelength control and device ergonomics have increased the adoption rate, particularly among users aged 30-55.

CurrentBody’s LED Light Therapy Mask, experienced a 22% increase in unit sales across North America in 2024. The product’s effectiveness in reducing fine lines and hyperpigmentation has been supported by dermatologist-backed studies and high-profile media coverage, making it a category driver.
  • CurrentBody expanded its LED mask line and introduced appguided usage logs.
  • Silk’n upgraded its multifunction IPL devices with adjustable fluence settings.
  • Lumenis licensed compact laser modules to premium personalcare brands.

Skin Rejuvenation & AntiAging Dominate Applications

At Home Therapeutic Beauty Devices Market Analysis By Application

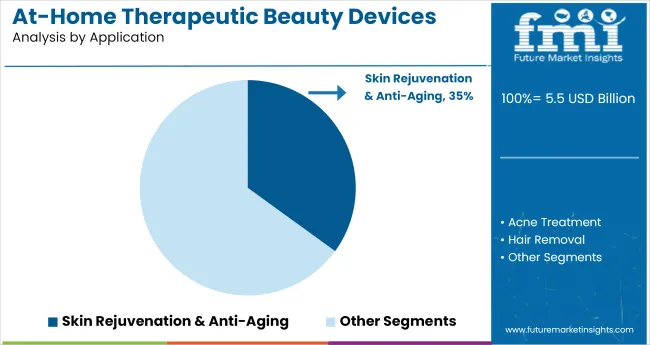
Skin rejuvenation & anti-aging commanded a 32.1% share in 2024 and is set to reach 35.0% in 2025, a 2.9 point increase. Consumer focus on maintaining facial tone, reducing wrinkles, and improving skin elasticity is driving the segment.

Midlife consumers in developed economies are using these devices as an alternative to dermatological procedures, often with weekly routines supported by apps and guided treatments.NuFACE Trinity, has become a preferred option among USA women aged 35-54. Clinical results from NuFACE suggest measurable improvements in cheek contour and jawline definition within 60 days of use, explaining its continued demand across dermatology retailers and DTC platforms.
  • NuFACE scaled microcurrent devices targeting facial contouring for midlife users.
  • ZIIP launched conductivegel autoreplenishment plans to endure
  • routine adherence.
  • Panasonic Beauty rolled out homeuse RF wands with dermatologistverified protocols.

ECommerce / Brand Websites Propel Sales

At Home Therapeutic Beauty Devices Market Analysis By Sales Channel

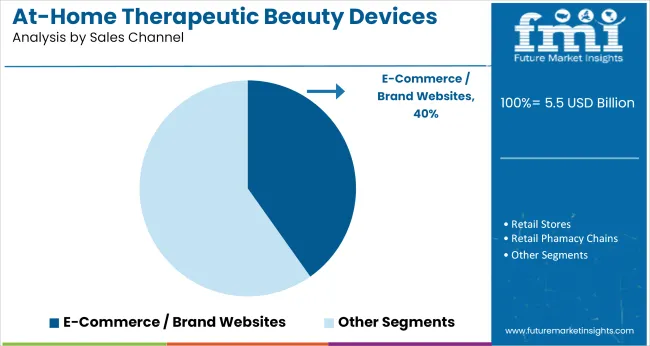
Ecommerce and direct brand websites held 37% share in 2024 and are forecast to rise to 40% in 2025, a 3.2point gain. Higher trust in official platforms for product authenticity, exclusive bundles, video instructions, and access to brand support is driving this shift.

Consumers increasingly prefer DTC channels due to convenience, discounts, and loyalty integrations that are not typically available through third-party marketplaces.Dermaflash’s Replenishment Subscription Program contributed to a 28% year-on-year increase in customer retention in 2024. The company’s bundled offers, automated shipments, and educational tools via its official site have helped secure long-term customer engagement in the anti-aging segment.

  • Tripollar derives 60% of its global revenue from its branded web stores backed by video guides.
  • Dermaflash reports doubledigit growth for subscription bundles ordered via its DTC portal.
  • Dr. Dennis Gross Skincare drives exclusive kit launches and virtual consultations through its eshop.

Top At-Home Therapeutic Beauty Devices Market Dynamics

The at-home therapeutic beauty devices industry is being driven by advancements in technology and increasing consumer demand for personalized skincare solutions. Factors such as rising disposable incomes, technological innovations, and the influence of social media on consumer behavior are fueling this growth.

Drivers of Growth in At-Home Therapeutic Beauty Devices

The industry experienced strong growth, with global sales increasing by 18.5% YoY in H1 2025. Advancements in LED therapy, microcurrent, and radiofrequency (RF) technologies were key drivers. In North America, LED device sales rose by 22%, and microcurrent devices saw a 17% demand increase. Consumer adoption grew, with 63% of surveyed consumers preferring at-home devices for their convenience and cost-effectiveness. Social media influence also contributed, driving a 25% surge in online sales.

  • Global sales growth of at-home therapeutic beauty devices surged by 18.5% YoY in H1 2025, driven by technological advancements.
  • North America saw a 22% increase in LED device sales and a 17% rise in microcurrent device demand from the previous year.
  • Consumer adoption grew as 63% of surveyed consumers preferred at-home devices due to convenience and cost-effectiveness.

Key Challenges Slowing Industry Growth

The industry faces several challenges, including high initial costs, with premium devices priced at an average of USD 500 in 2025. Safety concerns persist, affecting 15% of users, as reports of skin irritation and burns from improper usage continue to rise. The regulatory hurdles are slowing industry growth, with 12% of new beauty devices in the EU facing approval delays. These challenges are impacting broader adoption, though improvements in safety standards and regulatory processes are expected to mitigate them.
  • High initial costs remain a significant barrier, with premium devices priced at an average of USD 500.
  • Safety concerns affect 15% of users, with reports of skin irritation and burns from improper device usage.
  • Regulatory hurdles delayed the approval of 12% of new beauty devices in the EU, slowing market entry.

Top Countries Developing, Personalizing and Scaling At-Home Therapeutic Beauty Devices

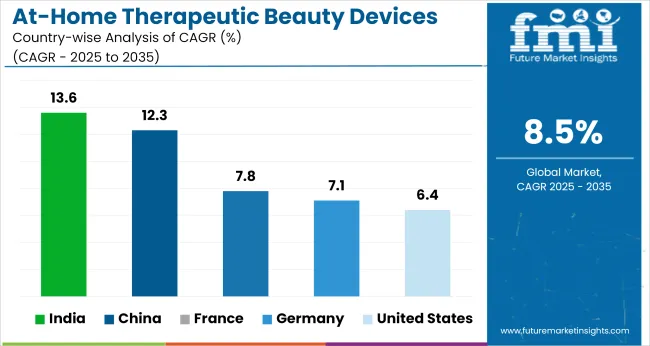
At Home Therapeutic Beauty Devices Market Cagr Analysis By Country

Countries CAGR (2025 to 2035)
United States 6.4%
Germany 7.1%
China 12.3%
France 7.8%
India 13.6%

The global at-home therapeutic beauty devices market is expanding at 8.5% CAGR from 2025 to 2035. India, a BRICS member, leads with 13.6%, followed by China at 12.3%, both driven by device affordability and growing e-commerce penetration.

France and Germany, part of the OECD, show moderate growth at 7.8% and 7.1%, supported by aging users but limited by CE certification cycles. The United States, also in the OECD, trails at 6.4% due to market saturation and low subscription retention. Diverging growth reflects income sensitivity, policy timelines, and digital readiness.

This report analyses over 40 countries, with five key markets shared for reference.
Growth Outlook of the United States At-Home Therapeutic Beauty Devices Market

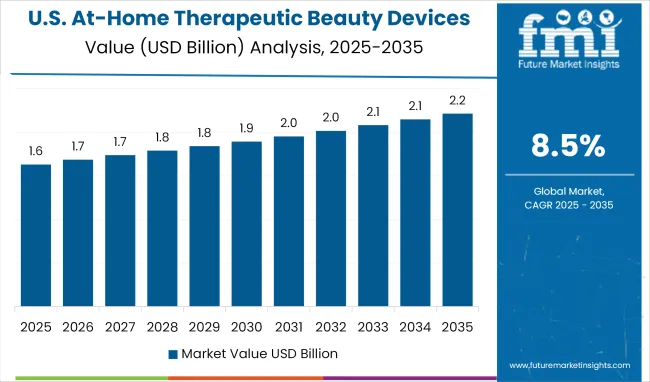
At Home Therapeutic Beauty Devices Market Country Value Analysis

The USA market evolved from general-purpose facial tools and mass retail distribution during 2020 to 2024 toward more clinical-grade offerings between 2025 to 2035. A CAGR of 6.4% has been projected for the forecast period, compared to 4.2% in the historical phase. Initial demand was driven by basic cleansing and anti-aging tools available through pharmacies and wellness retailers.

However, the shift toward dermatologist-endorsed therapeutic routines, including LED and microcurrent devices, began reshaping consumer preference. Targeting women aged 35-64, new purchasing behavior was linked to telehealth-driven prescriptions and diagnostic-linked product recommendations.

  • 68% of purchases in 2025 were made by women over age 35
  • LED therapy devices accounted for 42% of USA sales in 2027
  • Telehealth referrals increased by 2.3× from 2024 to 2028

In-Depth Analysis of the At-Home Therapeutic Beauty Devices Market in Germany

Between 2020 to 2024, German consumers mainly opted for mono-functional cleansing and toning tools. The market grew at 4.9% during this phase. From 2025, preference shifted toward multifunctional therapeutic equipment such as microcurrent devices, contributing to a projected CAGR of 7.1%.

Purchase intent was influenced by safety certifications and energy efficiency. The integration of devices into public and private wellness initiatives aligned with rising trust in CE-certified tools. The industry has shown a consolidation in urban centers, especially Berlin and Munich, supported by local manufacturing incentives.

  • Multifunctional devices held 37% of purchases in 2025
  • Berlin and Munich contributed 44% of revenue in 2027
  • 65% of new entrants earned EU-compliant safety certification in 2026

China At-Home Therapeutic Beauty Devices Market Growth Outlook

From 2020 to 2024, demand in China was dominated by basic imported products sold through cross-border platforms, growing at a CAGR of 8.2%. In contrast, 2025-2035 marks a period of domestic brand ascendancy, driving the market at an estimated 12.3% CAGR. Growth has been enabled by integration with mobile apps, AI diagnostics, and livestream commerce.

The industry is expanding across middle-income consumers seeking non-invasive skin therapies. Regulatory approvals for advanced modalities, such as RF and IPL, have unlocked high-velocity distribution across both public and private healthcare networks.

  • 52% of 2026 purchases were livestream-driven
  • AI-enabled devices generated 29% of 2027 segment revenue
  • Over 500 new SKUs launched by local players between 2025 to 2035

France At-Home Therapeutic Beauty Devices Market Forecast

France 2020-2024 phase, which posted a 5.2% CAGR, was shaped by cosmetic-led demand centered in Paris and Lyon. The next decade, with a projected CAGR of 7.8%, shifts toward medically endorsed home-use devices embedded in cosmeceutical bundles.

Usage has extended to scalp and rosacea therapies, with strong trust built around CE Class II certifications. Public health agencies have supported awareness campaigns, encouraging broader uptake among aging consumers seeking non-surgical anti-aging regimens.

  • Cosmeceutical bundles tripled from 2025 to 2029
  • Scalp therapy tools made up 24% of the 2028 industry share
  • 80% of devices sold in 2027 met CE Class II standards

India At-Home Therapeutic Beauty Devices Market Growth Trajectory

In 2020-2024, Indian demand was limited to urban elite users purchasing imported LED masks and tools via e-commerce, supporting a CAGR of 9.5%. Between 2025 to 2035, expansion has been driven by Ayurveda-integrated brands and regional D2C players offering bundled subscriptions, accelerating growth to 13.6%.

Affordability has improved due to local manufacturing in Gujarat and Karnataka. Adoption is rising sharply outside tier-1 cities, with rising interest in ultrasonic and RF-based facial tools for regular home use.
  • LED masks contributed 46% of online sales in 2026
  • Shipments to non-metro areas rose 4.5× from 2025 to 2029
  • Over 70 Indian brands launched new devices between 2024 to 2027

Leading Companies in At-Home Therapeutic Beauty Devices Market

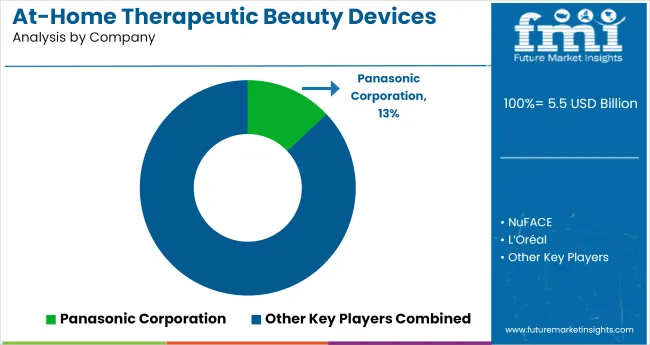
At Home Therapeutic Beauty Devices Market Analysis By Company

The at-home therapeutic beauty devices industry is moderately consolidated, featuring a mix of global conglomerates and tech-forward specialists. Panasonic Corporation, L’Oréal, and Koninklijke Philips N.V. lead the industry with diversified wellness portfolios and global distribution networks, supporting a steady stream of infrared, microcurrent, and LED-based devices.

NuFACE, YA-MAN, and Nu Skin Enterprises focus on facial toning and anti-aging applications, building loyal consumer bases via DTC channels and subscription models.

FOREO and Solawave have emerged as disruptors through influencer-led promoting and minimalist designs targeted at younger demographics. Regional players like Beurer GmbH and The Beauty Tech Group are scaling their footprint by offering FDA-cleared or CE-certified multifunctional tools.

Technology upgrades,particularly in ultrasonic, blue light therapy, and radiofrequency,remain critical to differentiation. Competitive strategies now center on modular devices, refillable cartridges, and clinical validation to build consumer trust and extend brand lifetime value in the self-care ecosystem.

Recent Industry News

  • In March 2025, Panasonic introduced the Arc 5 Palm Shaver, a compact device made with Nagori mineral-based plastic. The shaver delivers 70,000 cross-cuts per minute and adjusts to shaving resistance. Despite its $330 price and modest battery performance, WIRED praised the ergonomic design and shaving precision, citing its premium positioning in the men’s grooming segment.
  • In March 2025, Foreo launched the Luna 4 Hair, its first scalp-care device aimed at users experiencing flaking and thinning. Within two weeks of use, testers reported visibly thicker, shinier hair with reduced itchiness. The product scored 8/10 in consumer reviews across platforms such as The Quality Edit, Glossy, and The Sun.

Leading Players in At-Home Therapeutic Beauty Devices Market

  • Panasonic Corporation
  • NuFACE
  • L’Oréal
  • Beurer GmbH
  • FOREO
  • Koninklijke Philips N.V.
  • Solawave
  • Nu Skin Enterprises Inc
  • The Beauty Tech Group
  • YA-MAN
  • Cynosure
  • Syneron Candela

Research Coverage and Scope Summary

Report Attributes Details
Industry Size (2025) USD 5.5 billion
Projected Industry Size (2035) USD 12.4 billion
CAGR (2025 to 2035) 8.5%
Base Year for Estimation 2024
Historical Period 2020 to 2024
Projections Period 2025 to 2035
Quantitative Units USD billion for value and million units for volume
Devices Analyzed (Segment 1) Light-Based, LED Therapy Devices, IPL (Intense Pulsed Light) Devices, Laser Devices, Energy-Based Devices, Electrical Stimulation Devices, Microdermabrasion Devices, Derma Rollers or Microneedling Devices, Massage Devices, Thermal Devices, Combination Devices
Applications Analyzed (Segment 2) Skin Rejuvenation and Anti-Aging, Acne Treatment, Hair Removal, Hair Regrowth, Body Contouring, Pigmentation Treatment, Scar Reduction, Eye Care
Sales Channels Analyzed (Segment 3) Retail Stores, Retail Pharmacy Chains, Supermarket and Departmental Stores, E-commerce or Brand Websites, Direct Sales
Regions Covered North America, Latin America, Western Europe, Eastern Europe, East Asia, South Asia & Pacific
Countries Covered United States, Canada, Germany, United Kingdom, France, Italy, Spain, China, India, Japan, South Korea, Australia, Brazil, Mexico, Argentina, Saudi Arabia, UAE, South Africa
Key Players Panasonic Corporation, NuFACE, L’Oréal, Beurer GmbH, FOREO, Koninklijke Philips N.V., Solawave, Nu Skin Enterprises Inc, The Beauty Tech Group, YA-MAN, Cynosure, Syneron Candela
Additional Attributes Dollar sales by device type and application, rising demand for LED and IPL-based therapies, e-commerce expansion in beauty tech, device bundling for multi-functional skincare, regional consumer preference patterns

Key Segments

By Devices:

The industry includes light-based, LED therapy devices, IPL (intense pulsed light) devices, laser devices, energy-based devices, electrical stimulation devices, microdermabrasion devices, derma rollers or microneedling devices, massage devices, thermal devices, and combination devices.

By Application:

The industry covers skin rejuvenation and anti-aging, acne treatment, hair removal, hair regrowth, body contouring, pigmentation treatment, scar reduction, and eye care.

By Sales Channel:

These products are distributed through retail stores, retail pharmacy chains, supermarket and departmental stores, e-commerce or brand websites, and direct sales.

By Region:

The industry is segmented as North America, Latin America, Western Europe, Eastern Europe, East Asia, South Asia & Pacific.

Table of Content

  1. Executive Summary
    • Global Market Outlook
    • Demand-side Trends
    • Supply-side Trends
    • Technology Roadmap Analysis
    • Analysis and Recommendations
  2. Market Overview
    • Market Coverage / Taxonomy
    • Market Definition / Scope / Limitations
  3. Market Background
    • Market Dynamics
      • Drivers
      • Restraints
      • Opportunity
      • Trends
    • Scenario Forecast
      • Demand in Optimistic Scenario
      • Demand in Likely Scenario
      • Demand in Conservative Scenario
    • Opportunity Map Analysis
    • Product Life Cycle Analysis
    • Supply Chain Analysis
      • Supply Side Participants and their Roles
        • Producers
        • Mid-Level Participants (Traders/ Agents/ Brokers)
        • Wholesalers and Distributors
      • Value Added and Value Created at Node in the Supply Chain
      • List of Raw Material Suppliers
      • List of Existing and Potential Buyer’s
    • Investment Feasibility Matrix
    • Value Chain Analysis
      • Profit Margin Analysis
      • Wholesalers and Distributors
      • Retailers
    • PESTLE and Porter’s Analysis
    • Regulatory Landscape
      • By Key Regions
      • By Key Countries
    • Regional Parent Market Outlook
    • Production and Consumption Statistics
    • Import and Export Statistics
  4. Global Market Analysis 2020 to 2024 and Forecast, 2025 to 2035
    • Historical Market Size Value (USD Billion) & Volume (Million Units) Analysis, 2020 to 2024
    • Current and Future Market Size Value (USD Billion) & Volume (Million Units) Projections, 2025 to 2035
      • Y-o-Y Growth Trend Analysis
      • Absolute $ Opportunity Analysis
  5. Global Market Pricing Analysis 2020 to 2024 and Forecast 2025 to 2035
  6. Global Market Analysis 2020 to 2024 and Forecast 2025 to 2035, By Devices
    • Introduction / Key Findings
    • Historical Market Size Value (USD Billion) & Volume (Million Units) Analysis by Devices, 2020 to 2024
    • Current and Future Market Size Value (USD Billion) & Volume (Million Units) Analysis and Forecast by Devices, 2025 to 2035
      • Light-Based
        • LED Therapy Devices
        • IPL (Intense Pulsed Light) Devices
        • Laser Devices
      • Energy-Based
      • Electrical Stimulation Devices
      • Microdermabrasion Devices
      • Derma Rollers / Microneedling Devices
      • Massage Devices
      • Thermal Devices
      • Combination Devices
    • Y-o-Y Growth Trend Analysis By Devices, 2020 to 2024
    • Absolute $ Opportunity Analysis By Devices, 2025 to 2035
  7. Global Market Analysis 2020 to 2024 and Forecast 2025 to 2035, By Application
    • Introduction / Key Findings
    • Historical Market Size Value (USD Billion) & Volume (Million Units) Analysis By Application, 2020 to 2024
    • Current and Future Market Size Value (USD Billion) & Volume (Million Units) Analysis and Forecast By Application, 2025 to 2035
      • Skin Rejuvenation & Anti-Aging
      • Acne Treatment
      • Hair Removal
      • Hair Regrowth
      • Body Contouring
      • Pigmentation Treatment
      • Scar Reduction
      • Eye Care
    • Y-o-Y Growth Trend Analysis By Application, 2020 to 2024
    • Absolute $ Opportunity Analysis By Application, 2025 to 2035
  8. Global Market Analysis 2020 to 2024 and Forecast 2025 to 2035, By Sales Channel
    • Introduction / Key Findings
    • Historical Market Size Value (USD Billion) & Volume (Million Units) Analysis By Sales Channel, 2020 to 2024
    • Current and Future Market Size Value (USD Billion) & Volume (Million Units) Analysis and Forecast By Sales Channel, 2025 to 2035
      • Retail Stores
      • Retail Pharmacy Chains
      • Supermarket & Departmental Stores
      • E-Commerce / Brand Websites
      • Direct Sales
    • Y-o-Y Growth Trend Analysis By Sales Channel, 2020 to 2024
    • Absolute $ Opportunity Analysis By Sales Channel, 2025 to 2035
  9. Global Market Analysis 2020 to 2024 and Forecast 2025 to 2035, By Region
    • Introduction
    • Historical Market Size Value (USD Billion) & Volume (Million Units) Analysis By Region, 2020 to 2024
    • Current Market Size Value (USD Billion) & Volume (Million Units) Analysis and Forecast By Region, 2025 to 2035
      • North America
      • Latin America
      • Western Europe
      • Eastern Europe
      • East Asia
      • South Asia & Pacific
      • Middle East and Africa
    • Market Attractiveness Analysis By Region
  10. North America Market Analysis 2020 to 2024 and Forecast 2025 to 2035, By Country
    • Historical Market Size Value (USD Billion) & Volume (Million Units) Trend Analysis By Market Taxonomy, 2020 to 2024
    • Market Size Value (USD Billion) & Volume (Million Units) Forecast By Market Taxonomy, 2025 to 2035
      • By Country
        • USA
        • Canada
        • Mexico
      • By Devices
      • By Application
      • By Sales Channel
    • Market Attractiveness Analysis
      • By Country
      • By Devices
      • By Application
      • By Sales Channel
    • Key Takeaways
  11. Latin America Market Analysis 2020 to 2024 and Forecast 2025 to 2035, By Country
    • Historical Market Size Value (USD Billion) & Volume (Million Units) Trend Analysis By Market Taxonomy, 2020 to 2024
    • Market Size Value (USD Billion) & Volume (Million Units) Forecast By Market Taxonomy, 2025 to 2035
      • By Country
        • Brazil
        • Argentina
        • Rest of LATAM
      • By Devices
      • By Application
      • By Sales Channel
    • Market Attractiveness Analysis
      • By Country
      • By Devices
      • By Application
      • By Sales Channel
    • Key Takeaways
  12. Western Europe Market Analysis 2020 to 2024 and Forecast 2025 to 2035, By Country
    • Historical Market Size Value (USD Billion) & Volume (Million Units) Trend Analysis By Market Taxonomy, 2020 to 2024
    • Market Size Value (USD Billion) & Volume (Million Units) Forecast By Market Taxonomy, 2025 to 2035
      • By Country
        • Germany
        • Italy
        • France
        • UK
        • Spain
        • BENELUX
        • Nordic
        • Rest of W.Europe
      • By Devices
      • By Application
      • By Sales Channel
    • Market Attractiveness Analysis
      • By Country
      • By Devices
      • By Application
      • By Sales Channel
    • Key Takeaways
  13. Eastern Europe Market Analysis 2020 to 2024 and Forecast 2025 to 2035, By Country
    • Historical Market Size Value (USD Billion) & Volume (Million Units) Trend Analysis By Market Taxonomy, 2020 to 2024
    • Market Size Value (USD Billion) & Volume (Million Units) Forecast By Market Taxonomy, 2025 to 2035
      • By Country
        • Russia
        • Hungary
        • Poland
        • Balkan & Baltics
        • Rest of E. Europe
      • By Devices
      • By Application
      • By Sales Channel
    • Market Attractiveness Analysis
      • By Country
      • By Devices
      • By Application
      • By Sales Channel
    • Key Takeaways
  14. East Asia Market Analysis 2020 to 2024 and Forecast 2025 to 2035, By Country
    • Historical Market Size Value (USD Billion) & Volume (Million Units) Trend Analysis By Market Taxonomy, 2020 to 2024
    • Market Size Value (USD Billion) & Volume (Million Units) Forecast By Market Taxonomy, 2025 to 2035
      • By Country
        • China
        • Japan
        • South Korea
      • By Devices
      • By Application
      • By Sales Channel
    • Market Attractiveness Analysis
      • By Country
      • By Devices
      • By Application
      • By Sales Channel
    • Key Takeaways
  15. South Asia & Pacific Market Analysis 2020 to 2024 and Forecast 2025 to 2035, By Country
    • Historical Market Size Value (USD Billion) & Volume (Million Units) Trend Analysis By Market Taxonomy, 2020 to 2024
    • Market Size Value (USD Billion) & Volume (Million Units) Forecast By Market Taxonomy, 2025 to 2035
      • By Country
        • India
        • Australia & New Zealand
        • ASEAN
        • Rest of SAP
      • By Devices
      • By Application
      • By Sales Channel
    • Market Attractiveness Analysis
      • By Country
      • By Devices
      • By Application
      • By Sales Channel
    • Key Takeaways
  16. Middle East and Africa Market Analysis 2020 to 2024 and Forecast 2025 to 2035, By Country
    • Historical Market Size Value (USD Billion) & Volume (Million Units) Trend Analysis By Market Taxonomy, 2020 to 2024
    • Market Size Value (USD Billion) & Volume (Million Units) Forecast By Market Taxonomy, 2025 to 2035
      • By Country
        • GCC Countries
        • Northern Africa
        • South Africa
        • Turkiye
        • Rest of MEA
      • By Devices
      • By Application
      • By Sales Channel
    • Market Attractiveness Analysis
      • By Country
      • By Devices
      • By Application
      • By Sales Channel
    • Key Takeaways
  17. Key Countries Market Analysis
    • USA
      • Pricing Analysis
      • Market Share Analysis, 2024
        • By Devices
        • By Application
        • By Sales Channel
    • Canada
      • Pricing Analysis
      • Market Share Analysis, 2024
        • By Devices
        • By Application
        • By Sales Channel
    • Brazil
      • Pricing Analysis
      • Market Share Analysis, 2024
        • By Devices
        • By Application
        • By Sales Channel
    • Mexico
      • Pricing Analysis
      • Market Share Analysis, 2024
        • By Devices
        • By Application
        • By Sales Channel
    • Argentina
      • Pricing Analysis
      • Market Share Analysis, 2024
        • By Devices
        • By Application
        • By Sales Channel
  18. Market Structure Analysis
    • Competition Dashboard
    • Competition Benchmarking
    • Market Share Analysis of Top Players
      • By Regional
      • By Devices
      • By Application
      • By Sales Channel
  19. Competition Analysis
    • Competition Deep Dive
      • Panasonic Corporation
        • Overview
        • Product Portfolio
        • Profitability by Market Segments (Product/Age /Sales Channel/Region)
        • Sales Footprint
        • Strategy Overview
          • Marketing Strategy
          • Product Strategy
          • Channel Strategy
      • NuFACE
        • Overview
        • Product Portfolio
        • Profitability by Market Segments (Product/Age /Sales Channel/Region)
        • Sales Footprint
        • Strategy Overview
          • Marketing Strategy
          • Product Strategy
          • Channel Strategy
      • L’Oréal
        • Overview
        • Product Portfolio
        • Profitability by Market Segments (Product/Age /Sales Channel/Region)
        • Sales Footprint
        • Strategy Overview
          • Marketing Strategy
          • Product Strategy
          • Channel Strategy
      • Beurer GmbH
        • Overview
        • Product Portfolio
        • Profitability by Market Segments (Product/Age /Sales Channel/Region)
        • Sales Footprint
        • Strategy Overview
          • Marketing Strategy
          • Product Strategy
          • Channel Strategy
      • FOREO
        • Overview
        • Product Portfolio
        • Profitability by Market Segments (Product/Age /Sales Channel/Region)
        • Sales Footprint
        • Strategy Overview
          • Marketing Strategy
          • Product Strategy
          • Channel Strategy
      • Koninklijke Philips N.V.
        • Overview
        • Product Portfolio
        • Profitability by Market Segments (Product/Age /Sales Channel/Region)
        • Sales Footprint
        • Strategy Overview
          • Marketing Strategy
          • Product Strategy
          • Channel Strategy
      • Solawave
        • Overview
        • Product Portfolio
        • Profitability by Market Segments (Product/Age /Sales Channel/Region)
        • Sales Footprint
        • Strategy Overview
          • Marketing Strategy
          • Product Strategy
          • Channel Strategy
      • Nu Skin Enterprises Inc
        • Overview
        • Product Portfolio
        • Profitability by Market Segments (Product/Age /Sales Channel/Region)
        • Sales Footprint
        • Strategy Overview
          • Marketing Strategy
          • Product Strategy
          • Channel Strategy
      • The Beauty Tech Group
        • Overview
        • Product Portfolio
        • Profitability by Market Segments (Product/Age /Sales Channel/Region)
        • Sales Footprint
        • Strategy Overview
          • Marketing Strategy
          • Product Strategy
          • Channel Strategy
      • YA-MAN
        • Overview
        • Product Portfolio
        • Profitability by Market Segments (Product/Age /Sales Channel/Region)
        • Sales Footprint
        • Strategy Overview
          • Marketing Strategy
          • Product Strategy
          • Channel Strategy
      • Cynosure
        • Overview
        • Product Portfolio
        • Profitability by Market Segments (Product/Age /Sales Channel/Region)
        • Sales Footprint
        • Strategy Overview
          • Marketing Strategy
          • Product Strategy
          • Channel Strategy
      • Syneron Candela
        • Overview
        • Product Portfolio
        • Profitability by Market Segments (Product/Age /Sales Channel/Region)
        • Sales Footprint
        • Strategy Overview
          • Marketing Strategy
          • Product Strategy
          • Channel Strategy
  20. Assumptions & Acronyms Used
  21. Research Methodology

List of Tables

  • Table 1: Global Market Value (USD Billion) Forecast by Region, 2020-2035
  • Table 2: Global Market Volume (Mn Units) Forecast by Region, 2020-2035
  • Table 3: Global Market Value (USD Billion) Forecast by Devices, 2020-2035
  • Table 4: Global Market Volume (Mn Units) Forecast by Devices, 2020-2035
  • Table 5: Global Market Value (USD Billion) Forecast by Application, 2020-2035
  • Table 6: Global Market Volume (Mn Units) Forecast by Application, 2020-2035
  • Table 7: Global Market Value (USD Billion) Forecast by Sales Channel, 2020-2035
  • Table 8: Global Market Volume (Mn Units) Forecast by Sales Channel, 2020-2035
  • Table 9: North America Market Value (USD Billion) Forecast by Country, 2020-2035
  • Table 10: North America Market Volume (Mn Units) Forecast by Country, 2020-2035
  • Table 11: North America Market Value (USD Billion) Forecast by Devices, 2020-2035
  • Table 12: North America Market Volume (Mn Units) Forecast by Devices, 2020-2035
  • Table 13: North America Market Value (USD Billion) Forecast by Application, 2020-2035
  • Table 14: North America Market Volume (Mn Units) Forecast by Application, 2020-2035
  • Table 15: North America Market Value (USD Billion) Forecast by Sales Channel, 2020-2035
  • Table 16: North America Market Volume (Mn Units) Forecast by Sales Channel, 2020-2035
  • Table 17: Latin America Market Value (USD Billion) Forecast by Country, 2020-2035
  • Table 18: Latin America Market Volume (Mn Units) Forecast by Country, 2020-2035
  • Table 19: Latin America Market Value (USD Billion) Forecast by Devices, 2020-2035
  • Table 20: Latin America Market Volume (Mn Units) Forecast by Devices, 2020-2035
  • Table 21: Latin America Market Value (USD Billion) Forecast by Application, 2020-2035
  • Table 22: Latin America Market Volume (Mn Units) Forecast by Application, 2020-2035
  • Table 23: Latin America Market Value (USD Billion) Forecast by Sales Channel, 2020-2035
  • Table 24: Latin America Market Volume (Mn Units) Forecast by Sales Channel, 2020-2035
  • Table 25: Western Europe Market Value (USD Billion) Forecast by Country, 2020-2035
  • Table 26: Western Europe Market Volume (Mn Units) Forecast by Country, 2020-2035
  • Table 27: Western Europe Market Value (USD Billion) Forecast by Devices, 2020-2035
  • Table 28: Western Europe Market Volume (Mn Units) Forecast by Devices, 2020-2035
  • Table 29: Western Europe Market Value (USD Billion) Forecast by Application, 2020-2035
  • Table 30: Western Europe Market Volume (Mn Units) Forecast by Application, 2020-2035
  • Table 31: Western Europe Market Value (USD Billion) Forecast by Sales Channel, 2020-2035
  • Table 32: Western Europe Market Volume (Mn Units) Forecast by Sales Channel, 2020-2035
  • Table 33: Eastern Europe Market Value (USD Billion) Forecast by Country, 2020-2035
  • Table 34: Eastern Europe Market Volume (Mn Units) Forecast by Country, 2020-2035
  • Table 35: Eastern Europe Market Value (USD Billion) Forecast by Devices, 2020-2035
  • Table 36: Eastern Europe Market Volume (Mn Units) Forecast by Devices, 2020-2035
  • Table 37: Eastern Europe Market Value (USD Billion) Forecast by Application, 2020-2035
  • Table 38: Eastern Europe Market Volume (Mn Units) Forecast by Application, 2020-2035
  • Table 39: Eastern Europe Market Value (USD Billion) Forecast by Sales Channel, 2020-2035
  • Table 40: Eastern Europe Market Volume (Mn Units) Forecast by Sales Channel, 2020-2035
  • Table 41: East Asia Market Value (USD Billion) Forecast by Country, 2020-2035
  • Table 42: East Asia Market Volume (Mn Units) Forecast by Country, 2020-2035
  • Table 43: East Asia Market Value (USD Billion) Forecast by Devices, 2020-2035
  • Table 44: East Asia Market Volume (Mn Units) Forecast by Devices, 2020-2035
  • Table 45: East Asia Market Value (USD Billion) Forecast by Application, 2020-2035
  • Table 46: East Asia Market Volume (Mn Units) Forecast by Application, 2020-2035
  • Table 47: East Asia Market Value (USD Billion) Forecast by Sales Channel, 2020-2035
  • Table 48: East Asia Market Volume (Mn Units) Forecast by Sales Channel, 2020-2035
  • Table 49: South Asia & Pacific Market Value (USD Billion) Forecast by Country, 2020-2035
  • Table 50: South Asia & Pacific Market Volume (Mn Units) Forecast by Country, 2020-2035
  • Table 51: South Asia & Pacific Market Value (USD Billion) Forecast by Devices, 2020-2035
  • Table 52: South Asia & Pacific Market Volume (Mn Units) Forecast by Devices, 2020-2035
  • Table 53: South Asia & Pacific Market Value (USD Billion) Forecast by Application, 2020-2035
  • Table 54: South Asia & Pacific Market Volume (Mn Units) Forecast by Application, 2020-2035
  • Table 55: South Asia & Pacific Market Value (USD Billion) Forecast by Sales Channel, 2020-2035
  • Table 56: South Asia & Pacific Market Volume (Mn Units) Forecast by Sales Channel, 2020-2035
  • Table 57: Middle East and Africa Market Value (USD Billion) Forecast by Country, 2020-2035
  • Table 58: Middle East and Africa Market Volume (Mn Units) Forecast by Country, 2020-2035
  • Table 59: Middle East and Africa Market Value (USD Billion) Forecast by Devices, 2020-2035
  • Table 60: Middle East and Africa Market Volume (Mn Units) Forecast by Devices, 2020-2035
  • Table 61: Middle East and Africa Market Value (USD Billion) Forecast by Application, 2020-2035
  • Table 62: Middle East and Africa Market Volume (Mn Units) Forecast by Application, 2020-2035
  • Table 63: Middle East and Africa Market Value (USD Billion) Forecast by Sales Channel, 2020-2035
  • Table 64: Middle East and Africa Market Volume (Mn Units) Forecast by Sales Channel, 2020-2035

List of Figures

  • Figure 1: Global Market Volume (Million Units) Forecast 2020-2035
  • Figure 2: Global Market Pricing Analysis
  • Figure 3: Global Market Value (USD Billion) Forecast 2020-2035
  • Figure 4: Global Market Value Share and BPS Analysis by Devices, 2025 and 2035
  • Figure 5: Global Market Y-o-Y Growth Comparison by Devices, 2025-2035
  • Figure 6: Global Market Attractiveness Analysis by Devices
  • Figure 7: Global Market Value Share and BPS Analysis by Application, 2025 and 2035
  • Figure 8: Global Market Y-o-Y Growth Comparison by Application, 2025-2035
  • Figure 9: Global Market Attractiveness Analysis by Application
  • Figure 10: Global Market Value Share and BPS Analysis by Sales Channel, 2025 and 2035
  • Figure 11: Global Market Y-o-Y Growth Comparison by Sales Channel, 2025-2035
  • Figure 12: Global Market Attractiveness Analysis by Sales Channel
  • Figure 13: Global Market Value (USD Billion) Share and BPS Analysis by Region, 2025 and 2035
  • Figure 14: Global Market Y-o-Y Growth Comparison by Region, 2025-2035
  • Figure 15: Global Market Attractiveness Analysis by Region
  • Figure 16: North America Market Incremental $ Opportunity, 2025-2035
  • Figure 17: Latin America Market Incremental $ Opportunity, 2025-2035
  • Figure 18: Western Europe Market Incremental $ Opportunity, 2025-2035
  • Figure 19: Eastern Europe Market Incremental $ Opportunity, 2025-2035
  • Figure 20: East Asia Market Incremental $ Opportunity, 2025-2035
  • Figure 21: South Asia & Pacific Market Incremental $ Opportunity, 2025-2035
  • Figure 22: Middle East and Africa Market Incremental $ Opportunity, 2025-2035
  • Figure 23: North America Market Value Share and BPS Analysis by Country, 2025 and 2035
  • Figure 24: North America Market Value Share and BPS Analysis by Devices, 2025 and 2035
  • Figure 25: North America Market Y-o-Y Growth Comparison by Devices, 2025-2035
  • Figure 26: North America Market Attractiveness Analysis by Devices
  • Figure 27: North America Market Value Share and BPS Analysis by Application, 2025 and 2035
  • Figure 28: North America Market Y-o-Y Growth Comparison by Application, 2025-2035
  • Figure 29: North America Market Attractiveness Analysis by Application
  • Figure 30: North America Market Value Share and BPS Analysis by Sales Channel, 2025 and 2035
  • Figure 31: North America Market Y-o-Y Growth Comparison by Sales Channel, 2025-2035
  • Figure 32: North America Market Attractiveness Analysis by Sales Channel
  • Figure 33: Latin America Market Value Share and BPS Analysis by Country, 2025 and 2035
  • Figure 34: Latin America Market Value Share and BPS Analysis by Devices, 2025 and 2035
  • Figure 35: Latin America Market Y-o-Y Growth Comparison by Devices, 2025-2035
  • Figure 36: Latin America Market Attractiveness Analysis by Devices
  • Figure 37: Latin America Market Value Share and BPS Analysis by Application, 2025 and 2035
  • Figure 38: Latin America Market Y-o-Y Growth Comparison by Application, 2025-2035
  • Figure 39: Latin America Market Attractiveness Analysis by Application
  • Figure 40: Latin America Market Value Share and BPS Analysis by Sales Channel, 2025 and 2035
  • Figure 41: Latin America Market Y-o-Y Growth Comparison by Sales Channel, 2025-2035
  • Figure 42: Latin America Market Attractiveness Analysis by Sales Channel
  • Figure 43: Western Europe Market Value Share and BPS Analysis by Country, 2025 and 2035
  • Figure 44: Western Europe Market Value Share and BPS Analysis by Devices, 2025 and 2035
  • Figure 45: Western Europe Market Y-o-Y Growth Comparison by Devices, 2025-2035
  • Figure 46: Western Europe Market Attractiveness Analysis by Devices
  • Figure 47: Western Europe Market Value Share and BPS Analysis by Application, 2025 and 2035
  • Figure 48: Western Europe Market Y-o-Y Growth Comparison by Application, 2025-2035
  • Figure 49: Western Europe Market Attractiveness Analysis by Application
  • Figure 50: Western Europe Market Value Share and BPS Analysis by Sales Channel, 2025 and 2035
  • Figure 51: Western Europe Market Y-o-Y Growth Comparison by Sales Channel, 2025-2035
  • Figure 52: Western Europe Market Attractiveness Analysis by Sales Channel
  • Figure 53: Eastern Europe Market Value Share and BPS Analysis by Country, 2025 and 2035
  • Figure 54: Eastern Europe Market Value Share and BPS Analysis by Devices, 2025 and 2035
  • Figure 55: Eastern Europe Market Y-o-Y Growth Comparison by Devices, 2025-2035
  • Figure 56: Eastern Europe Market Attractiveness Analysis by Devices
  • Figure 57: Eastern Europe Market Value Share and BPS Analysis by Application, 2025 and 2035
  • Figure 58: Eastern Europe Market Y-o-Y Growth Comparison by Application, 2025-2035
  • Figure 59: Eastern Europe Market Attractiveness Analysis by Application
  • Figure 60: Eastern Europe Market Value Share and BPS Analysis by Sales Channel, 2025 and 2035
  • Figure 61: Eastern Europe Market Y-o-Y Growth Comparison by Sales Channel, 2025-2035
  • Figure 62: Eastern Europe Market Attractiveness Analysis by Sales Channel
  • Figure 63: East Asia Market Value Share and BPS Analysis by Country, 2025 and 2035
  • Figure 64: East Asia Market Value Share and BPS Analysis by Devices, 2025 and 2035
  • Figure 65: East Asia Market Y-o-Y Growth Comparison by Devices, 2025-2035
  • Figure 66: East Asia Market Attractiveness Analysis by Devices
  • Figure 67: East Asia Market Value Share and BPS Analysis by Application, 2025 and 2035
  • Figure 68: East Asia Market Y-o-Y Growth Comparison by Application, 2025-2035
  • Figure 69: East Asia Market Attractiveness Analysis by Application
  • Figure 70: East Asia Market Value Share and BPS Analysis by Sales Channel, 2025 and 2035
  • Figure 71: East Asia Market Y-o-Y Growth Comparison by Sales Channel, 2025-2035
  • Figure 72: East Asia Market Attractiveness Analysis by Sales Channel
  • Figure 73: South Asia & Pacific Market Value Share and BPS Analysis by Country, 2025 and 2035
  • Figure 74: South Asia & Pacific Market Value Share and BPS Analysis by Devices, 2025 and 2035
  • Figure 75: South Asia & Pacific Market Y-o-Y Growth Comparison by Devices, 2025-2035
  • Figure 76: South Asia & Pacific Market Attractiveness Analysis by Devices
  • Figure 77: South Asia & Pacific Market Value Share and BPS Analysis by Application, 2025 and 2035
  • Figure 78: South Asia & Pacific Market Y-o-Y Growth Comparison by Application, 2025-2035
  • Figure 79: South Asia & Pacific Market Attractiveness Analysis by Application
  • Figure 80: South Asia & Pacific Market Value Share and BPS Analysis by Sales Channel, 2025 and 2035
  • Figure 81: South Asia & Pacific Market Y-o-Y Growth Comparison by Sales Channel, 2025-2035
  • Figure 82: South Asia & Pacific Market Attractiveness Analysis by Sales Channel
  • Figure 83: Middle East and Africa Market Value Share and BPS Analysis by Country, 2025 and 2035
  • Figure 84: Middle East and Africa Market Value Share and BPS Analysis by Devices, 2025 and 2035
  • Figure 85: Middle East and Africa Market Y-o-Y Growth Comparison by Devices, 2025-2035
  • Figure 86: Middle East and Africa Market Attractiveness Analysis by Devices
  • Figure 87: Middle East and Africa Market Value Share and BPS Analysis by Application, 2025 and 2035
  • Figure 88: Middle East and Africa Market Y-o-Y Growth Comparison by Application, 2025-2035
  • Figure 89: Middle East and Africa Market Attractiveness Analysis by Application
  • Figure 90: Middle East and Africa Market Value Share and BPS Analysis by Sales Channel, 2025 and 2035
  • Figure 91: Middle East and Africa Market Y-o-Y Growth Comparison by Sales Channel, 2025-2035
  • Figure 92: Middle East and Africa Market Attractiveness Analysis by Sales Channel
  • Figure 93: Global Market - Tier Structure Analysis
  • Figure 94: Global Market - Company Share Analysis

Frequently Asked Questions

What is the projected industry size of the at-home therapeutic beauty devices market by 2035?

The industry is projected to reach USD 12.4 billion by 2035.

What is the expected CAGR of the at-home therapeutic beauty devices market from 2025 to 2035?

The industry is expected to grow at a CAGR of 8.5% from 2025 to 2035.

Which segment is expected to lead the at-home therapeutic beauty devices market in 2025?

Light-based devices are expected to dominate with a 33% share in 2025.

What is the industry size of the at-home therapeutic beauty devices market in 2025?

The industry is estimated to reach USD 5.5 billion in 2025.

Which region is expected to witness the highest growth in the at-home therapeutic beauty devices market?

South Asia & Pacific, particularly India, is expected to be the key growth region with a projected CAGR of 13.6%.

Explore Similar Insights

Future Market Insights

At-Home Therapeutic Beauty Devices Market