Reports

- Global Locations -

Headquarters

Future Market Insights, Inc.

Christiana Corporate, 200
Continental Drive, Suite 401,
Newark, Delaware - 19713,
United States

T: +1-845-579-5705

Americas

Future Market Insights, Inc.

616 Corporate Way, Suite 2-9018,
Valley Cottage, NY 10989, United States

T: +1-347-918-3531

MEA

Future Market Insights

1602-6 Jumeirah Bay X2 Tower, Plot No: JLT-PH2-X2A,
Jumeirah Lakes Towers, Dubai,
United Arab Emirates

Europe

Future Market Insights

3rd Floor, 207 Regent Street,
W1B 3HH London
United Kingdom

T: + 44 (0) 20 8123 9659
D: +44 (0) 20 3287 4268

Asia Pacific

Future Market Insights

IndiaLand Global Tech Park, Unit UG-1, Behind Grand HighStreet, Phase 1, Hinjawadi, MH, Pune – 411057, India

Respiratory Distress Syndrome Management Market Snapshot (2023 to 2033)

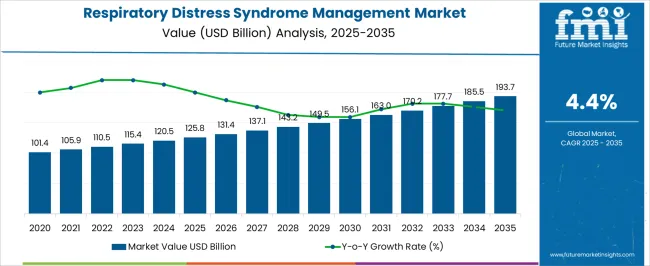
The global respiratory distress syndrome management market is slated to reach a valuation of US$ 115.4 billion in 2023. According to Future Market Insights, the market is expected to grow at a 4.41% CAGR until 2033, valued at US$ 177.7 billion. Also, according to the recent study by FMI, it is noted that the industry sponsors will be leading the market with an expected share of about 54.7% in the year 2023, within the global market.

Several factors that can drive the market growth such as improved healthcare facilities with an increase in research and drug development for the treatment, technological advancements in the treatment & increase in healthcare investment day by day will lead to profitable growth opportunities in the forecast period.

This global respiratory distress syndrome treatment is a serious life-threatening viral infection including symptoms like cough, chills and shaking, headache, etc is said to be transferrable from one person to another in a short period. In October 2012, this infection was added to National Select Agent Registry, regulating the handling and control of bacteria and virus that is said to cause severe risk to the public’s health and safety.

The development of the global respiratory distress syndrome treatment may be restrained due to a lack of qualified and experienced specialists who have no idea of the treatment available for this illness can restraint the growth of the market during the forecast period. Moreover, Limited approved drugs for the treatment also inhibited the growth of the market.

Antivirals and antibiotics are generally recommended for the treatment of this respiratory distress syndrome treatment. But in many cases, antibiotic treatment is alone not enough for the treatment, supportive care is also required.

Attributes Details
Base year Market Value (2022) US$ 110.3 billion
Projected Forecast Value (2023) US$ 115.4 billion
Projected Forecast Value (2033) US$ 177.7 billion
Growth rate 4.41%
Forecast period 2023 to 2033

Don't pay for what you don't need

Customize your report by selecting specific countries or regions and save 30%!

Respiratory Distress Syndrome Management Market Historical Period 2018 To 2022 Demand Analysis Vs. Forecast 2023

The global respiratory distress syndrome management market grew at a CAGR of 4.24% from 2018 to 2022, as per Future Market Insights, a provider of market research and competitive intelligence.

Historically, the focus of mechanical ventilation in respiratory failure has been to maintain adequate oxygenation and carbon dioxide elimination where several preclinical studies indicated that the common clinical practice of using relatively high tidal volumes and elevated airway pressures for ARDS patients might exacerbate the degree of lung injury.

In the year 2000, investigators supported by the US National Heart Lung and Blood Institute ARDS Network completed a randomized phase III clinical trial in which a tidal volume of 6 ml per kg PBW, compared with the more common higher tidal volume of 12 ml per kg PBW, improved survival, shortened duration of mechanical ventilation, attenuated systemic inflammation and accelerated recovery of extra-pulmonary organ failures, and the biologic findings were reported in other studies. Thus, with the discovery of the major role that mechanical forces play in the pathogenesis of lung injury, optimizing ventilator support to minimize VALI has become central to the clinical management of ARDS, leading to the concept of lung-protective ventilation.

The recently developed Radiographic Assessment of Lung Edema (RALE) score may be a novel tool to predict severity, outcomes, and response to therapy in ARDS. In the derivation cohort of this study, the RALE score was correlated with lung weight from excised lungs in deceased organ donors 3. Before the widespread use of this score, extensive validation is required. The use of lung ultrasound for the diagnosis of ARDS may be a promising tool but needs further study. Sensitive and specific biomarkers of ARDS, if available, may aid in earlier and more accurate diagnosis. Also, Future investigations should refine clinical, radiographic, physiological, molecular, and genetic differences in phenotypes to better understand the pathobiology of ARDS and develop novel therapies.

Prominent Growth Drivers Influencing Respiratory Distress Syndrome Management Market

The rising incidence of clinical trials is driving growth

Increasing research and development and clinical trials and usage of therapeutics for the respiratory distress syndrome management market will eventually propel the growth of the market. Government initiatives taken to the reduction in mortality rate will also be a major factor that will help in the contribution of the growth of the market.

Increasing prevalence and incidence of acute lung injury

The increasing alcohol consumption, irrespective of age, leads to syndrome-like ARDS. Other risk factors like dyspnoea, hypertension, diabetes, and more lead to ARDS development. Thereby, this wide range of risk factors associated with acute respiratory distress syndrome increases the possibility of developing the clinical condition, simultaneously raising the cases of the disease. These affirmative risk factors are anticipated to boost the growth of the market.

The rising rate of air pollution and lifestyle-related diseases

The World Health Organization, air pollution is one of the greatest environmental risks to health by increasing the burden of diseases like heart diseases and lung and respiratory infections at both acute and chronic levels. Hence, the rising air pollution rate in developed and developing countries increases the chances of people getting syndromes like acute respiratory distress syndrome. Thus, the factor is expected to drive the growth of the market.

Increasing accident rates and trauma causing ARDS

The inhalation of smoke releases materials like fibrin, neutrophils, mucus, and epithelial cell debris that occlude the airway lumen, causing changes in ventilation. This condition leads to hypoxemia which is a primary significant reason for ARDS. They also reported that increased mortality rates in burn patients were due to ARDS. Thereby, the rising number of accidents and trauma injuries in the lungs is expected to drive the growth of the market.

Sabyasachi Ghosh
Sabyasachi Ghosh

Principal Consultant

Talk to Analyst

Find your sweet spots for generating winning opportunities in this market.

What Could Possibly Hinder Respiratory Distress Syndrome Management Market Demand?

Complications associated with treatments

There are treatments for ARDS helping people survive, but the complications associated with treatments and post-treatment are still a burden for patients. Most potential and lasting effects include breathing problems, depression, problems with memory and thinking, tiredness and muscle weakness, and more.

These complications associated with and post-treatment of acute respiratory distress syndrome are expected to hamper the market growth during our forecast period.

High cost of device and treatments

The high cost of ventilation treatment per day is not affordable if the therapy has to proceed for many days. Hence patients prefer taking ventilators for home care. However, the price of ventilators is yet quite expensive. Therefore, the high cost of treatment and ventilators is very challenging for people to afford any reliable remedy for the long term until the patient completely recovers. This is anticipated to hamper the growth of the market.
Region-wise Analysis

What Is the Outlook of The North American Respiratory Distress Syndrome Management Market Treatment?

The hospital segment in North America is expected to grow with the highest growth rate

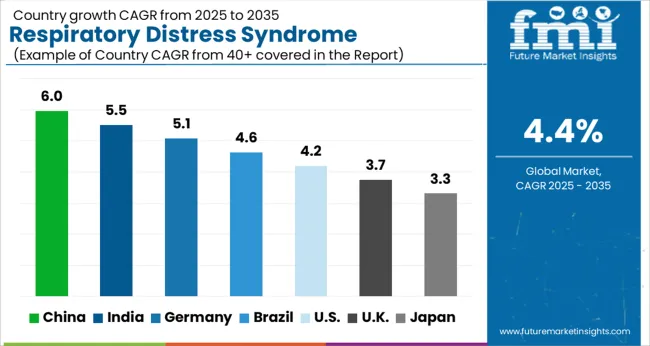
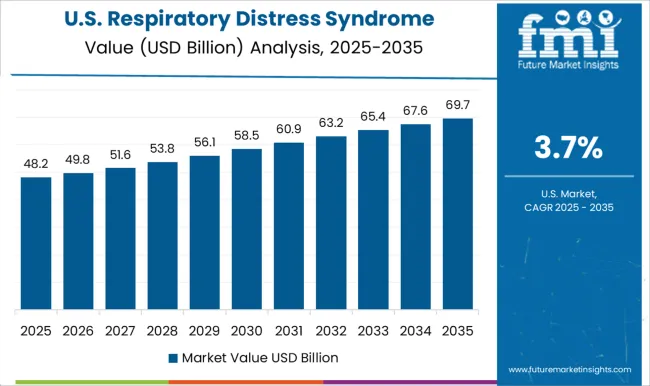
The countries covered in the acute respiratory distress syndrome (ARDS) market report are USA., Canada, and Mexico. In the forecast period of 2023 to 2033 because of increasing government and organizational support.

The hospital segment in Canada is second dominating the market owing to increasing cases of chronic respiratory diseases and high adoption of proper diagnosis. Mexico is third leading the growth of the market and the hospital segment is dominating in this country due to the increasing number of new hospital infrastructures being opened due to the emergence of COVID-19.

Expectations from The Asia - Pacific Market for Respiratory Distress Syndrome Management Market Treatment?

Increasing technological advancement in the country

The parenteral segment in Japan is expected to grow with the highest growth rate in the forecast period of 2023 to 2033 because of increasing technological advancement in the country.

The parenteral segment in China is second dominating the market owing to increasing cases of chronic respiratory diseases and high adoption of proper diagnosis. South Korea is third leading the growth of the Asia-Pacific market and the parenteral segment is dominating in this country due to the increasing number of biotechnologies centers and research activities.

Get the data you need at a Fraction of the cost

Personalize your report by choosing insights you need
and save 40%!

Category-wise Insights

Which Type of Respiratory Distress Syndrome Management Market Treatment is Most Prevalent?

The nasal segment will gain the dominant market share

Advancements in neonatal care have been driving growth as the survival rate of premature infants with RDS has increased due to improved diagnostic methods and treatments thus fuelling demand. Various leading companies like Smiths Medical offers neonatal care products, including neonatal ventilators and respiratory support devices.

Also, babies have survived longer and with less lung damage due to the introduction of volume-targeted ventilators as they require support for shorter periods leading to a low risk of developing pneumothorax.

Which distribution channel segment is expected to gain traction from 2023 to 2033?

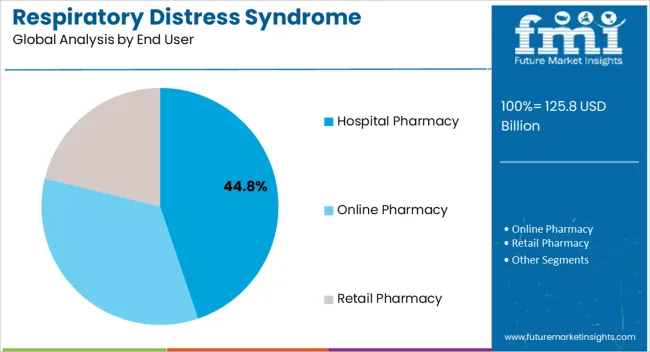
The demand for hospital pharmacies will be more during the forecast period.

According to a report by Future Market Insights, the hospital pharmacies would grow within the anticipated time frame. This market sector is expected to hold a greater share of the worldwide market from 2023 to 2033.

Due to the rise in population and advancement in technologies, a growing number of people are more prone to visiting hospitals for advice on respiratory distress syndrome management market treatment-related, where they will be provided not only with proper care but also with the new and advanced level of instruments at each interval of time. As a result, individuals more pertain towards their health and well-being. Thus, the majority of consumers are expected to only buy medications from hospital pharmacies.

Start-up Scenario

The start-ups in this sector aim to use several techniques, such as the launch of new products and acquisitions, to improve their market positions internationally.
  • Hospitech Respiration- Israeli medical device start-up Hospitech Respiration was founded in 2006, and develops airway management solutions for mechanically-ventilated patients. Its AnapnoGuard system, in particular, has gained increased notoriety throughout 2020 due to the Covid-19 pandemic. The device provides automated control of the airway cuff pressure and automated evacuation of subglottic secretions in ventilated patients, preventing infection or damage in the lungs.
  • In November 2020, Hospitech Respiration also announced that, in response to increased global demand for its airway management system, it would be working with Chinese firm AwakeZone to open a new manufacturing facility in China, expanding production of the AnapnoGuard system in the country.
  • Aerin Medical- US health tech firm Aerin Medical develops therapeutic devices that improve nasal breathing by using low-power radiofrequency energy to remodel soft tissue in the nose. The two main procedures it offers via its proprietary Aerin technology are RhinAer, which provides lasting relief from chronic rhinitis – often characterized by a persistently runny nose – and VivAer, which is used to treat nasal obstruction.
  • Having been founded in 2011, Texas-headquartered Aerin Medical has also made major strides, appointing a new president and CEO – Matt Brokaw, formerly of Stryker and Johnson & Johnson – and raising US$ 48 million in funding in August 2020.

How Competitive is the Market for Respiratory Distress Syndrome Management Market Treatment?

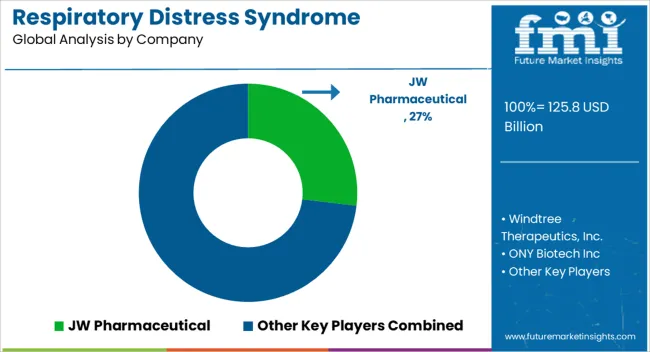
Some of the prominent players in the global market for RDS treatment are

  • JW Pharmaceutical
  • Windtree Therapeutics, Inc.
  • ONY Biotech Inc
  • AbbVie Inc.
  • Teva Pharmaceutical Industries Ltd.
  • Takeda Pharmaceutical Company Limited
  • GlaxoSmithKline plc.
  • Pfizer Inc.
  • Gilead Sciences, Inc.
  • Hoffmann-La Roche Ltd
  • Fresenius Kabi AG

Some of the important developments of the key players in the market are

  • In May 2021, Medtronic announced the launch of the SonarMed airway monitoring system. The system utilizes acoustic technology to check for endotracheal tube obstruction. This has helped the company to increase its product portfolio.
  • In July 2020, F. Hoffman-La Roche Ltd announced the launch of the SARS-CoV-2 rapid antibody test. The test was launched in partnership with SD Biosenseor, Inc. This has helped the company to increase its product portfolio.

Report Scope

Report Attribute Details
Growth Rate CAGR of 4.41% from 2023 to 2033
Market value in 2023 US$ 115.4 Billion
Market value in 2033 US$ 177.7 Billion
Base Year for Estimation 2022
Historical Data 2018 to 2022
Forecast Period 2023 to 2033
Quantitative Units USD Billion for Value and CAGR from 2023 to 2033
Report Coverage Revenue Forecast, Company Ranking, Competitive Landscape, Growth Factors, Trends, and Pricing Analysis
Segments Covered
  • Drug class
  • Route of Administration
  • End-user
  • Region
Regions Covered
  • North America
  • Latin America
  • Europe
  • South Asia
  • East Asia
  • Oceania
  • Middle East & Africa
Key Countries Profiled
  • United States
  • Canada
  • Brazil
  • Mexico
  • Germany
  • United Kingdom
  • France
  • Spain
  • Italy
  • India
  • Malaysia
  • Singapore
  • Thailand
  • China
  • Japan
  • South Korea
  • Australia
  • New Zealand
  • GCC countries
  • South Africa
  • Israel
Key Companies Profiled
  • JW Pharmaceutical
  • Windtree Therapeutics, Inc.
  • ONY Biotech Inc
  • AbbVie Inc.
  • Teva Pharmaceutical Industries Ltd.
  • Takeda Pharmaceutical Company Limited
  • GlaxoSmithKline plc.
  • Pfizer Inc.
  • Gilead Sciences, Inc.
  • Hoffmann-La Roche Ltd
  • Fresenius Kabi AG
Customisation Scope Available on Request

Key Segments Profiled in the Respiratory Distress Syndrome Management Market Report

Region:

  • North America
  • Latin America
  • Europe
  • East Asia
  • South Asia
  • Oceania
  • Middle East & Africa

Drug Class:

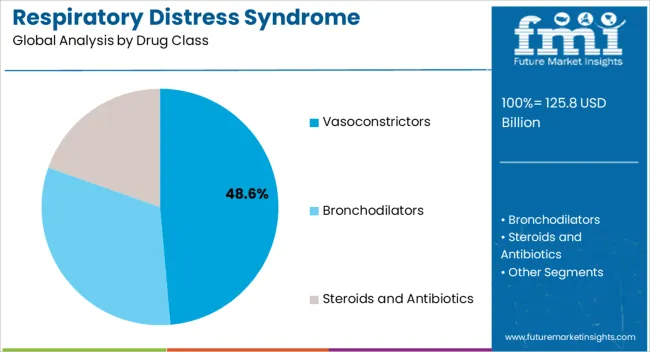
  • Vasoconstrictors
  • Bronchodilators
  • Steroids and Antibiotics

Route of administration:

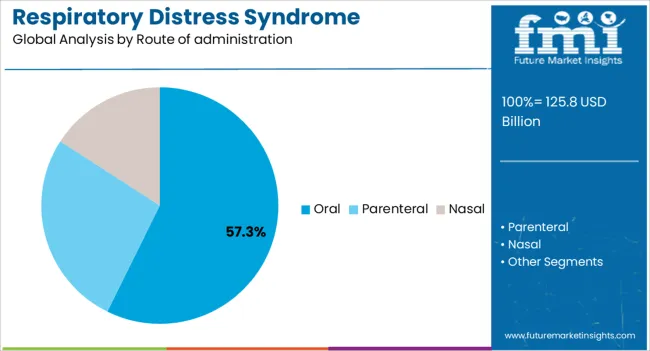
  • Oral
  • Parenteral
  • Nasal

End User:

  • Hospital pharmacy
  • Online pharmacy
  • Retail pharmacy

Frequently Asked Questions

What is the Growth Potential of the Respiratory Distress Syndrome Management Market?

The growth potential of the market is 4.41% through 2033.

What Limits the Growth Potential of the Market?

Complication in treatment is likely to limit market growth.

What is Japan’s Expected Market Growth by 2033?

Rising technological advancements are fueling Japan’s growth by 2033.

What is the Current Market Valuation?

The market is estimated to get a valuation of US$ 115.4 billion in 2023.

Which Country is Set to Register Exponential Growth in the Respiratory Distress Syndrome Management Market?

Canada, the United States, and Japan may witness significant growth in the market.

Table of Content

1. Executive Summary | Respiratory Distress Syndrome Management Market

    1.1. Global Market Outlook

    1.2. Demand-side Trends

    1.3. Supply-side Trends

    1.4. Technology Roadmap Analysis

    1.5. Analysis and Recommendations

2. Market Overview

    2.1. Market Coverage / Taxonomy

    2.2. Market Definition / Scope / Limitations

3. Market Background

    3.1. Market Dynamics

        3.1.1. Drivers

        3.1.2. Restraints

        3.1.3. Opportunity

        3.1.4. Trends

    3.2. Scenario Forecast

        3.2.1. Demand in Optimistic Scenario

        3.2.2. Demand in Likely Scenario

        3.2.3. Demand in Conservative Scenario

    3.3. Opportunity Map Analysis

    3.4. Investment Feasibility Matrix

    3.5. PESTLE and Porter’s Analysis

    3.6. Regulatory Landscape

        3.6.1. By Key Regions

        3.6.2. By Key Countries

    3.7. Regional Parent Market Outlook

4. Global MarketAnalysis 2018 to 2022 and Forecast, 2023 to 2033

    4.1. Historical Market Size Value (US$ Million) Analysis, 2018 to 2022

    4.2. Current and Future Market Size Value (US$ Million) Projections, 2023 to 2033

        4.2.1. Y-o-Y Growth Trend Analysis

        4.2.2. Absolute $ Opportunity Analysis

5. Global MarketAnalysis 2018 to 2022 and Forecast 2023 to 2033, By Drug Class

    5.1. Introduction / Key Findings

    5.2. Historical Market Size Value (US$ Million) Analysis By Drug Class, 2018 to 2022

    5.3. Current and Future Market Size Value (US$ Million) Analysis and Forecast By Drug Class, 2023 to 2033

        5.3.1. Vasoconstrictors

        5.3.2. Bronchodilators

        5.3.3. Steroids and Antibiotics

    5.4. Y-o-Y Growth Trend Analysis By Drug Class, 2018 to 2022

    5.5. Absolute $ Opportunity Analysis By Drug Class, 2023 to 2033

6. Global MarketAnalysis 2018 to 2022 and Forecast 2023 to 2033, By Route of Administration

    6.1. Introduction / Key Findings

    6.2. Historical Market Size Value (US$ Million) Analysis By Route of Administration, 2018 to 2022

    6.3. Current and Future Market Size Value (US$ Million) Analysis and Forecast By Route of Administration, 2023 to 2033

        6.3.1. Oral

        6.3.2. Parenteral

        6.3.3. Nasal

    6.4. Y-o-Y Growth Trend Analysis By Route of Administration, 2018 to 2022

    6.5. Absolute $ Opportunity Analysis By Route of Administration, 2023 to 2033

7. Global MarketAnalysis 2018 to 2022 and Forecast 2023 to 2033, By End-User

    7.1. Introduction / Key Findings

    7.2. Historical Market Size Value (US$ Million) Analysis By End-User, 2018 to 2022

    7.3. Current and Future Market Size Value (US$ Million) Analysis and Forecast By End-User, 2023 to 2033

        7.3.1. Hospital pharmacy

        7.3.2. Online pharmacy

        7.3.3. Retail pharmacy

    7.4. Y-o-Y Growth Trend Analysis By End-User, 2018 to 2022

    7.5. Absolute $ Opportunity Analysis By End-User, 2023 to 2033

8. Global MarketAnalysis 2018 to 2022 and Forecast 2023 to 2033, By Region

    8.1. Introduction

    8.2. Historical Market Size Value (US$ Million) Analysis By Region, 2018 to 2022

    8.3. Current Market Size Value (US$ Million) Analysis and Forecast By Region, 2023 to 2033

        8.3.1. North America

        8.3.2. Latin America

        8.3.3. Europe

        8.3.4. South Asia

        8.3.5. East Asia

        8.3.6. Oceania

        8.3.7. MEA

    8.4. Market Attractiveness Analysis By Region

9. North America MarketAnalysis 2018 to 2022 and Forecast 2023 to 2033, By Country

    9.1. Historical Market Size Value (US$ Million) Trend Analysis By Market Taxonomy, 2018 to 2022

    9.2. Market Size Value (US$ Million) Forecast By Market Taxonomy, 2023 to 2033

        9.2.1. By Country

            9.2.1.1. USA

            9.2.1.2. Canada

        9.2.2. By Drug Class

        9.2.3. By Route of Administration

        9.2.4. By End-User

    9.3. Market Attractiveness Analysis

        9.3.1. By Country

        9.3.2. By Drug Class

        9.3.3. By Route of Administration

        9.3.4. By End-User

    9.4. Key Takeaways

10. Latin America MarketAnalysis 2018 to 2022 and Forecast 2023 to 2033, By Country

    10.1. Historical Market Size Value (US$ Million) Trend Analysis By Market Taxonomy, 2018 to 2022

    10.2. Market Size Value (US$ Million) Forecast By Market Taxonomy, 2023 to 2033

        10.2.1. By Country

            10.2.1.1. Brazil

            10.2.1.2. Mexico

            10.2.1.3. Rest of Latin America

        10.2.2. By Drug Class

        10.2.3. By Route of Administration

        10.2.4. By End-User

    10.3. Market Attractiveness Analysis

        10.3.1. By Country

        10.3.2. By Drug Class

        10.3.3. By Route of Administration

        10.3.4. By End-User

    10.4. Key Takeaways

11. Europe MarketAnalysis 2018 to 2022 and Forecast 2023 to 2033, By Country

    11.1. Historical Market Size Value (US$ Million) Trend Analysis By Market Taxonomy, 2018 to 2022

    11.2. Market Size Value (US$ Million) Forecast By Market Taxonomy, 2023 to 2033

        11.2.1. By Country

            11.2.1.1. Germany

            11.2.1.2. United kingdom

            11.2.1.3. France

            11.2.1.4. Spain

            11.2.1.5. Italy

            11.2.1.6. Rest of Europe

        11.2.2. By Drug Class

        11.2.3. By Route of Administration

        11.2.4. By End-User

    11.3. Market Attractiveness Analysis

        11.3.1. By Country

        11.3.2. By Drug Class

        11.3.3. By Route of Administration

        11.3.4. By End-User

    11.4. Key Takeaways

12. South Asia MarketAnalysis 2018 to 2022 and Forecast 2023 to 2033, By Country

    12.1. Historical Market Size Value (US$ Million) Trend Analysis By Market Taxonomy, 2018 to 2022

    12.2. Market Size Value (US$ Million) Forecast By Market Taxonomy, 2023 to 2033

        12.2.1. By Country

            12.2.1.1. India

            12.2.1.2. Malaysia

            12.2.1.3. Singapore

            12.2.1.4. Thailand

            12.2.1.5. Rest of South Asia

        12.2.2. By Drug Class

        12.2.3. By Route of Administration

        12.2.4. By End-User

    12.3. Market Attractiveness Analysis

        12.3.1. By Country

        12.3.2. By Drug Class

        12.3.3. By Route of Administration

        12.3.4. By End-User

    12.4. Key Takeaways

13. East Asia MarketAnalysis 2018 to 2022 and Forecast 2023 to 2033, By Country

    13.1. Historical Market Size Value (US$ Million) Trend Analysis By Market Taxonomy, 2018 to 2022

    13.2. Market Size Value (US$ Million) Forecast By Market Taxonomy, 2023 to 2033

        13.2.1. By Country

            13.2.1.1. China

            13.2.1.2. Japan

            13.2.1.3. South Korea

        13.2.2. By Drug Class

        13.2.3. By Route of Administration

        13.2.4. By End-User

    13.3. Market Attractiveness Analysis

        13.3.1. By Country

        13.3.2. By Drug Class

        13.3.3. By Route of Administration

        13.3.4. By End-User

    13.4. Key Takeaways

14. Oceania MarketAnalysis 2018 to 2022 and Forecast 2023 to 2033, By Country

    14.1. Historical Market Size Value (US$ Million) Trend Analysis By Market Taxonomy, 2018 to 2022

    14.2. Market Size Value (US$ Million) Forecast By Market Taxonomy, 2023 to 2033

        14.2.1. By Country

            14.2.1.1. Australia

            14.2.1.2. New Zealand

        14.2.2. By Drug Class

        14.2.3. By Route of Administration

        14.2.4. By End-User

    14.3. Market Attractiveness Analysis

        14.3.1. By Country

        14.3.2. By Drug Class

        14.3.3. By Route of Administration

        14.3.4. By End-User

    14.4. Key Takeaways

15. MEA MarketAnalysis 2018 to 2022 and Forecast 2023 to 2033, By Country

    15.1. Historical Market Size Value (US$ Million) Trend Analysis By Market Taxonomy, 2018 to 2022

    15.2. Market Size Value (US$ Million) Forecast By Market Taxonomy, 2023 to 2033

        15.2.1. By Country

            15.2.1.1. GCC Countries

            15.2.1.2. South Africa

            15.2.1.3. Israel

            15.2.1.4. Rest of MEA

        15.2.2. By Drug Class

        15.2.3. By Route of Administration

        15.2.4. By End-User

    15.3. Market Attractiveness Analysis

        15.3.1. By Country

        15.3.2. By Drug Class

        15.3.3. By Route of Administration

        15.3.4. By End-User

    15.4. Key Takeaways

16. Key Countries MarketAnalysis

    16.1. USA

        16.1.1. Pricing Analysis

        16.1.2. Market Share Analysis, 2022

            16.1.2.1. By Drug Class

            16.1.2.2. By Route of Administration

            16.1.2.3. By End-User

    16.2. Canada

        16.2.1. Pricing Analysis

        16.2.2. Market Share Analysis, 2022

            16.2.2.1. By Drug Class

            16.2.2.2. By Route of Administration

            16.2.2.3. By End-User

    16.3. Brazil

        16.3.1. Pricing Analysis

        16.3.2. Market Share Analysis, 2022

            16.3.2.1. By Drug Class

            16.3.2.2. By Route of Administration

            16.3.2.3. By End-User

    16.4. Mexico

        16.4.1. Pricing Analysis

        16.4.2. Market Share Analysis, 2022

            16.4.2.1. By Drug Class

            16.4.2.2. By Route of Administration

            16.4.2.3. By End-User

    16.5. Germany

        16.5.1. Pricing Analysis

        16.5.2. Market Share Analysis, 2022

            16.5.2.1. By Drug Class

            16.5.2.2. By Route of Administration

            16.5.2.3. By End-User

    16.6. United kingdom

        16.6.1. Pricing Analysis

        16.6.2. Market Share Analysis, 2022

            16.6.2.1. By Drug Class

            16.6.2.2. By Route of Administration

            16.6.2.3. By End-User

    16.7. France

        16.7.1. Pricing Analysis

        16.7.2. Market Share Analysis, 2022

            16.7.2.1. By Drug Class

            16.7.2.2. By Route of Administration

            16.7.2.3. By End-User

    16.8. Spain

        16.8.1. Pricing Analysis

        16.8.2. Market Share Analysis, 2022

            16.8.2.1. By Drug Class

            16.8.2.2. By Route of Administration

            16.8.2.3. By End-User

    16.9. Italy

        16.9.1. Pricing Analysis

        16.9.2. Market Share Analysis, 2022

            16.9.2.1. By Drug Class

            16.9.2.2. By Route of Administration

            16.9.2.3. By End-User

    16.10. India

        16.10.1. Pricing Analysis

        16.10.2. Market Share Analysis, 2022

            16.10.2.1. By Drug Class

            16.10.2.2. By Route of Administration

            16.10.2.3. By End-User

    16.11. Malaysia

        16.11.1. Pricing Analysis

        16.11.2. Market Share Analysis, 2022

            16.11.2.1. By Drug Class

            16.11.2.2. By Route of Administration

            16.11.2.3. By End-User

    16.12. Singapore

        16.12.1. Pricing Analysis

        16.12.2. Market Share Analysis, 2022

            16.12.2.1. By Drug Class

            16.12.2.2. By Route of Administration

            16.12.2.3. By End-User

    16.13. Thailand

        16.13.1. Pricing Analysis

        16.13.2. Market Share Analysis, 2022

            16.13.2.1. By Drug Class

            16.13.2.2. By Route of Administration

            16.13.2.3. By End-User

    16.14. China

        16.14.1. Pricing Analysis

        16.14.2. Market Share Analysis, 2022

            16.14.2.1. By Drug Class

            16.14.2.2. By Route of Administration

            16.14.2.3. By End-User

    16.15. Japan

        16.15.1. Pricing Analysis

        16.15.2. Market Share Analysis, 2022

            16.15.2.1. By Drug Class

            16.15.2.2. By Route of Administration

            16.15.2.3. By End-User

    16.16. South Korea

        16.16.1. Pricing Analysis

        16.16.2. Market Share Analysis, 2022

            16.16.2.1. By Drug Class

            16.16.2.2. By Route of Administration

            16.16.2.3. By End-User

    16.17. Australia

        16.17.1. Pricing Analysis

        16.17.2. Market Share Analysis, 2022

            16.17.2.1. By Drug Class

            16.17.2.2. By Route of Administration

            16.17.2.3. By End-User

    16.18. New Zealand

        16.18.1. Pricing Analysis

        16.18.2. Market Share Analysis, 2022

            16.18.2.1. By Drug Class

            16.18.2.2. By Route of Administration

            16.18.2.3. By End-User

    16.19. GCC Countries

        16.19.1. Pricing Analysis

        16.19.2. Market Share Analysis, 2022

            16.19.2.1. By Drug Class

            16.19.2.2. By Route of Administration

            16.19.2.3. By End-User

    16.20. South Africa

        16.20.1. Pricing Analysis

        16.20.2. Market Share Analysis, 2022

            16.20.2.1. By Drug Class

            16.20.2.2. By Route of Administration

            16.20.2.3. By End-User

    16.21. Israel

        16.21.1. Pricing Analysis

        16.21.2. Market Share Analysis, 2022

            16.21.2.1. By Drug Class

            16.21.2.2. By Route of Administration

            16.21.2.3. By End-User

17. Market Structure Analysis

    17.1. Competition Dashboard

    17.2. Competition Benchmarking

    17.3. Market Share Analysis of Top Players

        17.3.1. By Regional

        17.3.2. By Drug Class

        17.3.3. By Route of Administration

        17.3.4. By End-User

18. Competition Analysis

    18.1. Competition Deep Dive

        18.1.1. JW Pharmaceutical

            18.1.1.1. Overview

            18.1.1.2. Product Portfolio

            18.1.1.3. Profitability by Market Segments

            18.1.1.4. Sales Footprint

            18.1.1.5. Strategy Overview

                18.1.1.5.1. Marketing Strategy

        18.1.2. Windtree Therapeutics, Inc.

            18.1.2.1. Overview

            18.1.2.2. Product Portfolio

            18.1.2.3. Profitability by Market Segments

            18.1.2.4. Sales Footprint

            18.1.2.5. Strategy Overview

                18.1.2.5.1. Marketing Strategy

        18.1.3. ONY Biotech Inc.

            18.1.3.1. Overview

            18.1.3.2. Product Portfolio

            18.1.3.3. Profitability by Market Segments

            18.1.3.4. Sales Footprint

            18.1.3.5. Strategy Overview

                18.1.3.5.1. Marketing Strategy

        18.1.4. AbbVie Inc.

            18.1.4.1. Overview

            18.1.4.2. Product Portfolio

            18.1.4.3. Profitability by Market Segments

            18.1.4.4. Sales Footprint

            18.1.4.5. Strategy Overview

                18.1.4.5.1. Marketing Strategy

        18.1.5. Teva Pharmaceutical Industries Ltd.

            18.1.5.1. Overview

            18.1.5.2. Product Portfolio

            18.1.5.3. Profitability by Market Segments

            18.1.5.4. Sales Footprint

            18.1.5.5. Strategy Overview

                18.1.5.5.1. Marketing Strategy

        18.1.6. Takeda Pharmaceutical Company Limited

            18.1.6.1. Overview

            18.1.6.2. Product Portfolio

            18.1.6.3. Profitability by Market Segments

            18.1.6.4. Sales Footprint

            18.1.6.5. Strategy Overview

                18.1.6.5.1. Marketing Strategy

        18.1.7. GlaxoSmithKline plc.

            18.1.7.1. Overview

            18.1.7.2. Product Portfolio

            18.1.7.3. Profitability by Market Segments

            18.1.7.4. Sales Footprint

            18.1.7.5. Strategy Overview

                18.1.7.5.1. Marketing Strategy

        18.1.8. Pfizer Inc.

            18.1.8.1. Overview

            18.1.8.2. Product Portfolio

            18.1.8.3. Profitability by Market Segments

            18.1.8.4. Sales Footprint

            18.1.8.5. Strategy Overview

                18.1.8.5.1. Marketing Strategy

        18.1.9. Gilead Sciences, Inc.

            18.1.9.1. Overview

            18.1.9.2. Product Portfolio

            18.1.9.3. Profitability by Market Segments

            18.1.9.4. Sales Footprint

            18.1.9.5. Strategy Overview

                18.1.9.5.1. Marketing Strategy

        18.1.10. Hoffmann-La Roche Ltd

            18.1.10.1. Overview

            18.1.10.2. Product Portfolio

            18.1.10.3. Profitability by Market Segments

            18.1.10.4. Sales Footprint

            18.1.10.5. Strategy Overview

                18.1.10.5.1. Marketing Strategy

        18.1.11. Fresenius Kabi AG

            18.1.11.1. Overview

            18.1.11.2. Product Portfolio

            18.1.11.3. Profitability by Market Segments

            18.1.11.4. Sales Footprint

            18.1.11.5. Strategy Overview

                18.1.11.5.1. Marketing Strategy

19. Assumptions & Acronyms Used

20. Research Methodology

Don't pay for what you don't need

Customize your report by selecting specific countries or regions and save 30%!

List of Tables

Table 1: Global Market Value (US$ Million) Forecast by Region, 2018 to 2033

Table 2: Global Market Value (US$ Million) Forecast by Drug Class, 2018 to 2033

Table 3: Global Market Value (US$ Million) Forecast by Route of Administration, 2018 to 2033

Table 4: Global Market Value (US$ Million) Forecast by End-User, 2018 to 2033

Table 5: North America Market Value (US$ Million) Forecast by Country, 2018 to 2033

Table 6: North America Market Value (US$ Million) Forecast by Drug Class, 2018 to 2033

Table 7: North America Market Value (US$ Million) Forecast by Route of Administration, 2018 to 2033

Table 8: North America Market Value (US$ Million) Forecast by End-User, 2018 to 2033

Table 9: Latin America Market Value (US$ Million) Forecast by Country, 2018 to 2033

Table 10: Latin America Market Value (US$ Million) Forecast by Drug Class, 2018 to 2033

Table 11: Latin America Market Value (US$ Million) Forecast by Route of Administration, 2018 to 2033

Table 12: Latin America Market Value (US$ Million) Forecast by End-User, 2018 to 2033

Table 13: Europe Market Value (US$ Million) Forecast by Country, 2018 to 2033

Table 14: Europe Market Value (US$ Million) Forecast by Drug Class, 2018 to 2033

Table 15: Europe Market Value (US$ Million) Forecast by Route of Administration, 2018 to 2033

Table 16: Europe Market Value (US$ Million) Forecast by End-User, 2018 to 2033

Table 17: South Asia Market Value (US$ Million) Forecast by Country, 2018 to 2033

Table 18: South Asia Market Value (US$ Million) Forecast by Drug Class, 2018 to 2033

Table 19: South Asia Market Value (US$ Million) Forecast by Route of Administration, 2018 to 2033

Table 20: South Asia Market Value (US$ Million) Forecast by End-User, 2018 to 2033

Table 21: East Asia Market Value (US$ Million) Forecast by Country, 2018 to 2033

Table 22: East Asia Market Value (US$ Million) Forecast by Drug Class, 2018 to 2033

Table 23: East Asia Market Value (US$ Million) Forecast by Route of Administration, 2018 to 2033

Table 24: East Asia Market Value (US$ Million) Forecast by End-User, 2018 to 2033

Table 25: Oceania Market Value (US$ Million) Forecast by Country, 2018 to 2033

Table 26: Oceania Market Value (US$ Million) Forecast by Drug Class, 2018 to 2033

Table 27: Oceania Market Value (US$ Million) Forecast by Route of Administration, 2018 to 2033

Table 28: Oceania Market Value (US$ Million) Forecast by End-User, 2018 to 2033

Table 29: MEA Market Value (US$ Million) Forecast by Country, 2018 to 2033

Table 30: MEA Market Value (US$ Million) Forecast by Drug Class, 2018 to 2033

Table 31: MEA Market Value (US$ Million) Forecast by Route of Administration, 2018 to 2033

Table 32: MEA Market Value (US$ Million) Forecast by End-User, 2018 to 2033
Sabyasachi Ghosh
Sabyasachi Ghosh

Principal Consultant

Talk to Analyst

Find your sweet spots for generating winning opportunities in this market.

List of Charts

Figure 1: Global Market Value (US$ Million) by Drug Class, 2023 to 2033

Figure 2: Global Market Value (US$ Million) by Route of Administration, 2023 to 2033

Figure 3: Global Market Value (US$ Million) by End-User, 2023 to 2033

Figure 4: Global Market Value (US$ Million) by Region, 2023 to 2033

Figure 5: Global Market Value (US$ Million) Analysis by Region, 2018 to 2033

Figure 6: Global Market Value Share (%) and BPS Analysis by Region, 2023 to 2033

Figure 7: Global Market Y-o-Y Growth (%) Projections by Region, 2023 to 2033

Figure 8: Global Market Value (US$ Million) Analysis by Drug Class, 2018 to 2033

Figure 9: Global Market Value Share (%) and BPS Analysis by Drug Class, 2023 to 2033

Figure 10: Global Market Y-o-Y Growth (%) Projections by Drug Class, 2023 to 2033

Figure 11: Global Market Value (US$ Million) Analysis by Route of Administration, 2018 to 2033

Figure 12: Global Market Value Share (%) and BPS Analysis by Route of Administration, 2023 to 2033

Figure 13: Global Market Y-o-Y Growth (%) Projections by Route of Administration, 2023 to 2033

Figure 14: Global Market Value (US$ Million) Analysis by End-User, 2018 to 2033

Figure 15: Global Market Value Share (%) and BPS Analysis by End-User, 2023 to 2033

Figure 16: Global Market Y-o-Y Growth (%) Projections by End-User, 2023 to 2033

Figure 17: Global Market Attractiveness by Drug Class, 2023 to 2033

Figure 18: Global Market Attractiveness by Route of Administration, 2023 to 2033

Figure 19: Global Market Attractiveness by End-User, 2023 to 2033

Figure 20: Global Market Attractiveness by Region, 2023 to 2033

Figure 21: North America Market Value (US$ Million) by Drug Class, 2023 to 2033

Figure 22: North America Market Value (US$ Million) by Route of Administration, 2023 to 2033

Figure 23: North America Market Value (US$ Million) by End-User, 2023 to 2033

Figure 24: North America Market Value (US$ Million) by Country, 2023 to 2033

Figure 25: North America Market Value (US$ Million) Analysis by Country, 2018 to 2033

Figure 26: North America Market Value Share (%) and BPS Analysis by Country, 2023 to 2033

Figure 27: North America Market Y-o-Y Growth (%) Projections by Country, 2023 to 2033

Figure 28: North America Market Value (US$ Million) Analysis by Drug Class, 2018 to 2033

Figure 29: North America Market Value Share (%) and BPS Analysis by Drug Class, 2023 to 2033

Figure 30: North America Market Y-o-Y Growth (%) Projections by Drug Class, 2023 to 2033

Figure 31: North America Market Value (US$ Million) Analysis by Route of Administration, 2018 to 2033

Figure 32: North America Market Value Share (%) and BPS Analysis by Route of Administration, 2023 to 2033

Figure 33: North America Market Y-o-Y Growth (%) Projections by Route of Administration, 2023 to 2033

Figure 34: North America Market Value (US$ Million) Analysis by End-User, 2018 to 2033

Figure 35: North America Market Value Share (%) and BPS Analysis by End-User, 2023 to 2033

Figure 36: North America Market Y-o-Y Growth (%) Projections by End-User, 2023 to 2033

Figure 37: North America Market Attractiveness by Drug Class, 2023 to 2033

Figure 38: North America Market Attractiveness by Route of Administration, 2023 to 2033

Figure 39: North America Market Attractiveness by End-User, 2023 to 2033

Figure 40: North America Market Attractiveness by Country, 2023 to 2033

Figure 41: Latin America Market Value (US$ Million) by Drug Class, 2023 to 2033

Figure 42: Latin America Market Value (US$ Million) by Route of Administration, 2023 to 2033

Figure 43: Latin America Market Value (US$ Million) by End-User, 2023 to 2033

Figure 44: Latin America Market Value (US$ Million) by Country, 2023 to 2033

Figure 45: Latin America Market Value (US$ Million) Analysis by Country, 2018 to 2033

Figure 46: Latin America Market Value Share (%) and BPS Analysis by Country, 2023 to 2033

Figure 47: Latin America Market Y-o-Y Growth (%) Projections by Country, 2023 to 2033

Figure 48: Latin America Market Value (US$ Million) Analysis by Drug Class, 2018 to 2033

Figure 49: Latin America Market Value Share (%) and BPS Analysis by Drug Class, 2023 to 2033

Figure 50: Latin America Market Y-o-Y Growth (%) Projections by Drug Class, 2023 to 2033

Figure 51: Latin America Market Value (US$ Million) Analysis by Route of Administration, 2018 to 2033

Figure 52: Latin America Market Value Share (%) and BPS Analysis by Route of Administration, 2023 to 2033

Figure 53: Latin America Market Y-o-Y Growth (%) Projections by Route of Administration, 2023 to 2033

Figure 54: Latin America Market Value (US$ Million) Analysis by End-User, 2018 to 2033

Figure 55: Latin America Market Value Share (%) and BPS Analysis by End-User, 2023 to 2033

Figure 56: Latin America Market Y-o-Y Growth (%) Projections by End-User, 2023 to 2033

Figure 57: Latin America Market Attractiveness by Drug Class, 2023 to 2033

Figure 58: Latin America Market Attractiveness by Route of Administration, 2023 to 2033

Figure 59: Latin America Market Attractiveness by End-User, 2023 to 2033

Figure 60: Latin America Market Attractiveness by Country, 2023 to 2033

Figure 61: Europe Market Value (US$ Million) by Drug Class, 2023 to 2033

Figure 62: Europe Market Value (US$ Million) by Route of Administration, 2023 to 2033

Figure 63: Europe Market Value (US$ Million) by End-User, 2023 to 2033

Figure 64: Europe Market Value (US$ Million) by Country, 2023 to 2033

Figure 65: Europe Market Value (US$ Million) Analysis by Country, 2018 to 2033

Figure 66: Europe Market Value Share (%) and BPS Analysis by Country, 2023 to 2033

Figure 67: Europe Market Y-o-Y Growth (%) Projections by Country, 2023 to 2033

Figure 68: Europe Market Value (US$ Million) Analysis by Drug Class, 2018 to 2033

Figure 69: Europe Market Value Share (%) and BPS Analysis by Drug Class, 2023 to 2033

Figure 70: Europe Market Y-o-Y Growth (%) Projections by Drug Class, 2023 to 2033

Figure 71: Europe Market Value (US$ Million) Analysis by Route of Administration, 2018 to 2033

Figure 72: Europe Market Value Share (%) and BPS Analysis by Route of Administration, 2023 to 2033

Figure 73: Europe Market Y-o-Y Growth (%) Projections by Route of Administration, 2023 to 2033

Figure 74: Europe Market Value (US$ Million) Analysis by End-User, 2018 to 2033

Figure 75: Europe Market Value Share (%) and BPS Analysis by End-User, 2023 to 2033

Figure 76: Europe Market Y-o-Y Growth (%) Projections by End-User, 2023 to 2033

Figure 77: Europe Market Attractiveness by Drug Class, 2023 to 2033

Figure 78: Europe Market Attractiveness by Route of Administration, 2023 to 2033

Figure 79: Europe Market Attractiveness by End-User, 2023 to 2033

Figure 80: Europe Market Attractiveness by Country, 2023 to 2033

Figure 81: South Asia Market Value (US$ Million) by Drug Class, 2023 to 2033

Figure 82: South Asia Market Value (US$ Million) by Route of Administration, 2023 to 2033

Figure 83: South Asia Market Value (US$ Million) by End-User, 2023 to 2033

Figure 84: South Asia Market Value (US$ Million) by Country, 2023 to 2033

Figure 85: South Asia Market Value (US$ Million) Analysis by Country, 2018 to 2033

Figure 86: South Asia Market Value Share (%) and BPS Analysis by Country, 2023 to 2033

Figure 87: South Asia Market Y-o-Y Growth (%) Projections by Country, 2023 to 2033

Figure 88: South Asia Market Value (US$ Million) Analysis by Drug Class, 2018 to 2033

Figure 89: South Asia Market Value Share (%) and BPS Analysis by Drug Class, 2023 to 2033

Figure 90: South Asia Market Y-o-Y Growth (%) Projections by Drug Class, 2023 to 2033

Figure 91: South Asia Market Value (US$ Million) Analysis by Route of Administration, 2018 to 2033

Figure 92: South Asia Market Value Share (%) and BPS Analysis by Route of Administration, 2023 to 2033

Figure 93: South Asia Market Y-o-Y Growth (%) Projections by Route of Administration, 2023 to 2033

Figure 94: South Asia Market Value (US$ Million) Analysis by End-User, 2018 to 2033

Figure 95: South Asia Market Value Share (%) and BPS Analysis by End-User, 2023 to 2033

Figure 96: South Asia Market Y-o-Y Growth (%) Projections by End-User, 2023 to 2033

Figure 97: South Asia Market Attractiveness by Drug Class, 2023 to 2033

Figure 98: South Asia Market Attractiveness by Route of Administration, 2023 to 2033

Figure 99: South Asia Market Attractiveness by End-User, 2023 to 2033

Figure 100: South Asia Market Attractiveness by Country, 2023 to 2033

Figure 101: East Asia Market Value (US$ Million) by Drug Class, 2023 to 2033

Figure 102: East Asia Market Value (US$ Million) by Route of Administration, 2023 to 2033

Figure 103: East Asia Market Value (US$ Million) by End-User, 2023 to 2033

Figure 104: East Asia Market Value (US$ Million) by Country, 2023 to 2033

Figure 105: East Asia Market Value (US$ Million) Analysis by Country, 2018 to 2033

Figure 106: East Asia Market Value Share (%) and BPS Analysis by Country, 2023 to 2033

Figure 107: East Asia Market Y-o-Y Growth (%) Projections by Country, 2023 to 2033

Figure 108: East Asia Market Value (US$ Million) Analysis by Drug Class, 2018 to 2033

Figure 109: East Asia Market Value Share (%) and BPS Analysis by Drug Class, 2023 to 2033

Figure 110: East Asia Market Y-o-Y Growth (%) Projections by Drug Class, 2023 to 2033

Figure 111: East Asia Market Value (US$ Million) Analysis by Route of Administration, 2018 to 2033

Figure 112: East Asia Market Value Share (%) and BPS Analysis by Route of Administration, 2023 to 2033

Figure 113: East Asia Market Y-o-Y Growth (%) Projections by Route of Administration, 2023 to 2033

Figure 114: East Asia Market Value (US$ Million) Analysis by End-User, 2018 to 2033

Figure 115: East Asia Market Value Share (%) and BPS Analysis by End-User, 2023 to 2033

Figure 116: East Asia Market Y-o-Y Growth (%) Projections by End-User, 2023 to 2033

Figure 117: East Asia Market Attractiveness by Drug Class, 2023 to 2033

Figure 118: East Asia Market Attractiveness by Route of Administration, 2023 to 2033

Figure 119: East Asia Market Attractiveness by End-User, 2023 to 2033

Figure 120: East Asia Market Attractiveness by Country, 2023 to 2033

Figure 121: Oceania Market Value (US$ Million) by Drug Class, 2023 to 2033

Figure 122: Oceania Market Value (US$ Million) by Route of Administration, 2023 to 2033

Figure 123: Oceania Market Value (US$ Million) by End-User, 2023 to 2033

Figure 124: Oceania Market Value (US$ Million) by Country, 2023 to 2033

Figure 125: Oceania Market Value (US$ Million) Analysis by Country, 2018 to 2033

Figure 126: Oceania Market Value Share (%) and BPS Analysis by Country, 2023 to 2033

Figure 127: Oceania Market Y-o-Y Growth (%) Projections by Country, 2023 to 2033

Figure 128: Oceania Market Value (US$ Million) Analysis by Drug Class, 2018 to 2033

Figure 129: Oceania Market Value Share (%) and BPS Analysis by Drug Class, 2023 to 2033

Figure 130: Oceania Market Y-o-Y Growth (%) Projections by Drug Class, 2023 to 2033

Figure 131: Oceania Market Value (US$ Million) Analysis by Route of Administration, 2018 to 2033

Figure 132: Oceania Market Value Share (%) and BPS Analysis by Route of Administration, 2023 to 2033

Figure 133: Oceania Market Y-o-Y Growth (%) Projections by Route of Administration, 2023 to 2033

Figure 134: Oceania Market Value (US$ Million) Analysis by End-User, 2018 to 2033

Figure 135: Oceania Market Value Share (%) and BPS Analysis by End-User, 2023 to 2033

Figure 136: Oceania Market Y-o-Y Growth (%) Projections by End-User, 2023 to 2033

Figure 137: Oceania Market Attractiveness by Drug Class, 2023 to 2033

Figure 138: Oceania Market Attractiveness by Route of Administration, 2023 to 2033

Figure 139: Oceania Market Attractiveness by End-User, 2023 to 2033

Figure 140: Oceania Market Attractiveness by Country, 2023 to 2033

Figure 141: MEA Market Value (US$ Million) by Drug Class, 2023 to 2033

Figure 142: MEA Market Value (US$ Million) by Route of Administration, 2023 to 2033

Figure 143: MEA Market Value (US$ Million) by End-User, 2023 to 2033

Figure 144: MEA Market Value (US$ Million) by Country, 2023 to 2033

Figure 145: MEA Market Value (US$ Million) Analysis by Country, 2018 to 2033

Figure 146: MEA Market Value Share (%) and BPS Analysis by Country, 2023 to 2033

Figure 147: MEA Market Y-o-Y Growth (%) Projections by Country, 2023 to 2033

Figure 148: MEA Market Value (US$ Million) Analysis by Drug Class, 2018 to 2033

Figure 149: MEA Market Value Share (%) and BPS Analysis by Drug Class, 2023 to 2033

Figure 150: MEA Market Y-o-Y Growth (%) Projections by Drug Class, 2023 to 2033

Figure 151: MEA Market Value (US$ Million) Analysis by Route of Administration, 2018 to 2033

Figure 152: MEA Market Value Share (%) and BPS Analysis by Route of Administration, 2023 to 2033

Figure 153: MEA Market Y-o-Y Growth (%) Projections by Route of Administration, 2023 to 2033

Figure 154: MEA Market Value (US$ Million) Analysis by End-User, 2018 to 2033

Figure 155: MEA Market Value Share (%) and BPS Analysis by End-User, 2023 to 2033

Figure 156: MEA Market Y-o-Y Growth (%) Projections by End-User, 2023 to 2033

Figure 157: MEA Market Attractiveness by Drug Class, 2023 to 2033

Figure 158: MEA Market Attractiveness by Route of Administration, 2023 to 2033

Figure 159: MEA Market Attractiveness by End-User, 2023 to 2033

Figure 160: MEA Market Attractiveness by Country, 2023 to 2033

Recommendations

Healthcare

Lung Disease Therapeutics Market

Published : July 2023

Healthcare

Respiratory Pathogen Testing Kits Market

Published : March 2023

Healthcare

Pediatric Respiratory Syncytial Virus Infection Market

Published : January 2023

Explore Healthcare Insights

View Reports

Respiratory Distress Syndrome Management Market