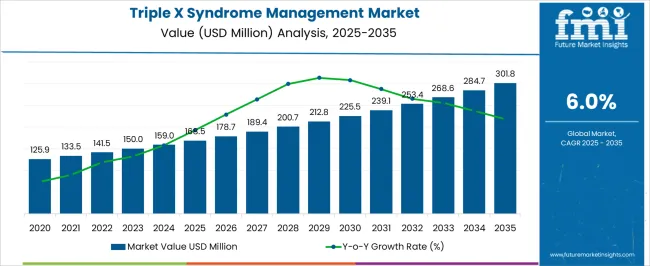
The Triple X Syndrome Management Market is estimated to be valued at USD 168.5 million in 2025 and is projected to reach USD 301.8 million by 2035, registering a compound annual growth rate (CAGR) of 6.0% over the forecast period.

| Metric | Value |
|---|---|
| Triple X Syndrome Management Market Estimated Value in (2025 E) | USD 168.5 million |
| Triple X Syndrome Management Market Forecast Value in (2035 F) | USD 301.8 million |
| Forecast CAGR (2025 to 2035) | 6.0% |
The triple X syndrome management market is experiencing steady development supported by growing awareness, advancements in genetic testing, and the increasing emphasis on early diagnosis. Healthcare providers are focusing on timely interventions to address developmental, behavioral, and reproductive health concerns associated with the condition.
Periodic screening and improved access to chromosomal analysis have enabled earlier detection, which supports more effective management and counseling. Expanding healthcare infrastructure and supportive policy frameworks are reinforcing the adoption of screening programs across both developed and emerging economies.
The outlook remains positive as advancements in genetic research, coupled with increasing patient advocacy, continue to shape strategies for more effective care and improved quality of life for affected individuals.
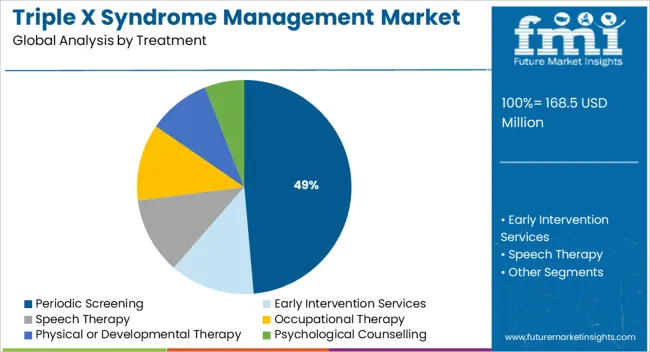
The market is segmented by Treatment and End-Users and region. By Treatment, the market is divided into Periodic Screening, Early Intervention Services, Speech Therapy, Occupational Therapy, Physical or Developmental Therapy, and Psychological Counselling. In terms of End-Users, the market is classified into Hospitals, Specialty Clinics, and Others. Regionally, the market is classified into North America, Latin America, Western Europe, Eastern Europe, Balkan & Baltic Countries, Russia & Belarus, Central Asia, East Asia, South Asia & Pacific, and the Middle East & Africa.

The periodic screening segment is expected to account for 48.60% of total revenue by 2025 within the treatment category, making it the most prominent segment. This dominance is being driven by the growing emphasis on early detection, which allows for timely interventions to address physical, developmental, and behavioral challenges associated with the condition.
Regular screening enhances the ability of healthcare providers to monitor health progress and reduce risks linked to undiagnosed complications. Increasing adoption of advanced diagnostic technologies and genetic counseling support has further strengthened the role of periodic screening in the overall treatment landscape.
As awareness continues to rise, periodic screening is positioned to remain the cornerstone of effective triple X syndrome management.
The COVID-19 pandemic disrupted the market for triple X syndrome management. Several research studies have shed light on the impact of the pandemic on the market under consideration. Apart from that various organizations have taken initiatives for the treatment in past years which propelled the market growth. For instance, NORD and the MedicAlert Foundation have collaborated on a special initiative to protect rare disease patients in emergency cases.
Over the forecast period, the market is expected to witness major growth. The market's new emerging research organizations are equipped with and employ the knowledge of specialists from a variety of clinical disciplines, resulting in significant progress in understanding triple x-related ailments and treatment. The development of an easy scoring system to select individuals for triple X syndrome testing will almost definitely boost the worldwide market. PCR tests are currently used for the identification of these ailments with genetic instability, which aids in disease identification and diagnosis.
Early recognition and intervention are critical for market growth
Early detection and intervention can help girls who are experiencing behavioral issues, such as delays in learning language and motor skills. Various research studies shed light on rising treatment patterns for this disease. For example, in October 2024, the American Academy of Pediatrics released a study titled Reading Proficiency Trends Following Newborn Hearing Screening Implementation, which indicated that substantial progress in reading comprehension was illustrated after Early Hearing Detection and Intervention implementation, as all groups of kids with hearing impairment became more likely to accomplish proficient and sophisticated reading levels.
Also, Additionally, educational guidance can teach girls how to keep up with schoolwork. Some girls may be eligible for an individualized educational program(IEP) or a 504 education plan, which are aimed at helping children with special needs. Recently. As a result, this factor is expected to propel the triple X syndrome management market.
Psychological Counselling for children and adults drives the market growth
Psychological counseling for children and adults may aid in the resolution of social adaptation and stress concerns. Individuals and guardians of triple X syndrome girls can benefit from support networks. Advanced strategies and initiatives in psychological counseling are expected to drive market growth.
For example, the Office of Religious Life (ORL), Counseling and Psychological Services (CPS), and Undergraduate Student Government (USG) are all attempting to improve mental health resources on campus. The University has committed to implementing the Mental Health Resources Task Force's recommendations to improve student well-being.
Over the forecast period, the global triple X syndrome treatment market may be hampered by a lack of qualified personnel who are incapable of performing these treatments. The elevated costs associated with surgeries and treatment methods are also expected to limit the market growth. Many market participants invest heavily in installing new and sophisticated treatment processes to speed up the recovery processes, which raises the cost.

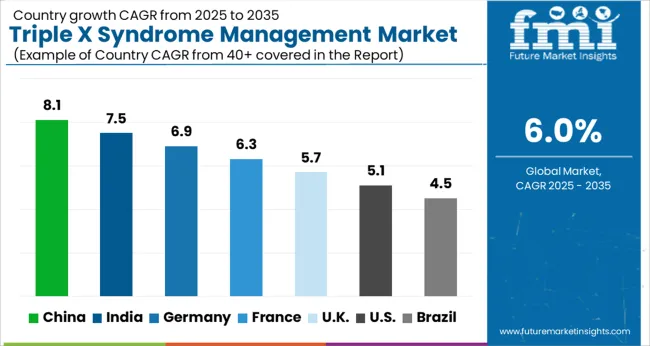
The region's high incidence of rare diseases drives sales growth
Every day, 5-10 girls are born in the USA with the syndrome. Triple X Syndrome is an uncommon disease with fewer than 200,000 cases in the USA. Therefore, the high prevalence of the disease is expected to propel the market.
According to the Organization for Rare Disorders (CORD) Report 2024, approximately one in every twelve Canadians is impacted by a rare disease each year, with genetic changes accounting for approximately 80% of these diseases. As a result of the high prevalence of rare diseases in the region, the triple X syndrome management market is expected to grow significantly during the forecast period.
Increased research and advancement drive the regional market
The Asia-Pacific region is expected to expand in the upcoming years as a consequence of increased research and advancement in the triple X syndrome therapeutics market. The region's development can be attributed to government initiatives to assist orphan disease patients.
For example, the Indian government directed national and state governments in July 2025 to ensure the successful implementation of healthcare programs developed to treat patients affected by orphan diseases. This measure allows manufacturers to supply high-quality orphan prescription drugs to the government while also earning revenue which will further expand the market growth.
The hospital Segment is Estimated to Hold the Largest Share
In terms of end users, the hospital segment held the highest market share in 2025. Furthermore, the same segment is expected to grow at the fastest rate between 2025 and 2035. Because of the increased health risk associated with respiratory issues and scoliosis, the majority of individuals are treated in hospitals. Based on the Orphanet Journal of Rare Diseases (2024), affected children aged 0 to 4 years had the highest inpatient ratio.
Speech therapy segment to generate high revenue
Over the projected timeframe, the speech therapy segment is expected to expand significantly. Furthermore, the speech therapy segment is being driven by an increase in the number of instances of speech disorders and neurological diseases, which is propelling the market growth.
Based on the Alzheimer Society of Canada, over 500,000 Canadians have been living with dementia (language difficulties) in 2024, with the number expected to rise to 912,000 by 2035. This segment is expected to grow at a 5.8% CAGR over the next several decades.
Notable start-ups to solidify their market presence, participants in the triple X syndrome management market sector are presenting novel and innovative product lines, and the aforementioned start-ups have left no stone unturned. Some concrete examples of substantial triple X syndrome management market start-ups are as follows:
Key players in the Triple X Syndrome Management market are Centogene N.V., Eurofins Discovery, Hoffmann-La Roche Ltd., Invitae Corporation, Illumina Inc, Natera Inc, PerkinElmer Inc, Quest Diagnostics Incorporated, Eurofins LifeCodexx GmbH, Ravgen. Some of the developments by key players are below
| Report Attribute | Details |
|---|---|
| Expected Market Value (2025) | USD 168.5 million |
| Anticipated Forecast Value (2035) | USD 301.8 million |
| Projected Growth Rate (2025 to 2035) | 6% CAGR |
| Base Year for Estimation | 2025 |
| Historical Data | 2020 to 2025 |
| Forecast Period | 2025 to 2035 |
| Quantitative Units | Revenue in USD Billion and CAGR from 2025 to 2035 |
| Report Coverage | Revenue Forecast, Volume Forecast, Company Ranking, Competitive Landscape, Growth Factors, Trends, and Pricing Analysis |
| Segments Covered | Treatment Type, End-user, Region |
| Regions Covered | North America; Latin America; Europe; Asia Pacific; Middle East and Africa (MEA) |
| Key Countries Profiled | USA, Canada, Brazil, Mexico, Mexico, Germany, UK, France, Spain, Italy, India, Malaysia, Singapore, Thailand, China, Japan, South Korea, Australia, New Zealand, GCC Countries, South Africa, Israel |
| Key Companies Profiled | Centogene N.V., Eurofins Discovery, Hoffmann-La Roche Ltd., Invitae Corporation, Illumina Inc, Natera Inc, PerkinElmer Inc, Quest Diagnostics Incorporated, Eurofins LifeCodexx GmbH, Ravgen |
| Customization | Available Upon Request |
The global triple x syndrome management market is estimated to be valued at USD 168.5 million in 2025.
The market size for the triple x syndrome management market is projected to reach USD 301.8 million by 2035.
The triple x syndrome management market is expected to grow at a 6.0% CAGR between 2025 and 2035.
The key product types in triple x syndrome management market are periodic screening, early intervention services, speech therapy, occupational therapy, physical or developmental therapy and psychological counselling.
In terms of end-users, hospitals segment to command 55.2% share in the triple x syndrome management market in 2025.


Full Research Suite comprises of:
Market outlook & trends analysis
Interviews & case studies
Strategic recommendations
Vendor profiles & capabilities analysis
5-year forecasts
8 regions and 60+ country-level data splits
Market segment data splits
12 months of continuous data updates
DELIVERED AS:
PDF EXCEL ONLINE
X-Band Radar Market Size and Share Forecast Outlook 2025 to 2035
XEDS Detectors Market Size and Share Forecast Outlook 2025 to 2035
Xylose Market Size and Share Forecast Outlook 2025 to 2035
Xylooligosaccharide Market Size and Share Forecast Outlook 2025 to 2035
Xylitol Market Size and Share Forecast Outlook 2025 to 2035
X-Ray Positioning Devices Market Size and Share Forecast Outlook 2025 to 2035
X-Ray Device Market Size and Share Forecast Outlook 2025 to 2035
XXL Packaging Market Size and Share Forecast Outlook 2025 to 2035
X-ray System Market Analysis - Size, Share, and Forecast 2025 to 2035
Xylanase Market Analysis - Size, Share & Forecast 2025 to 2035
Xanthan Gum Market Analysis by Function, Form, Application, Grade and Region Through 2035
Ximenia Oil Market Analysis by Function, Distribution Channel, End Use, and Region through 2025 to 2035
Competitive Overview of Xylenols Market Share
X-by-Wire Market Growth – Trends & Forecast 2025 to 2035
X-ray Photoelectron Spectroscopy Market Insights - Growth & Forecast 2024 to 2034
Xenon Gas Market Growth - Trends & Forecast 2024 to 2034
Xylose Absorption Tests Market
XRF Analyzer Market Growth – Trends & Forecast 2019-2027
X-Ray Stretchers Market
X-Ray Aprons Market

Thank you!
You will receive an email from our Business Development Manager. Please be sure to check your SPAM/JUNK folder too.
Chat With
MaRIA