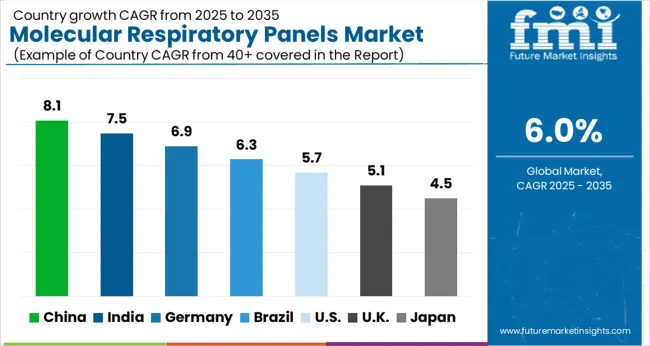
The Molecular Respiratory Panels Market is estimated to be valued at USD 1.2 billion in 2025 and is projected to reach USD 2.2 billion by 2035, registering a compound annual growth rate (CAGR) of 6.0% over the forecast period.
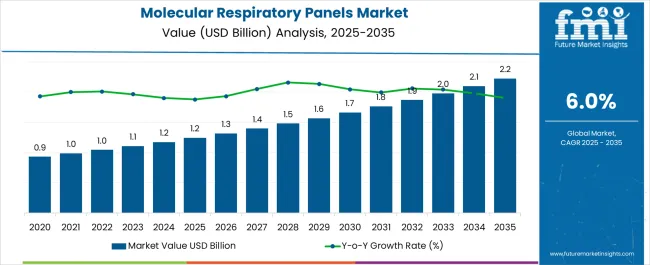
| Metric | Value |
|---|---|
| Molecular Respiratory Panels Market Estimated Value in (2025 E) | USD 1.2 billion |
| Molecular Respiratory Panels Market Forecast Value in (2035 F) | USD 2.2 billion |
| Forecast CAGR (2025 to 2035) | 6.0% |
The molecular respiratory panels market is experiencing robust growth as healthcare systems prioritize early detection and comprehensive diagnosis of respiratory infections. Rising incidences of viral and bacterial respiratory illnesses, combined with seasonal flu outbreaks and the lingering impact of COVID 19, are creating strong demand for rapid and accurate testing solutions.
Multiplexing capabilities, which allow simultaneous detection of multiple pathogens, are being increasingly adopted to improve diagnostic efficiency and reduce turnaround times. Advances in molecular techniques such as polymerase chain reaction are further strengthening clinical accuracy and reliability.
Growing awareness of antimicrobial stewardship and the need to reduce inappropriate antibiotic use are also enhancing adoption of molecular respiratory panels. With healthcare infrastructures investing in point of care testing and integrated laboratory workflows, the market outlook remains highly favorable for innovation and sustained adoption.
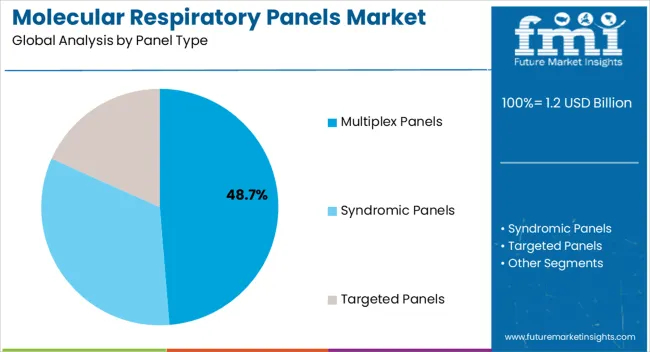
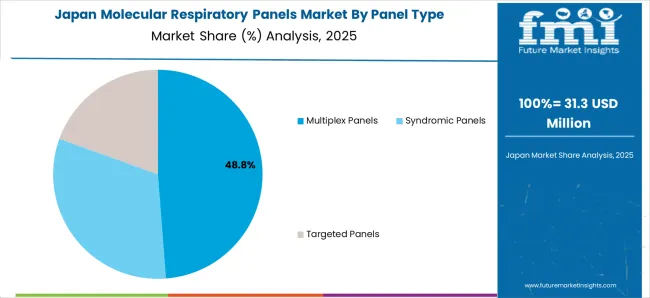
The multiplex panels segment is projected to hold 48.70% of total revenue by 2025, making it the leading panel type. This dominance is supported by the ability to simultaneously detect a wide range of pathogens in a single test, reducing the need for multiple assays and saving valuable diagnostic time.
Multiplex formats enable clinicians to identify co infections more effectively, improving treatment accuracy and patient outcomes. Their efficiency in high volume testing and ability to streamline laboratory processes have contributed to their strong adoption.
As healthcare providers continue to emphasize rapid and comprehensive diagnostics, multiplex panels have secured their position as the most influential segment in the molecular respiratory panels market.
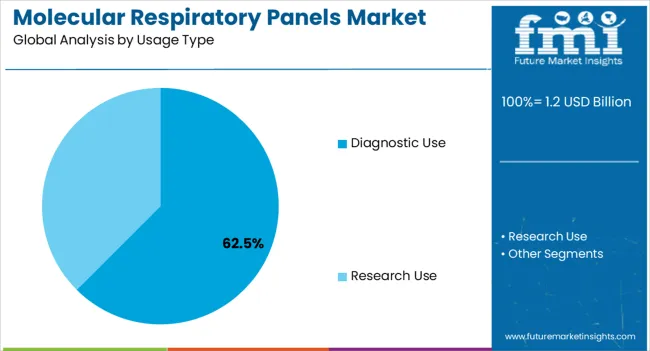
The diagnostic use segment is anticipated to account for 62.50% of the market share by 2025, positioning it as the most significant usage type. This growth is attributed to the rising demand for accurate patient diagnosis in both hospital and outpatient settings.
Diagnostic use has been prioritized due to the pressing need for timely clinical decisions that guide effective treatment strategies. Additionally, increased investments in healthcare infrastructure and laboratory automation have amplified reliance on diagnostic molecular panels.
Their proven role in reducing misdiagnosis, improving patient outcomes, and supporting evidence based clinical practices has reinforced their prominence within the usage category.
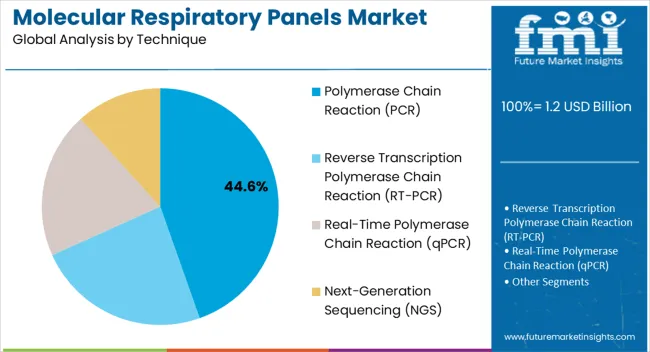
The polymerase chain reaction technique is expected to represent 44.60% of total market revenue by 2025 within the technique category, making it the leading method. PCR has gained this position due to its high sensitivity, specificity, and rapid turnaround time in identifying respiratory pathogens.
Continuous advancements in real time PCR technologies and automated systems have enabled more accurate and efficient testing across both centralized laboratories and point of care environments. The scalability and robustness of PCR platforms have ensured their integration into routine clinical workflows.
As healthcare systems demand reliable and standardized molecular diagnostics, PCR remains the technique of choice, maintaining its leadership in the molecular respiratory panels market.
From 2.2020 to 2.202.22.2, the global molecular respiratory panels’ market experienced a CAGR of 9.2.2%, reaching a market size of USD 1.2 million in 2.202.23.
From 2.2020 to 2.202.22.2, the global molecular respiratory panels’’ market industry witnessed steady growth due to the increased prevalence of respiratory illnesses and technological advancements. Significant advances in molecular diagnostic technology have occurred throughout the years, including the creation of polymerase chain reaction (PCR) and other nucleic acid amplification techniques. These technological improvements have enhanced the sensitivity, specificity, and multiplexing capabilities of molecular respiratory panels’, which has contributed to the growth of the market.
Respiratory diseases, such as influenza, respiratory syncytial virus (RSV), and other respiratory pathogens, have long been a source of worry across the world. The growing prevalence of these illnesses has increased need for reliable and speedy diagnostic tests, propelling the molecular respiratory panels’ market forward.
Future Forecast for Molecular Respiratory Panels Market Industry:
Looking ahead, the global molecular respiratory panels’’ market industry is expected to rise at a CAGR of 6.3% from 2.202.23 to 2.2035. During the forecast period, the market size is expected to reach USD 2.2.0 billion by 2.2035.
The molecular respiratory panels’’ market industry is expected to continue its growth trajectory from 2.202.23 to 2.2035. As the benefits and capabilities of molecular respiratory panels’ become more generally recognized, healthcare practitioners are likely to become more aware and employ them. The requirement for accurate and quick diagnosis, as well as infection management and monitoring, will drive the expansion of the molecular respiratory panel market.
The requirement for quick results and decentralized testing will push the need for point-of-care testing to expand further. Molecular respiratory panels’ that may be conducted at the point of treatment, such as in clinics or emergency rooms, are expected to acquire market traction.
| Country | The United States |
|---|---|
| Market Size (USD Million) by End of Forecast Period (2035) | USD 2.2 million |
| CAGR % 2025 to End of Forecast (2035) | 7.0% |
The molecular respiratory panels’’ market industry in the United States is expected to reach a market size of USD 2.2 million by 2035, expanding at a CAGR of 7.0%. The incidence of chronic respiratory disorders in the nation is increasing, which is driving up demand for the industry. For instance, the USA Centers for Disease Control and Prevention (CDC) 2025 report showed that in 8 out of 10 public health districts in the USA, the prevalence of respiratory syncytial virus (RSV) is rising.
| Country | The United Kingdom |
|---|---|
| Market Size (USD Million) by End of Forecast Period (2035) | USD 73.6 million |
| CAGR % 2025 to End of Forecast (2035) | 5.3% |
The molecular respiratory panels’’ market industry in the United Kingdom is expected to reach a market share of USD 73.6 million, expanding at a CAGR of 5.3% during the forecast period. Strict laws for the mining sector increase the usage of the molecular respiratory panels’. In the EU there are around 53,000 people employed by coal power stations. The EU’s regulatory body also conducts routine checkups of these workers, which boosts demand for molecular respiratory panels’.
| Country | China |
|---|---|
| Market Size (USD Million) by End of Forecast Period (2035) | USD 180.6 million |
| CAGR % 2025 to End of Forecast (2035) | 7.7% |
The molecular respiratory panels’’ market industry in China is anticipated to reach a market size of USD 180.6 million, moving at a CAGR of 7.7% during the forecast period. The molecular respiratory panel’s market industry in China is expected to grow prominently due to the increasing population with respiratory illness. China has a big population, and respiratory illnesses such as influenza, Respiratory syncytial (RSV), and other respiratory pathogens are common. The rising prevalence of these illnesses is raising the requirement for precise and effective diagnostic techniques such as molecular respiratory panels’.
| Country | Japan |
|---|---|
| Market Size (USD Million) by End of Forecast Period (2035) | USD 126.0 million |
| CAGR % 2025 to End of Forecast (2035) | 7.4% |
The molecular respiratory panels’ market industry in Japan is estimated to reach a market size of USD 126.0 million by 2035, thriving at a CAGR of 7.4%. The market in Japan is predicted to grow because of high geriatric population. Japan has one of the world's oldest populations, and respiratory illnesses such as pneumonia and influenza are widespread among the elderly. The growing older population in Japan, as well as the requirement for precise respiratory illness detection, are projected to boost demand for molecular respiratory panels.
| Country | South Korea |
|---|---|
| Market Size (USD Million) by End of Forecast Period (2035) | USD 49.3 million |
| CAGR % 2025 to End of Forecast (2035) | 6.8% |
The molecular respiratory panels’ market industry in South Korea is expected to reach a market size of USD 49.3 million, expanding at a CAGR of 6.8% during the forecast period. In the past, South Korea has had outbreaks of respiratory illnesses such as MERS (Middle East Respiratory Syndrome) and COVID-19. These incidents have raised public awareness of respiratory illnesses, resulting in a greater demand for reliable market data.
The multiplex panels is to dominate the molecular respiratory panels’ market industry with a market share of 50.4% in 2025. A multiplex molecular diagnostic platform would be a crucial component of a successful respiratory diagnostics method. For the identification of respiratory infections, NADT methods such as loop-mediated isothermal amplification and nucleic acid sequence-based amplification have been utilized.
Multiplexing, in which numerous targets are evaluated at the same time, is often used in PCR-based assays and offers substantial advantages in terms of efficiency and pathogen coverage over single-pathogen tests.
Diagnostic use is dominating the molecular respiratory panels’ market industry with market share of 65.8% in 2025. Molecular respiratory panels are generally used for diagnostic reasons since they are designed to detect and identify respiratory pathogens at the molecular level, delivering accurate and speedy findings for respiratory infection diagnosis.
Reverse transcription polymerase chain reaction (RT-PCR) is dominating the molecular respiratory panels’ market with the market share of 47.8% in 2025. RT-PCR may identify very low quantities of viral genetic material in patient samples. This great sensitivity enables for the early diagnosis of viral infections, even when the viral load is low in the early stages of the disease. It facilitates accurate diagnosis and patient management. This technique's great sensitivity is particularly appealing to healthcare professionals and individuals seeking to diagnose.
The diagnostic centers dominating the molecular respiratory panels’ market with the market share of 38.1% in 2025. Diagnostic centers often utilize molecular respiratory panels as part of their comprehensive testing services for respiratory infections. These panels offer several advantages, such as the ability to simultaneously test for multiple respiratory pathogens in a single assay, high sensitivity and specificity, and rapid turnaround times.
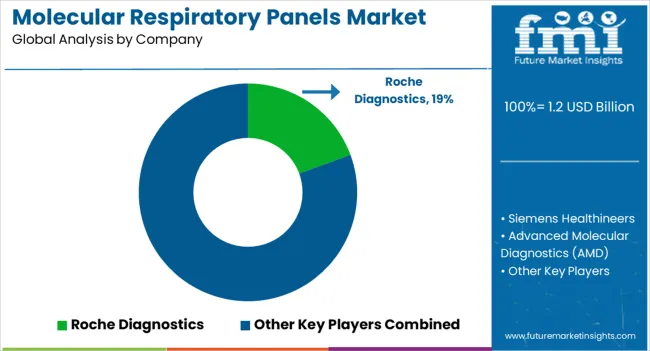
The molecular respiratory panel sector is aggressively competitive, with many companies fighting for market dominance. Key players in the molecular respiratory panels market employ various strategies to stay competitive and maintain their market position.
Key Strategies Used by the Participants
Key players invest in research and development activities to continuously improve their molecular respiratory panel products. By offering innovative and advanced products, companies can attract customers and differentiate themselves from competitors.
Key players form strategic partnerships and collaborations with other companies, academic institutions, and research organizations. These partnerships facilitate the exchange of knowledge, resources, and technologies, leading to the development of new products and solutions.
Companies focus on expanding their presence in different geographic regions. This involves establishing distribution channels, partnerships with local distributors, and obtaining necessary regulatory approvals in target markets.
Companies in the market may engage in mergers or acquisitions to consolidate their product portfolio, acquire new technologies, these strategic moves allow companies to enter new market segments, gain access to novel products or intellectual property, and achieve synergies in terms of research, manufacturing, or distributions.
Key Developments in the Molecular Respiratory Panels Market:
The global molecular respiratory panels market is estimated to be valued at USD 1.2 billion in 2025.
The market size for the molecular respiratory panels market is projected to reach USD 2.2 billion by 2035.
The molecular respiratory panels market is expected to grow at a 6.0% CAGR between 2025 and 2035.
The key product types in molecular respiratory panels market are multiplex panels, syndromic panels and targeted panels.
In terms of usage type, diagnostic use segment to command 62.5% share in the molecular respiratory panels market in 2025.


Full Research Suite comprises of:
Market outlook & trends analysis
Interviews & case studies
Strategic recommendations
Vendor profiles & capabilities analysis
5-year forecasts
8 regions and 60+ country-level data splits
Market segment data splits
12 months of continuous data updates
DELIVERED AS:
PDF EXCEL ONLINE
Molecular Diagnostic Market Size and Share Forecast Outlook 2025 to 2035
Molecular Diagnostics In Pharmacogenomics Market Size and Share Forecast Outlook 2025 to 2035
Molecular Biomarkers For Cancer Detection Market Size and Share Forecast Outlook 2025 to 2035
Molecular Cytogenetics Market Size and Share Forecast Outlook 2025 to 2035
Molecular Biology Enzymes, Kits & Reagents Market Trends and Forecast 2025 to 2035
Molecular Spectroscopy Market Insights - Growth & Forecast 2025 to 2035
Molecular Breast Imaging Market – Trends & Forecast 2025 to 2035
Molecular Quality Controls Market Overview - Trends & Forecast 2025 to 2035
Molecular Imaging Market is segmented by modality type, application and end user from 2025 to 2035
Molecular Microbiology Market
Low Molecular Weight Chondroitin Sulfate Sodium Market Size and Share Forecast Outlook 2025 to 2035
13X Molecular Sieve Activated Powder Market Size and Share Forecast Outlook 2025 to 2035
High Molecular Ammonium Polyphosphate Market Size and Share Forecast Outlook 2025 to 2035
Orthomolecular Medicine Market
Viral Molecular Diagnostics Market Size and Share Forecast Outlook 2025 to 2035
At-home Molecular Testing Market Size and Share Forecast Outlook 2025 to 2035
Automated Molecular Diagnostics Testing System Market Size and Share Forecast Outlook 2025 to 2035
Multiplex Molecular Diagnostics Market Size and Share Forecast Outlook 2025 to 2035
Veterinary Molecular Diagnostics Market Growth - Trends & Forecast 2025 to 2035
Market Share Distribution Among Ultra-High Molecular Weight Polyethylene Manufacturers

Thank you!
You will receive an email from our Business Development Manager. Please be sure to check your SPAM/JUNK folder too.
Chat With
MaRIA