At-home Molecular Testing Market
Market Survey on At-home Molecular Testing Market Covering Sales Outlook, Up-to-date Key Trends, Market Size and Forecast, Per Capita Expenditure, Company Share, Brand Share, Regulations, Reimbursement Scenario, Epidemiology, Procedure Numbers, and Pipeline Assessment
An In-depth Market Insights of At-home Molecular Testing Market including Cassettes, Strips, Test Panels, Dip Cards, and Midstreams Covering 30+ Countries like United States, United Kingdom, Germany, France, Norway, Sweden, Saudi Arabia, United Arab Emirates, Japan, Korea, Australia, New Zealand, and Others
At-home Molecular Testing Market Outlook (2023 to 2033)
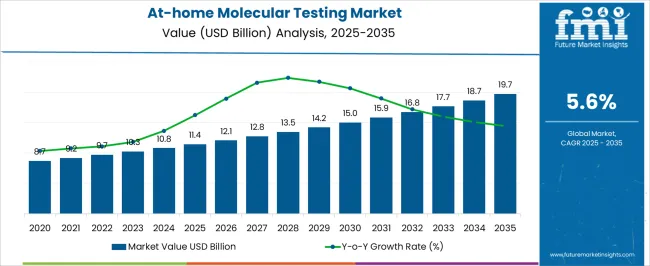
The at-home molecular testing market size is projected to be worth US$ 10.2 billion in 2023. The market is likely to surpass US$ 18.1 billion by 2033 at a CAGR of 5.9% during the forecast period. Increased infectious illnesses and an increase in the number of diabetes patients around the world are driving the market expansion. For instance, monkey pox and other infectious illnesses pose a severe threat to public health and economic development in all nations. Additionally, the need for early detection of various diseases and growing awareness of them are fueling market expansion.
The prospective growth of the at-home testing market was influenced by the population's growing awareness of home care testing.
Other Drivers Propelling the Demand for At-home Molecular Testing Market include:
- Due to the rise in diabetes prevalence, there is an increasing requirement for the market for molecular testing. As of 2021, 537 million individuals worldwide or about 10% of all adults aged 20 to 79 were living with diabetes, according to the latest recent IDF data.
- The production of the newest at-home testing tools and kits, as well as a growing understanding of the advantages offered by these services, are promoting market expansion.
- At-home kits are simple to obtain and are readily available at pharmacies and online retailers. Additionally, these at-home testing tools are accessible over the counter. As a result, the kits' widespread availability is promoting market expansion.
- The market for at-home testing kits or medical devices with improved healthcare services has grown as a result of an increase in R&D activity in the field of personalized self-assessment kits for the diagnosis of HIV illness
Challenges for Companies /Manufacturers in the At-home Molecular Testing Market:
- At home molecular testing kits or devices have undoubtedly eased the process of confirming the persons concern. However, uncertainty about the accuracy of the result is a key challenges for larger adoption.
- Other restraining factor for at-home molecular testing market is the complex and evolving regulatory landscape. Compliance with the regulations can be time-consuming and costly for companies, limiting their ability to bring new products to market.
- Test menu for at home tests are relatively limited compared to traditional laboratory-based tests. Complex or specialized tests may still require a visit to a healthcare facility, limiting the market potential of at-home testing.
Opportunities in the At-home Molecular Testing Market Industry:
- Rising demand for personalized medicine and the increasing focus on personalized medicine presents a significant opportunity for at-home molecular testing.
- Advances in technology, such as improved sample collection methods, more sensitive and accurate molecular assays, and user-friendly testing kits, will enhance the overall user experience, making testing easier and more reliable.
- The significant financial investments made in healthcare and life science research in emerging markets are crucial in modernizing the laboratory infrastructure in developing nations, which promotes the expanding use of molecular diagnostics.
Latest Trends in the At-home Molecular Testing Market:
- At-home testing kits now cover a wide range of health conditions and concerns, including hormone levels, fertility, food sensitivities, STIs, cholesterol levels, vitamin deficiencies, and more. This diversification allows individuals to gain insights into various aspects of their health and well-being.
- The demand for accessible and convenient testing options has surged, leading to the rapid development and availability of at-home testing kits.
- Hormone testing has gained popularity in the at-home testing kits market, particularly among individuals interested in monitoring and optimizing their hormonal balance.
Attributes | Details |
---|---|
At-home Molecular Testing Market Size (2023) | US$ 10.2 billion |
At-home Molecular Testing Market Projected Size (2033) | US$ 18.1 billion |
Value CAGR (2023 to 2033) | 5.9% |
Don't pay for what you don't need
Customize your report by selecting specific countries or regions and save 30%!
2017 to 2022 At-home Molecular Testing Market Demand Outlook Compared to 2023 to 2033 Forecast
From 2017 to 2022, the global at-home molecular testing market experienced a CAGR of 5.4%, reaching a market size of US$ 10.2 billion in 2023.
From 2017 to 2022, the global at-home molecular testing market industry witnessed steady growth due to the increased awareness and acceptance of at-home molecular testing. The at-home molecular testing market was in its infancy, primarily focused on genetic testing for ancestry and genealogy purposes. Companies like 23andMe and AncestryDNA gained popularity, attracting consumers interested in exploring their genetic heritage. The market witnessed increased awareness and acceptance of at-home molecular testing during this period. More consumers recognized the potential benefits of understanding their genetic health risks and gaining personalized insights. The market diversified to include tests for traits, wellness, and lifestyle factors, such as diet and exercise recommendations based on genetic profiles.
Future Forecast for At-home Molecular Testing Market Industry:
Looking ahead, the global at-home molecular testing market industry is expected to rise at a CAGR of 5.9% from 2023 to 2033. During the forecast period, the market size is expected to reach US$ 18.1 billion by 2033.
The at-home molecular testing market industry is expected to continue its growth trajectory from 2023 to 2033. The at-home molecular testing market is expected to witness an expansion of the test menu, offering a wider range of genetic and molecular tests. As scientific knowledge expands, more disease markers, genetic variants, and actionable insights will be identified, leading to the development of new tests. This diversification will attract a larger consumer base and drive market growth.
The growing focus on personalized medicine and preventive healthcare will fuel the demand for at-home molecular testing. Individuals are increasingly interested in understanding their genetic predispositions, optimizing their health choices, and monitoring disease risks. At-home testing provides a convenient and accessible means to achieve these goals.
Comparative View of the At-home Molecular Testing Market
At-home Molecular Testing Market:
Attributes | At-home Molecular Testing Market |
---|---|
CAGR (2023 to 2033) | 5.9% |
Market Value (2033) | US$ 18.1 million |
Opportunity | Rising demand for personalized medicine and the increasing focus on personalized medicine presents a significant opportunity for at-home molecular testing. |
Key Trends | The demand for accessible and convenient testing options has surged, leading to the rapid development and availability of at-home testing kits |
At-home Testing Market:
Attributes | At-home Testing Market |
---|---|
CAGR (2023 to 2033) | 4.0% |
Market Value (2033) | US$ 10.9 billion |
Opportunity | The market is set to present an opportunistic outlook, due to technological developments in sample collection and manufacturers efforts to develop easy to use disposable test kits. |
Key Trends | The expanding research and development of the at-home testing products, increased awareness about health and hygiene, HIV health awareness, immense advertising, and increasing number of infectious diseases, are the key trends of the market. |
At-home vaginal pH Test Kit Market:
Attributes | At-home vaginal pH Test Kit Market |
---|---|
CAGR (2023 to 2033) | 5.4% |
Market Value (2033) | US$ 185.2 million |
Opportunity | Increasing vaginal infections as well as hygiene among the women in the globe. |
Key Trends | The growing practice of self-testing is expected to augment the at-home vaginal pH test kit market. |
Country-Wise Insights
At-home Molecular Testing Market to Surge in the United States Due to Rising Prevalence of Diabetes.
Country | The United States |
---|---|
Market Size (US$ billion) by End of Forecast Period (2033) | US$ 5.6 billion |
CAGR % 2023 to End of Forecast (2033) | 7.2% |
The at-home molecular testing market industry in the United States is expected to reach a market size of US$ 5.6 billion by 2033, expanding at a CAGR of 7.2%. Due to the rising demand for at home diabetic testing kits. In the United States, more than 130 million persons have diabetes or prediabetes, according to the Centers for Disease Control and Prevention 2022. Such growing prevalence of diabetes in the country, the demand for at home molecular testing market is high.
Rising Demand for At-home Molecular Testing Market is Due to the Growing Awareness Regarding Personalized Medicine.
Country | The United Kingdom |
---|---|
Market Size (US$ billion) by End of Forecast Period (2033) | US$ 689.1 million |
CAGR % 2023 to End of Forecast (2033) | 6.8% |
The at-home molecular testing market industry in the United Kingdom is expected to reach a market share of US$ 689.1 million, expanding at a CAGR of 6.8% during the forecast period. The United Kingdom market is projected to growth of the market due to the growing personalized medicine initiatives. The United Kingdom has been at the forefront of personalized medicine initiatives, aiming to provide tailored healthcare based on an individual's genetic profile. At-home molecular testing plays a crucial role in these initiatives, allowing individuals to access genetic information, identify disease risks, and participate in research studies to advance personalized healthcare.
Notable Growth Expected in China's At-home Molecular Testing Market as Prevalence of Chronic Diseases in the Country.
Country | China |
---|---|
Market Size (US$ billion) by End of Forecast Period (2033) | US$ 1.30 billion |
CAGR % 2023 to End of Forecast (2033) | 5.1% |
The at-home molecular testing market industry in China is anticipated to reach a market size of US$ 1.30 billion, moving at a CAGR of 5.1% during the forecast period. The at-home molecular testing market industry in China is expected to grow prominently due to the increasing chronic disease. China is facing a rising burden of chronic diseases, such as cardiovascular diseases, diabetes, and cancer. At-home molecular testing offers a way for individuals to monitor their health, detect diseases early, and take preventive measures. The ability to access testing from the comfort of their homes aligns with the increasing emphasis on preventive healthcare.
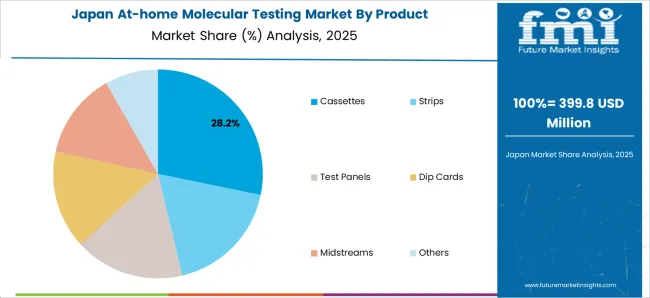
Growing Technological Advancement and E-commerce Development to Drive Market Growth in Japan
Country | Japan |
---|---|
Market Size (US$ billion) by End of Forecast Period (2033) | US$ 1.12 billion |
CAGR % 2023 to End of Forecast (2033) | 5.8% |
The at-home molecular testing market industry in Japan is estimated to reach a market size of US$ 1.12 billion by 2033, thriving at a CAGR of 5.8%. The market in Japan is predicted to grow because of the growing technological advancements. Japan has a well-established e-commerce infrastructure and a high penetration of smartphones. This has facilitated the growth of online platforms and marketplaces for at-home molecular testing kits. The ease of purchasing and accessing these kits online has contributed to the rising demand in the country.
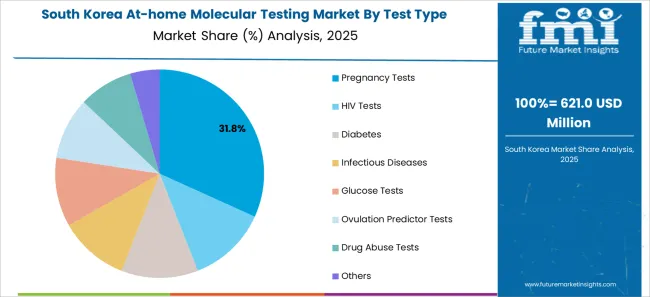
Demand for At-home Molecular Testing Market is Rising Due to Increasing Awareness and Acceptance of the Market.
Country | South Korea |
---|---|
Market Size (US$ billion) by End of Forecast Period (2033) | US$ 253.9 million |
CAGR % 2023 to End of Forecast (2033) | 3.6% |
The at-home molecular testing market industry in South Korea is expected to reach a market size of US$ 253.9 million, expanding at a CAGR of 3.6% during the forecast period. The market in South Korea is forecasted to witness growth due to the increased awareness and acceptance. There has been a growing awareness and acceptance of at-home molecular testing among the general population in the South Korea. Consumers are increasingly interested in understanding their genetic heritage, health risks, and ancestry. This has contributed to the rising demand for at-home genetic testing kits.
Category-Wise Insights
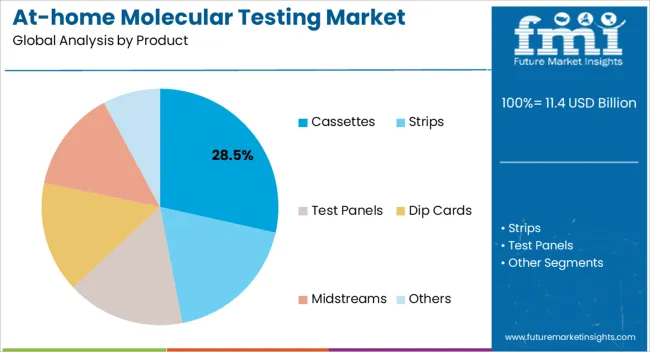
Cassette Test Devices to Dominate At-home Molecular Testing Market Industry with 6.7% CAGR through 2033
The cassettes are expected to dominate the at-home molecular testing market industry with a CAGR of 6.7% from 2023 to 2033. This segment captures a significant market share in 2023 due to its rapid testing procedures, high efficiency, and improved testing kits.
According to the needs of the consumer, diagnostic cassettes for rapid test for diagnostic kits can be used in a single way or many ways (two or four ways). For immediate results, Plastic Cassettes for Rapid Test (Cassettes for Diagnostic Kits) are frequently utilized. For the best outcomes, it also guarantees improved buffer flow with the right pressure points through the strip.
How the Infectious Diseases are Driving At-home Molecular Testing Market?
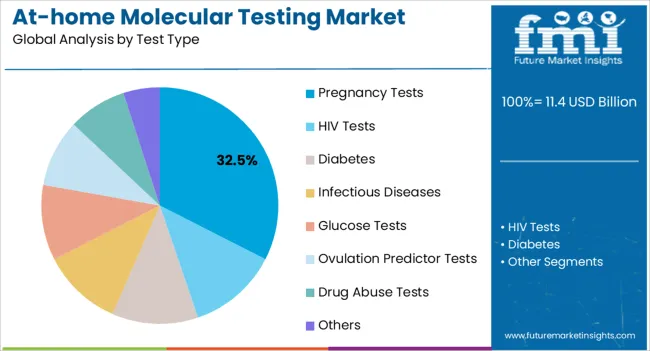
Infectious diseases are expected to dominate the at-home molecular testing market industry with a CAGR of 6.7% from 2023 to 2033. This segment captures a significant market share in 2023 as incidences of infectious diseases in the globe is on the rise.
The prevalence of infectious diseases in developed and developing regions will have a beneficial impact on market growth. The increasing number of prescriptions for at-home infectious illness diagnostic tests is due to the diagnosis and management of such infections.
Which Sample Type is Widely Adopted the At-home Molecular Testing Market?
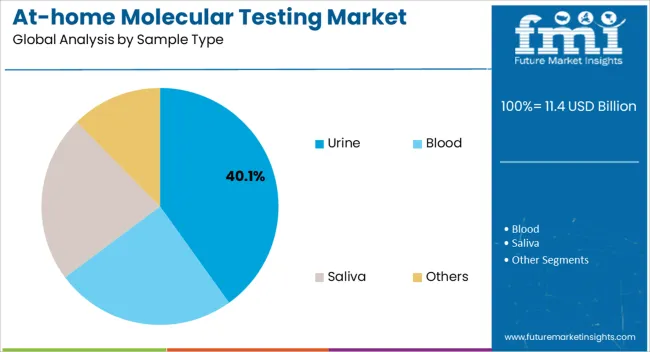
The blood sample segment is expected to dominate the at-home molecular testing market industry with a CAGR of 5.5% from 2023 to 2033 and is expected to hold market share of 42.4% in 2023. Blood testing are extremely common. They aid clinicians in the detection of certain diseases and ailments. They also aid in the evaluation of organ function and the effectiveness of treatments. One of the most popular blood tests is the complete blood count (CBC). It is frequently performed as part of a standard checkup. This test evaluates a variety of blood components, including red blood cells, white blood cells, and platelets.
Which Distribution Channel Is Widely Adopted In the Market?
The drug store in dominating the at home molecular testing market with the CAGR of 6.2%. The ease of availability of the testing kits without prescription in the drug store the adoption is high.
Get the data you need at a Fraction of the cost
Personalize your report by choosing insights you need
and save 40%!
How Key Players Stay Competitive in the At-home Molecular Testing Market Industry?
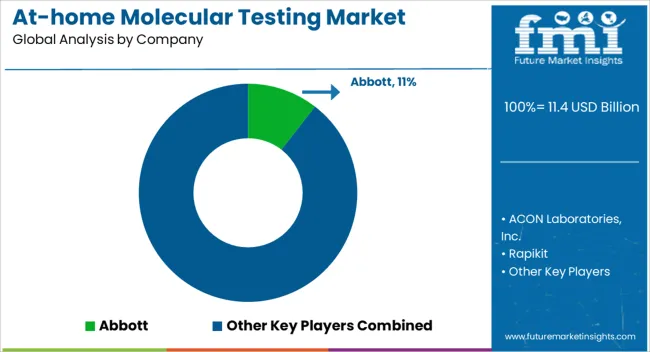
The at-home molecular testing sector is fiercely competitive, with many companies fighting for market dominance. To stay ahead of the competition in such a circumstance, essential players must employ smart techniques.
Key Strategies Used by the Participants
- Product Development
To produce innovative goods that increase efficacy, dependability, and cost-effectiveness, businesses make significant investments in research and development. Product innovation enables companies to stand out from the competition while also meeting the shifting needs of their customers.
- Strategic Alliances & Collaborations
Strategic alliances and partnerships with other businesses are regularly formed by major players in an industry to take advantage of each other's advantages and expand their market reach. Through such arrangements, businesses may also obtain access to new technologies and markets.
- Expansion into Emerging Markets
The market for at-home molecular testing is rising quickly in developing nations like China and India. To boost their presence in these regions, major companies are expanding their distribution networks and building regional manufacturing sites.
- Acquisitions and mergers
Key companies in the at-home molecular testing market routinely employ mergers and acquisitions to strengthen their market positions, broaden their product offerings, and enter new markets.
Key Players in the At-home Molecular Testing Market Industry
- Abbott
- ACON Laboratories, Inc.
- Rapikit
- Becton and Dickinson
- Cardinal Health
- B. Braun Melsungen AG
- Piramal Enterprises Ltd.
- Siemens Healthcare GmbH
- Quidel Corporation
- Bionime Corporation
- SA Scientific
- ARKRAY USA, Inc.
- Nova Biomedical
- AdvaCare Pharma
- AccuBioTech Co., Ltd.
- Atlas Medical UK
- TaiDoc Technology Corporation
- Drägerwerk AG & Co. KGaA
- F. Hoffmann-La Roche Ltd
- Sensing Self
- PTE. Ltd
- Atomo Diagnostics
- Mankind Pharma
Key Developments in the At-home Molecular Testing Market:
- On 23rd April 2022, Prega News, a pregnancy test kit brand owned by Mankind Pharma, has introduced a brand-new and sophisticated pregnancy detection test kit for the Indian market.
- 10th June, 2022, Mylab Discovery Solutions, a biotech startup, has entered the women's healthcare market with the release of the PregaScreen home pregnancy test kit.
Segmentation Analysis of the At-home Molecular Testing Market
By Product:
- Cassettes
- Strips
- Test Panels
- Dip Cards
- Midstreams
- Others
By Test Type:
- Pregnancy Tests
- HIV Tests
- Diabetes
- Infectious Diseases
- Glucose Tests
- Ovulation Predictor Tests
- Drug Abuse Tests
- Others
By Sample Type:
- Urine
- Blood
- Saliva
- Others
By Distribution Channel:
- Retail Pharmacies
- Drug Stores
- Supermarkets/Hypermarkets
- Online Pharmacies
By Region:
- North America
- Latin America
- Europe
- East Asia
- South Asia
- Oceania
- The Middle East & Africa
Frequently Asked Questions
What is the At-home Molecular Testing market CAGR for 2033?
The at-home molecular testing market CAGR for 2033 is 5.9%.
Which is the Leading Region in the At-home Molecular Testing market?
The North America region is the leading region in the market.
What is the projected market value of the global At-home Molecular Testing market for 2033?
The projected market value of the market for 2033 is US$ 10.2 billion.
How Key Players are Developing the At-home Molecular Testing Market?
Key players are developing the market by developing innovative tests.
Which are the Major Countries in the At-home Molecular Testing Market?
China, India, the United States, Japan, and Germany are the major countries in this market.
Table of Content
1. Executive Summary 1.1. Global Market Outlook 1.2. Demand Side Trends 1.3. Supply Side Trends 1.4. Analysis and Recommendations 2. Market Overview 2.1. Market Coverage / Taxonomy 2.2. Market Definition / Scope / Limitations 2.3. Inclusions and Exclusions 3. Key Market Trends 3.1. Key Trends Impacting the Market 3.2. Product Innovation / Development Trends 4. Value Added Insights 4.1. Product Adoption / Usage Analysis 4.2. Product Features/ USPs 4.3. Technological Roadmap 4.4. Recent Product Approvals/Launces 4.5. Reimbursement Scenario 4.6. Regulatory Landscape 4.7. PESTEL Analysis 4.8. Porter’s Analysis 5. Market Background 5.1. Macro-Economic Factors 5.1.1. Global GDP Growth Outlook 5.1.2. Global Healthcare Expenditure Outlook 5.1.3. Global Life Expectancy Outlook 5.2. Forecast Factors - Relevance & Impact 5.2.1. Key Player’s Historic Growth 5.2.2. Increasing Cases of Infectious Diseases 5.2.3. Favourable Government Regulations 5.2.4. Rising Demand for At Home Kits 5.2.5. Technological Advancement in the Devices 5.2.6. Increasing Prevalence of Diabetes 5.2.7. Growing Product Demand For Genetic Predispositions 5.2.8. Increasing Product Approvals/Launches 5.3. Dynamics 5.3.1. Drivers 5.3.2. Restraints 5.3.3. Opportunity Analysis 6. Global Market Volume (in Units) Analysis 2017 to 2022 and Forecast, 2023 to 2033 6.1. Historical Volume (in Units) Analysis, 2017 to 2022 6.2. Current and Future Volume (in Units) Projections, 2023 to 2033 6.2.1. Y-o-Y Growth Trend Analysis 7. Global Market - Pricing Analysis 7.1. Regional Pricing Analysis By Product 7.2. Pricing Break-up 7.2.1. Manufacturer Level Pricing 7.2.2. Distributor Level Pricing 7.3. Global Average Pricing Analysis Benchmark 7.4. Pricing Assumptions 8. Global Market Demand (in Value or Size in US$ Mn) Analysis 2017 to 2022 and Forecast, 2023 to 2033 8.1. Historical Market Value (US$ Million) Analysis, 2017 to 2022 8.2. Current and Future Market Value (US$ Million) Projections, 2023 to 2033 8.2.1. Y-o-Y Growth Trend Analysis 8.2.2. Absolute $ Opportunity Analysis 9. Global Market Analysis 2017 to 2022 and Forecast 2023 to 2033, By Product 9.1. Introduction / Key Findings 9.2. Historical Market Size (US$ Million) and Volume (Units) Analysis By Product, 2017 to 2022 9.3. Current and Future Market Size (US$ Million) and Volume (Units) Analysis and Forecast By Product, 2023 to 2033 9.3.1. Cassettes 9.3.2. Strips 9.3.3. Test Panels 9.3.4. Dip Cards 9.3.5. Midstreams 9.3.6. Others 9.4. Market Attractiveness Analysis By Product 10. Global Market Analysis 2017 to 2022 and Forecast 2023 to 2033, By Test Type 10.1. Introduction / Key Findings 10.2. Historical Market Size (US$ Million) Analysis By Test Type, 2017 to 2022 10.3. Current and Future Market Size (US$ Million) Analysis and Forecast By Test Type, 2023 to 2033 10.3.1. Pregnancy Tests 10.3.2. HIV Tests 10.3.3. Diabetes 10.3.4. Infectious Diseases 10.3.5. Glucose Tests 10.3.6. Ovulation Predictor Tests 10.3.7. Drug Abuse Tests 10.3.8. Others 10.4. Market Attractiveness Analysis By Test Type 11. Global Market Analysis 2017 to 2022 and Forecast 2023 to 2033, By Sample Type 11.1. Introduction / Key Findings 11.2. Historical Market Size (US$ Million) Analysis By Sample Type, 2017 to 2022 11.3. Current and Future Market Size (US$ Million) Analysis and Forecast By Sample Type, 2023 to 2033 11.3.1. Urine 11.3.2. Blood 11.3.3. Saliva 11.3.4. Others 11.4. Market Attractiveness Analysis By Sample Type 12. Global Market Analysis 2017 to 2022 and Forecast 2023 to 2033, By Distribution Channel 12.1. Introduction / Key Findings 12.2. Historical Market Size (US$ Million) Analysis By Distribution Channel, 2017 to 2022 12.3. Current and Future Market Size (US$ Million) Analysis and Forecast By Distribution Channel, 2023 to 2033 12.3.1. Retail Pharmacies 12.3.2. Drug Stores 12.3.3. Supermarkets/Hypermarkets 12.3.4. Online Pharmacies 12.4. Market Attractiveness Analysis By Distribution Channel 13. Global Market Analysis 2017 to 2022 and Forecast 2023 to 2033, by Region 13.1. Introduction 13.2. Historical Market Size (US$ Million) Analysis By Region, 2017 to 2022 13.3. Current and Future Market Size (US$ Million) Analysis and Forecast By Region, 2023 to 2033 13.3.1. North America 13.3.2. Latin America 13.3.3. Europe 13.3.4. South Asia 13.3.5. East Asia 13.3.6. Oceania 13.3.7. Middle East and Africa (MEA) 13.4. Market Attractiveness Analysis By Region 14. North America Market Analysis 2017 to 2022 and Forecast 2023 to 2033 14.1. Introduction 14.2. Historical Market Size (US$ Million) and Volume (Units) Analysis By Market Taxonomy, 2017 to 2022 14.3. Current and Future Market Size (US$ Million) and Volume (Units) Analysis and Forecast By Market Taxonomy, 2023 to 2033 14.3.1. By Country 14.3.1.1. USA 14.3.1.2. Canada 14.3.2. By Product 14.3.3. By Test Type 14.3.4. By Sample Type 14.3.5. By Distribution Channel 14.4. Market Attractiveness Analysis 14.4.1. By Country 14.4.2. By Product 14.4.3. By Test Type 14.4.4. By Sample Type 14.4.5. By Distribution Channel 14.5. Country Level Analysis & Forecast 14.5.1. USA Market Analysis 14.5.1.1. Introduction 14.5.1.2. Market Analysis and Forecast by Market Taxonomy 14.5.1.2.1. By Product 14.5.1.2.2. By Test Type 14.5.1.2.3. By Sample Type 14.5.1.2.4. By Distribution Channel 14.5.2. Canada Market Analysis 14.5.2.1. Introduction 14.5.2.2. Market Analysis and Forecast by Market Taxonomy 14.5.2.2.1. By Product 14.5.2.2.2. By Test Type 14.5.2.2.3. By Sample Type 14.5.2.2.4. By Distribution Channel 14.6. Market Trends 14.7. Key Market Participants - Intensity Mapping 14.8. Drivers and Restraints - Impact Analysis 15. Latin America Market Analysis 2017 to 2022 and Forecast 2023 to 2033 15.1. Introduction 15.2. Historical Market Size (US$ Million) and Volume (Units) Analysis By Market Taxonomy, 2017 to 2022 15.3. Current and Future Market Size (US$ Million) and Volume (Units) Analysis and Forecast By Market Taxonomy, 2023 to 2033 15.3.1. By Country 15.3.1.1. Brazil 15.3.1.2. Mexico 15.3.1.3. Argentina 15.3.1.4. Rest of Latin America 15.3.2. By Product 15.3.3. By Test Type 15.3.4. By Sample Type 15.3.5. By Distribution Channel 15.4. Market Attractiveness Analysis 15.4.1. By Country 15.4.2. By Product 15.4.3. By Test Type 15.4.4. By Sample Type 15.4.5. By Distribution Channel 15.5. Country Level Analysis & Forecast 15.5.1. Brazil Market Analysis 15.5.1.1. Introduction 15.5.1.2. Market Analysis and Forecast by Market Taxonomy 15.5.1.2.1. By Product 15.5.1.2.2. By Test Type 15.5.1.2.3. By Sample Type 15.5.1.2.4. By Distribution Channel 15.5.2. Mexico Market Analysis 15.5.2.1. Introduction 15.5.2.2. Market Analysis and Forecast by Market Taxonomy 15.5.2.2.1. By Product 15.5.2.2.2. By Test Type 15.5.2.2.3. By Sample Type 15.5.2.2.4. By Distribution Channel 15.5.3. Argentina Market Analysis 15.5.3.1. Introduction 15.5.3.2. Market Analysis and Forecast by Market Taxonomy 15.5.3.2.1. By Product 15.5.3.2.2. By Test Type 15.5.3.2.3. By Sample Type 15.5.3.2.4. By Distribution Channel 15.6. Market Trends 15.7. Key Market Participants - Intensity Mapping 15.8. Drivers and Restraints - Impact Analysis 16. Europe Market Analysis 2017 to 2022 and Forecast 2023 to 2033 16.1. Introduction 16.2. Historical Market Size (US$ Million) and Volume (Units) Analysis By Market Taxonomy, 2017 to 2022 16.3. Current and Future Market Size (US$ Million) and Volume (Units) Analysis and Forecast By Market Taxonomy, 2023 to 2033 16.3.1. By Country 16.3.1.1. Germany 16.3.1.2. France 16.3.1.3. Italy 16.3.1.4. UK 16.3.1.5. Spain 16.3.1.6. Russia 16.3.1.7. BENELUX 16.3.1.8. Rest of Europe 16.3.2. By Product 16.3.3. By Test Type 16.3.4. By Sample Type 16.3.5. By Distribution Channel 16.4. Market Attractiveness Analysis 16.4.1. By Country 16.4.2. By Product 16.4.3. By Test Type 16.4.4. By Sample Type 16.4.5. By Distribution Channel 16.5. Country Level Analysis & Forecast 16.5.1. Germany Market Analysis 16.5.1.1. Introduction 16.5.1.2. Market Analysis and Forecast by Market Taxonomy 16.5.1.2.1. By Product 16.5.1.2.2. By Test Type 16.5.1.2.3. By Sample Type 16.5.1.2.4. By Distribution Channel 16.5.2. France Market Analysis 16.5.2.1. Introduction 16.5.2.2. Market Analysis and Forecast by Market Taxonomy 16.5.2.2.1. By Product 16.5.2.2.2. By Test Type 16.5.2.2.3. By Sample Type 16.5.2.2.4. By Distribution Channel 16.5.3. Italy Market Analysis 16.5.3.1. Introduction 16.5.3.2. Market Analysis and Forecast by Market Taxonomy 16.5.3.2.1. By Product 16.5.3.2.2. By Test Type 16.5.3.2.3. By Sample Type 16.5.3.2.4. By Distribution Channel 16.5.4. UK Market Analysis 16.5.4.1. Introduction 16.5.4.2. Market Analysis and Forecast by Market Taxonomy 16.5.4.2.1. By Product 16.5.4.2.2. By Test Type 16.5.4.2.3. By Sample Type 16.5.4.2.4. By Distribution Channel 16.5.5. Spain Market Analysis 16.5.5.1. Introduction 16.5.5.2. Market Analysis and Forecast by Market Taxonomy 16.5.5.2.1. By Product 16.5.5.2.2. By Test Type 16.5.5.2.3. By Sample Type 16.5.5.2.4. By Distribution Channel 16.5.6. Russia Market Analysis 16.5.6.1. Introduction 16.5.6.2. Market Analysis and Forecast by Market Taxonomy 16.5.6.2.1. By Product 16.5.6.2.2. By Test Type 16.5.6.2.3. By Sample Type 16.5.6.2.4. By Distribution Channel 16.5.7. BENELUX Market Analysis 16.5.7.1. Introduction 16.5.7.2. Market Analysis and Forecast by Market Taxonomy 16.5.7.2.1. By Product 16.5.7.2.2. By Test Type 16.5.7.2.3. By Sample Type 16.5.7.2.4. By Distribution Channel 16.6. Market Trends 16.7. Key Market Participants - Intensity Mapping 16.8. Drivers and Restraints - Impact Analysis 17. South Asia Market Analysis 2017 to 2022 and Forecast 2023 to 2033 17.1. Introduction 17.2. Historical Market Size (US$ Million) and Volume (Units) Analysis By Market Taxonomy, 2017 to 2022 17.3. Current and Future Market Size (US$ Million) and Volume (Units) Analysis and Forecast By Market Taxonomy, 2023 to 2033 17.3.1. By Country 17.3.1.1. India 17.3.1.2. Thailand 17.3.1.3. Indonesia 17.3.1.4. Malaysia 17.3.1.5. Rest of South Asia 17.3.2. By Product 17.3.3. By Test Type 17.3.4. By Sample Type 17.3.5. By Distribution Channel 17.4. Market Attractiveness Analysis 17.4.1. By Country 17.4.2. By Product 17.4.3. By Test Type 17.4.4. By Sample Type 17.4.5. By Distribution Channel 17.5. Country Level Analysis & Forecast 17.5.1. India Market Analysis 17.5.1.1. Introduction 17.5.1.2. Market Analysis and Forecast by Market Taxonomy 17.5.1.2.1. By Product 17.5.1.2.2. By Test Type 17.5.1.2.3. By Sample Type 17.5.1.2.4. By Distribution Channel 17.5.2. Thailand Market Analysis 17.5.2.1. Introduction 17.5.2.2. Market Analysis and Forecast by Market Taxonomy 17.5.2.2.1. By Product 17.5.2.2.2. By Test Type 17.5.2.2.3. By Sample Type 17.5.2.2.4. By Distribution Channel 17.5.3. Indonesia Market Analysis 17.5.3.1. Introduction 17.5.3.2. Market Analysis and Forecast by Market Taxonomy 17.5.3.2.1. By Product 17.5.3.2.2. By Test Type 17.5.3.2.3. By Sample Type 17.5.3.2.4. By Distribution Channel 17.5.4. Malaysia Market Analysis 17.5.4.1. Introduction 17.5.4.2. Market Analysis and Forecast by Market Taxonomy 17.5.4.2.1. By Product 17.5.4.2.2. By Test Type 17.5.4.2.3. By Sample Type 17.5.4.2.4. By Distribution Channel 17.6. Market Trends 17.7. Key Market Participants - Intensity Mapping 17.8. Drivers and Restraints - Impact Analysis 18. East Asia Market Analysis 2017 to 2022 and Forecast 2023 to 2033 18.1. Introduction 18.2. Historical Market Size (US$ Million) and Volume (Units) Analysis By Market Taxonomy, 2017 to 2022 18.3. Current and Future Market Size (US$ Million) and Volume (Units) Analysis and Forecast By Market Taxonomy, 2023 to 2033 18.3.1. By Country 18.3.1.1. China 18.3.1.2. Japan 18.3.1.3. South Korea 18.3.2. By Product 18.3.3. By Test Type 18.3.4. By Sample Type 18.3.5. By Distribution Channel 18.4. Market Attractiveness Analysis 18.4.1. By Country 18.4.2. By Product 18.4.3. By Test Type 18.4.4. By Sample Type 18.4.5. By Distribution Channel 18.5. Country Level Analysis & Forecast 18.5.1. China Market Analysis 18.5.1.1. Introduction 18.5.1.2. Market Analysis and Forecast by Market Taxonomy 18.5.1.2.1. By Product 18.5.1.2.2. By Test Type 18.5.1.2.3. By Sample Type 18.5.1.2.4. By Distribution Channel 18.5.2. Japan Market Analysis 18.5.2.1. Introduction 18.5.2.2. Market Analysis and Forecast by Market Taxonomy 18.5.2.2.1. By Product 18.5.2.2.2. By Test Type 18.5.2.2.3. By Sample Type 18.5.2.2.4. By Distribution Channel 18.5.3. South Korea Market Analysis 18.5.3.1. Introduction 18.5.3.2. Market Analysis and Forecast by Market Taxonomy 18.5.3.2.1. By Product 18.5.3.2.2. By Test Type 18.5.3.2.3. By Sample Type 18.5.3.2.4. By Distribution Channel 18.6. Market Trends 18.7. Key Market Participants - Intensity Mapping 18.8. Drivers and Restraints - Impact Analysis 19. Oceania Market Analysis 2017 to 2022 and Forecast 2023 to 2033 19.1. Introduction 19.2. Historical Market Size (US$ Million) and Volume (Units) Analysis By Market Taxonomy, 2017 to 2022 19.3. Current and Future Market Size (US$ Million) and Volume (Units) Analysis and Forecast By Market Taxonomy, 2023 to 2033 19.3.1. By Country 19.3.1.1. Australia 19.3.1.2. New Zealand 19.3.2. By Product 19.3.3. By Test Type 19.3.4. By Sample Type 19.3.5. By Distribution Channel 19.4. Market Attractiveness Analysis 19.4.1. By Country 19.4.2. By Product 19.4.3. By Test Type 19.4.4. By Sample Type 19.4.5. By Distribution Channel 19.5. Country Level Analysis & Forecast 19.5.1. Australia Market Analysis 19.5.1.1. Introduction 19.5.1.2. Market Analysis and Forecast by Market Taxonomy 19.5.1.2.1. By Product 19.5.1.2.2. By Test Type 19.5.1.2.3. By Sample Type 19.5.1.2.4. By Distribution Channel 19.5.2. New Zealand Market Analysis 19.5.2.1. Introduction 19.5.2.2. Market Analysis and Forecast by Market Taxonomy 19.5.2.2.1. By Product 19.5.2.2.2. By Test Type 19.5.2.2.3. By Sample Type 19.5.2.2.4. By Distribution Channel 19.6. Market Trends 19.7. Key Market Participants - Intensity Mapping 19.8. Drivers and Restraints - Impact Analysis 20. Middle East and Africa Market Analysis 2017 to 2022 and Forecast 2023 to 2033 20.1. Introduction 20.2. Historical Market Size (US$ Million) and Volume (Units) Analysis By Market Taxonomy, 2017 to 2022 20.3. Current and Future Market Size (US$ Million) and Volume (Units) Analysis and Forecast By Market Taxonomy, 2023 to 2033 20.3.1. By Country 20.3.1.1. GCC Countries 20.3.1.2. Türkiye 20.3.1.3. Northern Africa 20.3.1.4. South Africa 20.3.1.5. Rest of Middle East and Africa 20.3.2. By Product 20.3.3. By Test Type 20.3.4. By Sample Type 20.3.5. By Distribution Channel 20.4. Market Attractiveness Analysis 20.4.1. By Country 20.4.2. By Product 20.4.3. By Test Type 20.4.4. By Sample Type 20.4.5. By Distribution Channel 20.5. Country Level Analysis & Forecast 20.5.1. GCC Countries Market Analysis 20.5.1.1. Introduction 20.5.1.2. Market Analysis and Forecast by Market Taxonomy 20.5.1.2.1. By Product 20.5.1.2.2. By Test Type 20.5.1.2.3. By Sample Type 20.5.1.2.4. By Distribution Channel 20.5.2. Türkiye Market Analysis 20.5.2.1. Introduction 20.5.2.2. Market Analysis and Forecast by Market Taxonomy 20.5.2.2.1. By Product 20.5.2.2.2. By Test Type 20.5.2.2.3. By Sample Type 20.5.2.2.4. By Distribution Channel 20.5.3. Northern Africa Market Analysis 20.5.3.1. Introduction 20.5.3.2. Market Analysis and Forecast by Market Taxonomy 20.5.3.2.1. By Product 20.5.3.2.2. By Test Type 20.5.3.2.3. By Sample Type 20.5.3.2.4. By Distribution Channel 20.5.4. South Africa Market Analysis 20.5.4.1. Introduction 20.5.4.2. Market Analysis and Forecast by Market Taxonomy 20.5.4.2.1. By Product 20.5.4.2.2. By Test Type 20.5.4.2.3. By Sample Type 20.5.4.2.4. By Distribution Channel 20.6. Market Trends 20.7. Key Market Participants - Intensity Mapping 20.8. Drivers and Restraints - Impact Analysis 21. Market Structure Analysis 21.1. Market Analysis by Tier of Companies 21.2. Market Share Analysis of Top Players 21.3. Market Presence Analysis 22. Competition Analysis 22.1. Competition Dashboard 22.2. Branding and Promotional Strategies, By Key Players 22.3. Key Development Analysis 22.4. Competition Deep Dive 22.4.1. Abbott 22.4.1.1. Overview 22.4.1.2. Product Portfolio 22.4.1.3. Key Financials 22.4.1.4. Sales Footprint 22.4.1.5. SWOT Analysis 22.4.1.6. Strategy Overview 22.4.1.6.1. Marketing Strategy 22.4.1.6.2. Product Strategy 22.4.1.6.3. Channel Strategy 22.4.2. Rapikit 22.4.2.1. Overview 22.4.2.2. Product Portfolio 22.4.2.3. Key Financials 22.4.2.4. Sales Footprint 22.4.2.5. SWOT Analysis 22.4.2.6. Strategy Overview 22.4.2.6.1. Marketing Strategy 22.4.2.6.2. Product Strategy 22.4.2.6.3. Channel Strategy 22.4.3. Becton and Dickinson 22.4.3.1. Overview 22.4.3.2. Product Portfolio 22.4.3.3. Key Financials 22.4.3.4. Sales Footprint 22.4.3.5. SWOT Analysis 22.4.3.6. Strategy Overview 22.4.3.6.1. Marketing Strategy 22.4.3.6.2. Product Strategy 22.4.3.6.3. Channel Strategy 22.4.4. Cardinal Health 22.4.4.1. Overview 22.4.4.2. Product Portfolio 22.4.4.3. Key Financials 22.4.4.4. Sales Footprint 22.4.4.5. SWOT Analysis 22.4.4.6. Strategy Overview 22.4.4.6.1. Marketing Strategy 22.4.4.6.2. Product Strategy 22.4.4.6.3. Channel Strategy 22.4.5. B. Braun Melsungen AG 22.4.5.1. Overview 22.4.5.2. Product Portfolio 22.4.5.3. Key Financials 22.4.5.4. Sales Footprint 22.4.5.5. SWOT Analysis 22.4.5.6. Strategy Overview 22.4.5.6.1. Marketing Strategy 22.4.5.6.2. Product Strategy 22.4.5.6.3. Channel Strategy 22.4.6. Piramal Enterprises Ltd. 22.4.6.1. Overview 22.4.6.2. Product Portfolio 22.4.6.3. Key Financials 22.4.6.4. Sales Footprint 22.4.6.5. SWOT Analysis 22.4.6.6. Strategy Overview 22.4.6.6.1. Marketing Strategy 22.4.6.6.2. Product Strategy 22.4.6.6.3. Channel Strategy 22.4.7. Siemens Healthcare GmbH 22.4.7.1. Overview 22.4.7.2. Product Portfolio 22.4.7.3. Key Financials 22.4.7.4. Sales Footprint 22.4.7.5. SWOT Analysis 22.4.7.6. Strategy Overview 22.4.7.6.1. Marketing Strategy 22.4.7.6.2. Product Strategy 22.4.7.6.3. Channel Strategy 22.4.8. Quidel Corporation 22.4.8.1. Overview 22.4.8.2. Product Portfolio 22.4.8.3. Key Financials 22.4.8.4. Sales Footprint 22.4.8.5. SWOT Analysis 22.4.8.6. Strategy Overview 22.4.8.6.1. Marketing Strategy 22.4.8.6.2. Product Strategy 22.4.8.6.3. Channel Strategy 22.4.9. Bionime Corporation 22.4.9.1. Overview 22.4.9.2. Product Portfolio 22.4.9.3. Key Financials 22.4.9.4. Sales Footprint 22.4.9.5. SWOT Analysis 22.4.9.6. Strategy Overview 22.4.9.6.1. Marketing Strategy 22.4.9.6.2. Product Strategy 22.4.9.6.3. Channel Strategy 22.4.10. SA Scientific 22.4.10.1. Overview 22.4.10.2. Product Portfolio 22.4.10.3. Key Financials 22.4.10.4. Sales Footprint 22.4.10.5. SWOT Analysis 22.4.10.6. Strategy Overview 22.4.10.6.1. Marketing Strategy 22.4.10.6.2. Product Strategy 22.4.10.6.3. Channel Strategy 22.4.11. ARKRAY USA, Inc. 22.4.11.1. Overview 22.4.11.2. Product Portfolio 22.4.11.3. Key Financials 22.4.11.4. Sales Footprint 22.4.11.5. SWOT Analysis 22.4.11.6. Strategy Overview 22.4.11.6.1. Marketing Strategy 22.4.11.6.2. Product Strategy 22.4.11.6.3. Channel Strategy 22.4.12. Nova Biomedical 22.4.12.1. Overview 22.4.12.2. Product Portfolio 22.4.12.3. Key Financials 22.4.12.4. Sales Footprint 22.4.12.5. SWOT Analysis 22.4.12.6. Strategy Overview 22.4.12.6.1. Marketing Strategy 22.4.12.6.2. Product Strategy 22.4.12.6.3. Channel Strategy 22.4.13. AdvaCare Pharma 22.4.13.1. Overview 22.4.13.2. Product Portfolio 22.4.13.3. Key Financials 22.4.13.4. Sales Footprint 22.4.13.5. SWOT Analysis 22.4.13.6. Strategy Overview 22.4.13.6.1. Marketing Strategy 22.4.13.6.2. Product Strategy 22.4.13.6.3. Channel Strategy 22.4.14. AccuBioTech Co., Ltd. 22.4.14.1. Overview 22.4.14.2. Product Portfolio 22.4.14.3. Key Financials 22.4.14.4. Sales Footprint 22.4.14.5. SWOT Analysis 22.4.14.6. Strategy Overview 22.4.14.6.1. Marketing Strategy 22.4.14.6.2. Product Strategy 22.4.14.6.3. Channel Strategy 22.4.15. Atlas Medical UK 22.4.15.1. Overview 22.4.15.2. Product Portfolio 22.4.15.3. Key Financials 22.4.15.4. Sales Footprint 22.4.15.5. SWOT Analysis 22.4.15.6. Strategy Overview 22.4.15.6.1. Marketing Strategy 22.4.15.6.2. Product Strategy 22.4.15.6.3. Channel Strategy 22.4.16. TaiDoc Technology Corporation 22.4.16.1. Overview 22.4.16.2. Product Portfolio 22.4.16.3. Key Financials 22.4.16.4. Sales Footprint 22.4.16.5. SWOT Analysis 22.4.16.6. Strategy Overview 22.4.16.6.1. Marketing Strategy 22.4.16.6.2. Product Strategy 22.4.16.6.3. Channel Strategy 22.4.17. Drägerwerk AG & Co. KGaA 22.4.17.1. Overview 22.4.17.2. Product Portfolio 22.4.17.3. Key Financials 22.4.17.4. Sales Footprint 22.4.17.5. SWOT Analysis 22.4.17.6. Strategy Overview 22.4.17.6.1. Marketing Strategy 22.4.17.6.2. Product Strategy 22.4.17.6.3. Channel Strategy 22.4.18. F. Hoffmann-La Roche Ltd 22.4.18.1. Overview 22.4.18.2. Product Portfolio 22.4.18.3. Key Financials 22.4.18.4. Sales Footprint 22.4.18.5. SWOT Analysis 22.4.18.6. Strategy Overview 22.4.18.6.1. Marketing Strategy 22.4.18.6.2. Product Strategy 22.4.18.6.3. Channel Strategy 22.4.19. Sensing Self 22.4.19.1. Overview 22.4.19.2. Product Portfolio 22.4.19.3. Key Financials 22.4.19.4. Sales Footprint 22.4.19.5. SWOT Analysis 22.4.19.6. Strategy Overview 22.4.19.6.1. Marketing Strategy 22.4.19.6.2. Product Strategy 22.4.19.6.3. Channel Strategy 22.4.20. PTE. Ltd 22.4.20.1. Overview 22.4.20.2. Product Portfolio 22.4.20.3. Key Financials 22.4.20.4. Sales Footprint 22.4.20.5. SWOT Analysis 22.4.20.6. Strategy Overview 22.4.20.6.1. Marketing Strategy 22.4.20.6.2. Product Strategy 22.4.20.6.3. Channel Strategy 22.4.21. Atomo Diagnostics 22.4.21.1. Overview 22.4.21.2. Product Portfolio 22.4.21.3. Key Financials 22.4.21.4. Sales Footprint 22.4.21.5. SWOT Analysis 22.4.21.6. Strategy Overview 22.4.21.6.1. Marketing Strategy 22.4.21.6.2. Product Strategy 22.4.21.6.3. Channel Strategy 22.4.22. Mankind Pharma 22.4.22.1. Overview 22.4.22.2. Product Portfolio 22.4.22.3. Key Financials 22.4.22.4. Sales Footprint 22.4.22.5. SWOT Analysis 22.4.22.6. Strategy Overview 22.4.22.6.1. Marketing Strategy 22.4.22.6.2. Product Strategy 22.4.22.6.3. Channel Strategy 23. Assumptions and Acronyms Used 24. Research Methodology
Don't pay for what you don't need
Customize your report by selecting specific countries or regions and save 30%!
List of Tables
Table 01: Global Market Value (US$ Million) Analysis and Forecast 2017 to 2033, by Region Table 02A: Global Market Value (US$ Million) Analysis and Forecast 2017 to 2033, by Product Table 02B: Global Market Volume (Units) Analysis and Forecast 2017 to 2033, by Product Table 03: Global Market Value (US$ Million) Analysis and Forecast 2017 to 2033, by Test Type Table 04: Global Market Value (US$ Million) Analysis and Forecast 2017 to 2033, by Sample Type Table 05: Global Market Value (US$ Million) Analysis and Forecast 2017 to 2033, by Distribution Channel Table 06: North America Market Value (US$ Million) Analysis 2017-2022 and Forecast 2023 to 2033, by Country Table 07: North America Market Value (US$ Million) Analysis and Forecast 2017 to 2033, by Product Table 08: North America Market Volume (Units) Analysis and Forecast 2017 to 2033, by Product Table 09: North America Market Value (US$ Million) Analysis and Forecast 2017 to 2033, by Test Type Table 10: North America Market Value (US$ Million) Analysis and Forecast 2017 to 2033, by Sample Type Table 11: North America Market Value (US$ Million) Analysis and Forecast 2017 to 2033, by Distribution Channel Table 12: Latin America Market Value (US$ Million) Analysis 2017-2022 and Forecast 2023 to 2033, by Country Table 13: Latin America Market Value (US$ Million) Analysis and Forecast 2017 to 2033, by Product Table 14: Latin America Market Volume (Units) Analysis and Forecast 2017 to 2033, by Product Table 15: Latin America Market Value (US$ Million) Analysis and Forecast 2017 to 2033, by Test Type Table 16: Latin America Market Value (US$ Million) Analysis and Forecast 2017 to 2033, by Sample Type Table 17: Latin America Market Value (US$ Million) Analysis and Forecast 2017 to 2033, by Distribution Channel Table 18: Europe Market Value (US$ Million) Analysis 2017-2022 and Forecast 2023 to 2033, by Country Table 19: Europe Market Value (US$ Million) Analysis and Forecast 2017 to 2033, by Product Table 20: Europe Market Volume (Units) Analysis and Forecast 2017 to 2033, by Product Table 21: Europe Market Value (US$ Million) Analysis and Forecast 2017 to 2033, by Test Type Table 22: Europe Market Value (US$ Million) Analysis and Forecast 2017 to 2033, by Sample Type Table 23: Europe Market Value (US$ Million) Analysis and Forecast 2017 to 2033, by Distribution Channel Table 24: South Asia Market Value (US$ Million) Analysis 2017-2022 and Forecast 2023 to 2033, by Country Table 25: South Asia Market Value (US$ Million) Analysis and Forecast 2017 to 2033, by Product Table 26: South Asia Market Volume (Units) Analysis and Forecast 2017 to 2033, by Product Table 27: South Asia Market Value (US$ Million) Analysis and Forecast 2017 to 2033, by Test Type Table 28: South Asia Market Value (US$ Million) Analysis and Forecast 2017 to 2033, by Sample Type Table 29: South Asia Market Value (US$ Million) Analysis and Forecast 2017 to 2033, by Distribution Channel Table 30: East Asia Market Value (US$ Million) Analysis 2017-2022 and Forecast 2023 to 2033, by Country Table 31: East Asia Market Value (US$ Million) Analysis and Forecast 2017 to 2033, by Product Table 32: East Asia Market Volume (Units) Analysis and Forecast 2017 to 2033, by Product Table 33: East Asia Market Value (US$ Million) Analysis and Forecast 2017 to 2033, by Test Type Table 34: East Asia Market Value (US$ Million) Analysis and Forecast 2017 to 2033, by Sample Type Table 35: East Asia Market Value (US$ Million) Analysis and Forecast 2017 to 2033, by Distribution Channel Table 36: Oceania Market Value (US$ Million) Analysis 2017-2022 and Forecast 2023 to 2033, by Country Table 37: Oceania Market Value (US$ Million) Analysis and Forecast 2017 to 2033, by Product Table 38: Oceania Market Volume (Units) Analysis and Forecast 2017 to 2033, by Product Table 39: Oceania Market Value (US$ Million) Analysis and Forecast 2017 to 2033, by Test Type Table 40: Oceania Market Value (US$ Million) Analysis and Forecast 2017 to 2033, by Sample Type Table 41: Oceania Market Value (US$ Million) Analysis and Forecast 2017 to 2033, by Distribution Channel Table 42: Middle East & Africa Market Value (US$ Million) Analysis 2017-2022 and Forecast 2023 to 2033, by Country Table 43: Middle East & Africa Market Value (US$ Million) Analysis and Forecast 2017 to 2033, by Product Table 44: Middle East & Africa Market Volume (Units) Analysis and Forecast 2017 to 2033, by Product Table 45: Middle East & Africa Market Value (US$ Million) Analysis and Forecast 2017 to 2033, by Test Type Table 46: Middle East & Africa Market Value (US$ Million) Analysis and Forecast 2017 to 2033, by Sample Type Table 47: Middle East & Africa Market Value (US$ Million) Analysis and Forecast 2017 to 2033, by Distribution Channel
List of Charts
Figure 01: Global Market Volume (Units), 2017 to 2022 Figure 02: Global Market Volume (Units) & Y-o-Y Growth (%) Analysis, Figure 03: Test Kits, Pricing Analysis per unit (US$), in 2022 Figure 04: Test Kits, Pricing Forecast per unit (US$), in 2033 Figure 05: Global Market Value (US$ Million) Analysis, 2017 to 2022 Figure 06: Global Market Forecast & Y-o-Y Growth, 2023 to 2033 Figure 07: Global Market Absolute $ Opportunity (US$ Million) Analysis, 2023 to 2033 Figure 08: Global Market Value Share (%) Analysis 2023 and 2033, by Product Figure 09: Global Market Y-o-Y Growth (%) Analysis 2022 to 2033, by Product Figure 10: Global Market Attractiveness Analysis 2023 to 2033, by Product Figure 11: Global Market Value Share (%) Analysis 2023 and 2033, by Test Type Figure 12: Global Market Y-o-Y Growth (%) Analysis 2022 to 2033, by Test Type Figure 13: Global Market Attractiveness Analysis 2023 to 2033, by Test Type Figure 14: Global Market Value Share (%) Analysis 2023 and 2033, by Sample Type Figure 15: Global Market Y-o-Y Growth (%) Analysis 2022 to 2033, by Sample Type Figure 16: Global Market Attractiveness Analysis 2023 to 2033, by Sample Type Figure 17: Global Market Value Share (%) Analysis 2023 and 2033, by Distribution Channel Figure 18: Global Market Y-o-Y Growth (%) Analysis 2022 to 2033, by Distribution Channel Figure 19: Global Market Attractiveness Analysis 2023 to 2033, by Distribution Channel Figure 20: Global Market Value Share (%) Analysis 2023 and 2033, by Region Figure 21: Global Market Y-o-Y Growth (%) Analysis 2022 to 2033, by Region Figure 22: Global Market Attractiveness Analysis 2023 to 2033, by Region Figure 23: North America Market Value (US$ Million) Analysis, 2017 to 2022 Figure 24: North America Market Value (US$ Million) Forecast, 2023-2033 Figure 25: North America Market Value Share, by Product (2023 E) Figure 26: North America Market Value Share, by Test Type (2023 E) Figure 27: North America Market Value Share, by Sample Type (2023 E) Figure 28: North America Market Value Share, by Distribution Channel (2023 E) Figure 29: North America Market Value Share, by Country (2023 E) Figure 30: North America Market Attractiveness Analysis by Product, 2023 to 2033 Figure 31: North America Market Attractiveness Analysis by Test Type, 2023 to 2033 Figure 32: North America Market Attractiveness Analysis by Sample Type, 2023 to 2033 Figure 33: North America Market Attractiveness Analysis by Distribution Channel, 2023 to 2033 Figure 34: North America Market Attractiveness Analysis by Country, 2023 to 2033 Figure 35: USA Market Value Proportion Analysis, 2022 Figure 36: Global Vs. USA Growth Comparison Figure 37: USA Market Share Analysis (%) by Product, 2022 & 2033 Figure 38: USA Market Share Analysis (%) by Test Type, 2022 & 2033 Figure 39: USA Market Share Analysis (%) by Sample Type, 2022 & 2033 Figure 40: USA Market Share Analysis (%) by Distribution Channel, 2022 & 2033 Figure 41: Canada Market Value Proportion Analysis, 2022 Figure 42: Global Vs. Canada. Growth Comparison Figure 43: Canada Market Share Analysis (%) by Product, 2022 & 2033 Figure 44: Canada Market Share Analysis (%) by Test Type, 2022 & 2033 Figure 45: Canada Market Share Analysis (%) by Sample Type, 2022 & 2033 Figure 46: Canada Market Share Analysis (%) by Distribution Channel, 2022 & 2033 Figure 47: Latin America Market Value (US$ Million) Analysis, 2017 to 2022 Figure 48: Latin America Market Value (US$ Million) Forecast, 2023-2033 Figure 49: Latin America Market Value Share, by Product (2023 E) Figure 50: Latin America Market Value Share, by Test Type (2023 E) Figure 51: Latin America Market Value Share, by Sample Type (2023 E) Figure 52: Latin America Market Value Share, by Distribution Channel (2023 E) Figure 53: Latin America Market Value Share, by Country (2023 E) Figure 54: Latin America Market Attractiveness Analysis by Product, 2023 to 2033 Figure 55: Latin America Market Attractiveness Analysis by Test Type, 2023 to 2033 Figure 56: Latin America Market Attractiveness Analysis by Sample Type, 2023 to 2033 Figure 57: Latin America Market Attractiveness Analysis by Distribution Channel, 2023 to 2033 Figure 58: Latin America Market Attractiveness Analysis by Country, 2023 to 2033 Figure 59: Mexico Market Value Proportion Analysis, 2022 Figure 60: Global Vs Mexico Growth Comparison Figure 61: Mexico Market Share Analysis (%) by Product, 2022 & 2033 Figure 62: Mexico Market Share Analysis (%) by Test Type, 2022 & 2033 Figure 63: Mexico Market Share Analysis (%) by Sample Type, 2022 & 2033 Figure 64: Mexico Market Share Analysis (%) by Distribution Channel, 2022 & 2033 Figure 65: Brazil Market Value Proportion Analysis, 2022 Figure 66: Global Vs. Brazil. Growth Comparison Figure 67: Brazil Market Share Analysis (%) by Product, 2022 & 2033 Figure 68: Brazil Market Share Analysis (%) by Test Type, 2022 & 2033 Figure 69: Brazil Market Share Analysis (%) by Sample Type, 2022 & 2033 Figure 70: Brazil Market Share Analysis (%) by Distribution Channel, 2022 & 2033 Figure 71: Argentina Market Value Proportion Analysis, 2022 Figure 72: Global Vs Argentina Growth Comparison Figure 73: Argentina Market Share Analysis (%) by Product, 2022 & 2033 Figure 74: Argentina Market Share Analysis (%) by Test Type, 2022 & 2033 Figure 75: Argentina Market Share Analysis (%) by Sample Type, 2022 & 2033 Figure 76: Argentina Market Share Analysis (%) by Distribution Channel, 2022 & 2033 Figure 77: Europe Market Value (US$ Million) Analysis, 2017 to 2022 Figure 78: Europe Market Value (US$ Million) Forecast, 2023-2033 Figure 79: Europe Market Value Share, by Product (2023 E) Figure 80: Europe Market Value Share, by Test Type (2023 E) Figure 81: Europe Market Value Share, by Sample Type (2023 E) Figure 82: Europe Market Value Share, by Distribution Channel (2023 E) Figure 83: Europe Market Value Share, by Country (2023 E) Figure 84: Europe Market Attractiveness Analysis by Product, 2023 to 2033 Figure 85: Europe Market Attractiveness Analysis by Test Type, 2023 to 2033 Figure 86: Europe Market Attractiveness Analysis by Sample Type, 2023 to 2033 Figure 87: Europe Market Attractiveness Analysis by Distribution Channel, 2023 to 2033 Figure 88: Europe Market Attractiveness Analysis by Country, 2023 to 2033 Figure 89: UK Market Value Proportion Analysis, 2022 Figure 90: Global Vs. UK Growth Comparison Figure 91: UK Market Share Analysis (%) by Product, 2022 & 2033 Figure 92: UK Market Share Analysis (%) by Test Type, 2022 & 2033 Figure 93: UK Market Share Analysis (%) by Sample Type, 2022 & 2033 Figure 94: UK Market Share Analysis (%) by Distribution Channel, 2022 & 2033 Figure 95: Germany Market Value Proportion Analysis, 2022 Figure 96: Global Vs. Germany Growth Comparison Figure 97: Germany Market Share Analysis (%) by Product, 2022 & 2033 Figure 98: Germany Market Share Analysis (%) by Test Type, 2022 & 2033 Figure 99: Germany Market Share Analysis (%) by Sample Type, 2022 & 2033 Figure 100: Germany Market Share Analysis (%) by Distribution Channel, 2022 & 2033 Figure 101: Italy Market Value Proportion Analysis, 2022 Figure 102: Global Vs. Italy Growth Comparison Figure 103: Italy Market Share Analysis (%) by Product, 2022 & 2033 Figure 104: Italy Market Share Analysis (%) by Test Type, 2022 & 2033 Figure 105: Italy Market Share Analysis (%) by Sample Type, 2022 & 2033 Figure 106: Italy Market Share Analysis (%) by Distribution Channel, 2022 & 2033 Figure 107: France Market Value Proportion Analysis, 2022 Figure 108: Global Vs France Growth Comparison Figure 109: France Market Share Analysis (%) by Product, 2022 & 2033 Figure 110: France Market Share Analysis (%) by Test Type, 2022 & 2033 Figure 111: France Market Share Analysis (%) by Sample Type, 2022 & 2033 Figure 112: France Market Share Analysis (%) by Distribution Channel, 2022 & 2033 Figure 113: Spain Market Value Proportion Analysis, 2022 Figure 114: Global Vs Spain Growth Comparison Figure 115: Spain Market Share Analysis (%) by Product, 2022 & 2033 Figure 116: Spain Market Share Analysis (%) by Test Type, 2022 & 2033 Figure 117: Spain Market Share Analysis (%) by Sample Type, 2022 & 2033 Figure 118: Spain Market Share Analysis (%) by Distribution Channel, 2022 & 2033 Figure 119: Russia Market Value Proportion Analysis, 2022 Figure 120: Global Vs Russia Growth Comparison Figure 121: Russia Market Share Analysis (%) by Product, 2022 & 2033 Figure 122: Russia Market Share Analysis (%) by Test Type, 2022 & 2033 Figure 123: Russia Market Share Analysis (%) by Sample Type, 2022 & 2033 Figure 124: Russia Market Share Analysis (%) by Distribution Channel, 2022 & 2033 Figure 125: BENELUX Market Value Proportion Analysis, 2022 Figure 126: Global Vs BENELUX Growth Comparison Figure 127: BENELUX Market Share Analysis (%) by Product, 2022 & 2033 Figure 128: BENELUX Market Share Analysis (%) by Test Type, 2022 & 2033 Figure 129: BENELUX Market Share Analysis (%) by Sample Type, 2022 & 2033 Figure 130: BENELUX Market Share Analysis (%) by Distribution Channel, 2022 & 2033 Figure 131: East Asia Market Value (US$ Million) Analysis, 2017 to 2022 Figure 132: East Asia Market Value (US$ Million) Forecast, 2023-2033 Figure 133: East Asia Market Value Share, by Product (2023 E) Figure 134: East Asia Market Value Share, by Test Type (2023 E) Figure 135: East Asia Market Value Share, by Sample Type (2023 E) Figure 136: East Asia Market Value Share, by Distribution Channel (2023 E) Figure 137: East Asia Market Value Share, by Country (2023 E) Figure 138: East Asia Market Attractiveness Analysis by Product, 2023 to 2033 Figure 139: East Asia Market Attractiveness Analysis by Test Type, 2023 to 2033 Figure 140: East Asia Market Attractiveness Analysis by Sample Type, 2023 to 2033 Figure 141: East Asia Market Attractiveness Analysis by Distribution Channel, 2023 to 2033 Figure 142: East Asia Market Attractiveness Analysis by Country, 2023 to 2033 Figure 143: China Market Value Proportion Analysis, 2022 Figure 144: Global Vs. China Growth Comparison Figure 145: China Market Share Analysis (%) by Product, 2022 & 2033 Figure 146: China Market Share Analysis (%) by Test Type, 2022 & 2033 Figure 147: China Market Share Analysis (%) by Sample Type, 2022 & 2033 Figure 148: China Market Share Analysis (%) by Distribution Channel, 2022 & 2033 Figure 149: Japan Market Value Proportion Analysis, 2022 Figure 150: Global Vs. Japan Growth Comparison Figure 151: Japan Market Share Analysis (%) by Product, 2022 & 2033 Figure 152: Japan Market Share Analysis (%) by Test Type, 2022 & 2033 Figure 153: Japan Market Share Analysis (%) by Sample Type, 2022 & 2033 Figure 154: Japan Market Share Analysis (%) by Distribution Channel, 2022 & 2033 Figure 155: South Korea Market Value Proportion Analysis, 2022 Figure 156: Global Vs South Korea Growth Comparison Figure 157: South Korea Market Share Analysis (%) by Product, 2022 & 2033 Figure 158: South Korea Market Share Analysis (%) by Test Type, 2022 & 2033 Figure 159: South Korea Market Share Analysis (%) by Sample Type, 2022 & 2033 Figure 160: South Korea Market Share Analysis (%) by Distribution Channel, 2022 & 2033 Figure 161: South Asia Market Value (US$ Million) Analysis, 2017 to 2022 Figure 162: South Asia Market Value (US$ Million) Forecast, 2023-2033 Figure 163: South Asia Market Value Share, by Product (2023 E) Figure 164: South Asia Market Value Share, by Test Type (2023 E) Figure 165: South Asia Market Value Share, by Sample Type (2023 E) Figure 166: South Asia Market Value Share, by Distribution Channel (2023 E) Figure 167: South Asia Market Value Share, by Country (2023 E) Figure 168: South Asia Market Attractiveness Analysis by Product, 2023 to 2033 Figure 169: South Asia Market Attractiveness Analysis by Test Type, 2023 to 2033 Figure 170: South Asia Market Attractiveness Analysis by Sample Type, 2023 to 2033 Figure 171: South Asia Market Attractiveness Analysis by Distribution Channel, 2023 to 2033 Figure 172: South Asia Market Attractiveness Analysis by Country, 2023 to 2033 Figure 173: India Market Value Proportion Analysis, 2022 Figure 174: Global Vs. India Growth Comparison Figure 175: India Market Share Analysis (%) by Product, 2022 & 2033 Figure 176: India Market Share Analysis (%) by Test Type, 2022 & 2033 Figure 177: India Market Share Analysis (%) by Sample Type, 2022 & 2033 Figure 178: India Market Share Analysis (%) by Distribution Channel, 2022 & 2033 Figure 179: Indonesia Market Value Proportion Analysis, 2022 Figure 180: Global Vs. Indonesia Growth Comparison Figure 181: Indonesia Market Share Analysis (%) by Product, 2022 & 2033 Figure 182: Indonesia Market Share Analysis (%) by Test Type, 2022 & 2033 Figure 183: Indonesia Market Share Analysis (%) by Sample Type, 2022 & 2033 Figure 184: Indonesia Market Share Analysis (%) by Distribution Channel, 2022 & 2033 Figure 185: Malaysia Market Value Proportion Analysis, 2022 Figure 186: Global Vs. Malaysia Growth Comparison Figure 187: Malaysia Market Share Analysis (%) by Product, 2022 & 2033 Figure 188: Malaysia Market Share Analysis (%) by Test Type, 2022 & 2033 Figure 189: Malaysia Market Share Analysis (%) by Sample Type, 2022 & 2033 Figure 190: Malaysia Market Share Analysis (%) by Distribution Channel, 2022 & 2033 Figure 191: Thailand Market Value Proportion Analysis, 2022 Figure 192: Global Vs. Thailand Growth Comparison Figure 193: Thailand Market Share Analysis (%) by Product, 2022 & 2033 Figure 194: Thailand Market Share Analysis (%) by Test Type, 2022 & 2033 Figure 195: Thailand Market Share Analysis (%) by Sample Type, 2022 & 2033 Figure 196: Thailand Market Share Analysis (%) by Distribution Channel, 2022 & 2033 Figure 197: Oceania Market Value (US$ Million) Analysis, 2017 to 2022 Figure 198: Oceania Market Value (US$ Million) Forecast, 2023-2033 Figure 199: Oceania Market Value Share, by Product (2023 E) Figure 200: Oceania Market Value Share, by Test Type (2023 E) Figure 201: Oceania Market Value Share, by Sample Type (2023 E) Figure 202: Oceania Market Value Share, by Distribution Channel (2023 E) Figure 203: Oceania Market Value Share, by Country (2023 E) Figure 204: Oceania Market Attractiveness Analysis by Product, 2023 to 2033 Figure 205: Oceania Market Attractiveness Analysis by Test Type, 2023 to 2033 Figure 206: Oceania Market Attractiveness Analysis by Sample Type, 2023 to 2033 Figure 207: Oceania Market Attractiveness Analysis by Distribution Channel, 2023 to 2033 Figure 208: Oceania Market Attractiveness Analysis by Country, 2023 to 2033 Figure 209: Australia Market Value Proportion Analysis, 2022 Figure 210: Global Vs. Australia Growth Comparison Figure 211: Australia Market Share Analysis (%) by Product, 2022 & 2033 Figure 212: Australia Market Share Analysis (%) by Test Type, 2022 & 2033 Figure 213: Australia Market Share Analysis (%) by Sample Type, 2022 & 2033 Figure 214: Australia Market Share Analysis (%) by Distribution Channel, 2022 & 2033 Figure 215: New Zealand Market Value Proportion Analysis, 2022 Figure 216: Global Vs New Zealand Growth Comparison Figure 217: New Zealand Market Share Analysis (%) by Product, 2022 & 2033 Figure 218: New Zealand Market Share Analysis (%) by Test Type, 2022 & 2033 Figure 219: New Zealand Market Share Analysis (%) by Sample Type, 2022 & 2033 Figure 220: New Zealand Market Share Analysis (%) by Distribution Channel, 2022 & 2033 Figure 221: Middle East & Africa Market Value (US$ Million) Analysis, 2017 to 2022 Figure 222: Middle East & Africa Market Value (US$ Million) Forecast, 2023-2033 Figure 223: Middle East & Africa Market Value Share, by Product (2023 E) Figure 224: Middle East & Africa Market Value Share, by Test Type (2023 E) Figure 225: Middle East & Africa Market Value Share, by Sample Type (2023 E) Figure 226: Middle East & Africa Market Value Share, by Distribution Channel (2023 E) Figure 227: Middle East & Africa Market Value Share, by Country (2023 E) Figure 228: Middle East & Africa Market Attractiveness Analysis by Product, 2023 to 2033 Figure 229: Middle East & Africa Market Attractiveness Analysis by Test Type, 2023 to 2033 Figure 230: Middle East & Africa Market Attractiveness Analysis by Sample Type, 2023 to 2033 Figure 231: Middle East & Africa Market Attractiveness Analysis by Distribution Channel, 2023 to 2033 Figure 232: Middle East & Africa Market Attractiveness Analysis by Country, 2023 to 2033 Figure 233: GCC Countries Market Value Proportion Analysis, 2022 Figure 234: Global Vs GCC Countries Growth Comparison Figure 235: GCC Countries Market Share Analysis (%) by Product, 2022 & 2033 Figure 236: GCC Countries Market Share Analysis (%) by Test Type, 2022 & 2033 Figure 237: GCC Countries Market Share Analysis (%) by Sample Type, 2022 & 2033 Figure 238: GCC Countries Market Share Analysis (%) by Distribution Channel, 2022 & 2033 Figure 239: Türkiye Market Value Proportion Analysis, 2022 Figure 240: Global Vs. Türkiye Growth Comparison Figure 241: Türkiye Market Share Analysis (%) by Product, 2022 & 2033 Figure 242: Türkiye Market Share Analysis (%) by Test Type, 2022 & 2033 Figure 243: Türkiye Market Share Analysis (%) by Sample Type, 2022 & 2033 Figure 244: Türkiye Market Share Analysis (%) by Distribution Channel, 2022 & 2033 Figure 245: South Africa Market Value Proportion Analysis, 2022 Figure 246: Global Vs. South Africa Growth Comparison Figure 247: South Africa Market Share Analysis (%) by Product, 2022 & 2033 Figure 248: South Africa Market Share Analysis (%) by Test Type, 2022 & 2033 Figure 249: South Africa Market Share Analysis (%) by Sample Type, 2022 & 2033 Figure 250: South Africa Market Share Analysis (%) by Distribution Channel, 2022 & 2033 Figure 251: North Africa Market Value Proportion Analysis, 2022 Figure 252: Global Vs North Africa Growth Comparison Figure 253: North Africa Market Share Analysis (%) by Product, 2022 & 2033 Figure 254: North Africa Market Share Analysis (%) by Test Type, 2022 & 2033 Figure 255: North Africa Market Share Analysis (%) by Sample Type, 2022 & 2033 Figure 256: North Africa Market Share Analysis (%) by Distribution Channel, 2022 & 2033
Explore Healthcare Insights
View Reports