Reports

- Global Locations -

Headquarters

Future Market Insights, Inc.

Christiana Corporate, 200
Continental Drive, Suite 401,
Newark, Delaware - 19713,
United States

T: +1-845-579-5705

Americas

Future Market Insights, Inc.

616 Corporate Way, Suite 2-9018,
Valley Cottage, NY 10989, United States

T: +1-347-918-3531

MEA

Future Market Insights

1602-6 Jumeirah Bay X2 Tower, Plot No: JLT-PH2-X2A,
Jumeirah Lakes Towers, Dubai,
United Arab Emirates

Europe

Future Market Insights

3rd Floor, 207 Regent Street,
W1B 3HH London
United Kingdom

T: + 44 (0) 20 8123 9659
D: +44 (0) 20 3287 4268

Asia Pacific

Future Market Insights

IndiaLand Global Tech Park, Unit UG-1, Behind Grand HighStreet, Phase 1, Hinjawadi, MH, Pune – 411057, India

Swine Vaccine Market Outlook (2022 to 2032)

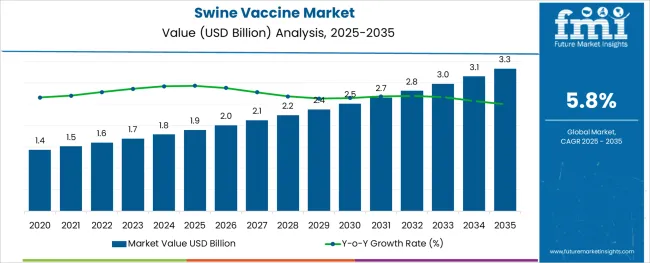
The newly released Global Swine Vaccine Market analysis report by Future Market Insights reveals that the global market for Swine Vaccine was held at around US$ 1.5 Billion in 2021, and is projected to grow at a CAGR of 5.8% from 2022 to 2032. The market is expected to surge with an absolute dollar opportunity of US$ 1.2 Billion. The projected market growth is expected to cross the historical CAGR of 4.9%.

The Inactivated Vaccines segment is likely to outpace all the other segments by growing at a CAGR of 5.9% from 2022 to 2032. Furthermore, Porcine Circovirus Type 2 was the top type segment in the global market. Revenue through this segment is expected to grow at a CAGR of 5.6% during the forecasted period.

Attribute Details
Global Swine Vaccines Market (2022) US$ 1.6 Billion
Global Swine Vaccines Market (2032) US$ 2.8 Billion
Global Swine Vaccines Market CAGR (2022 to 2032) 5.8%
USA Swine Vaccines Market CAGR (2022 to 2032) 6%
Key Companies Profiled
  • Merck Animal Health
  • Ceva
  • Zoetis
  • Boehringer Ingelheim GmbH
  • Elanco
  • Indian Immunologicals Ltd.
  • BiogénesisBagó
  • Phibro Animal Health
  • KM Biologics
  • HIPRA

The global market for Swine Vaccines is likely to be driven by increased demand for animal protein and surged Research and Development expenditure for vaccine innovation. Swine production is vital to global food security, agricultural countries, and domestic and international trade.

Contagious diseases have a global impact on pig health, as well as the swine industry's stability and production. As a result, increased swine disease prevalence is expected to boost the market in the coming years. Furthermore, leading players' increasing efforts in developing improved products for better diagnostics are expected to drive market expansion.

Don't pay for what you don't need

Customize your report by selecting specific countries or regions and save 30%!

Revenue of the Global Swine Vaccine market from 2017 to 2021 Compared to Demand Outlook for 2022 to 2032

As per the Swine Vaccine Market research by Future Market Insights - a market research and competitive intelligence provider, historically, from 2017 to 2021, the market value of the Swine Vaccine increased at a CAGR of around 4.9%, while the USA held the majority share of over 35% in the global market.

The market is being driven by increased disease prevalence, increased demand for animal protein, and increased Research and Development expenditure for vaccine innovation. Owing to this, the market for Swine Vaccines is projected to grow at a CAGR of 5.8% during the forecasted period.

Which factors are driving the growth of the Swine Vaccine Market?

Some of the key factors driving the growth of the Swine Vaccine market are the rising prevalence of swine diseases like PPV, Porcine Reproductive and Respiratory Syndrome (PRRS), and Classical Swine Fever, which are likely to cause economic losses due to their negative effects on reproduction and growth in pig farms.

Swine meat is vital for agriculture-based countries and it considerably affects domestic and international trade. Contagious diseases have a global impact on pig health, as well as the swine industry's stability and production. As a result, the increased prevalence of swine disease is expected to boost the market in the coming years.

Putting in place a pig vaccination program helps in protecting them from infectious diseases at every stage of their development. As a result, businesses are concentrating on providing immunization services to assist farmers to manage bacteria and viruses more effectively.

The rise in demand for animal protein, along with rising consumer preferences for a low-fat, high-protein diet like pork has resulted in a significant increase in animal protein consumption around the world.

Sabyasachi Ghosh
Sabyasachi Ghosh

Principal Consultant

Talk to Analyst

Find your sweet spots for generating winning opportunities in this market.

Region-wise Analysis

Which Region is Expected to Offer the Largest Opportunity for the Swine Vaccine Market?

APAC dominated the Swine Vaccine Market, where China led the regional demand. The consumption of beef and pork is higher in middle-income countries, particularly in Southeast Asia.

In addition, emerging infectious diseases in the region, such as swine fever, drive product demand even further. In India, CSF results in an annual loss of approximately 400 crores. As a result, the Indian government is placing a greater emphasis on the development of new vaccines. In October 2019, for example, the ICAR-Indian Veterinary Research Institute developed two diagnostic kits for Swine Control and Antigen Detection. These factors are leading to the expansion of the swine vaccine market in APAC.
Country-wise Analysis

USA Swine Vaccine Market Analysis

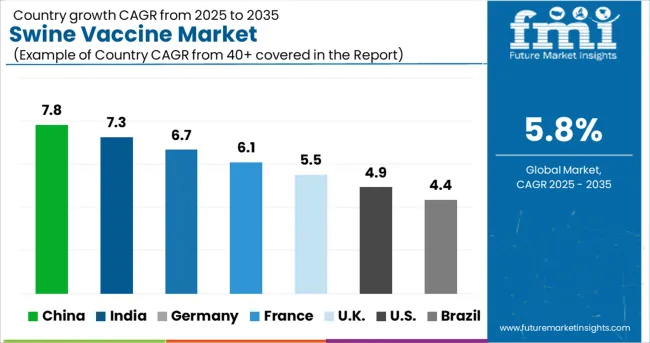
The market for swine vaccines in the USA is expected to reach a valuation of US$ 319 Million by 2032. With a CAGR of 6% during the forecast period, the market in the country is projected to gross an absolute dollar opportunity of US$ 137 Million.

UK Swine Vaccine Market Analysis

The market in the UK is projected to reach a valuation of US$ 112 Million by 2032. Growing at a CAGR of 6.1% during the forecast period, the market is expected to garner an absolute dollar opportunity of around US$ 48 Million.

China Swine Vaccine Market Analysis

In China, the market is projected to expand at a CAGR of 6.9% during 2022 - 2032. The market in the country is projected to reach US$ 1.1 Billion by 2032, grossing an absolute dollar opportunity of US$ 463 Million during the forecast period.

Japan Swine Vaccine Market Analysis

In Japan, the market is expected to reach a valuation of US$ 224 Million by 2032. With a CAGR of 7.5%, the market in the country is expected to gross an absolute dollar opportunity of US$ 96 Million by 2032.

Get the data you need at a Fraction of the cost

Personalize your report by choosing insights you need
and save 40%!

Category-wise Insights

Why Inactivated Vaccines are Gaining Significant Traction?

The market for Inactivated Vaccines is gaining the utmost traction and is expected to grow at a CAGR of 5.9% between 2022 and 2032. This increase in growth is attributable to easy availability, low cost, low risk of revert reaction of destroyed viruses, and fresh advances by key companies. For Example, PARVOVAX and PROGRESSIS vaccines were developed to fight against Porcine parvovirus and PRRS.

From 2022 to 2032, the recombinant vaccine category is projected to grow at the fastest rate. Because recombinants can carry many gene inserts, these vaccines are expected to aid in the vaccination of multiple viral strains.

Among the Type wise taxonomy, which segment is expected to show the best results and why?

Porcine Circovirus Type 2 is expected to dominate the global market and is expected to grow with a CAGR of 5.6% during the forecast period. PCV2 is the single-stranded DNA having the highest mutation and recombination rate among all single-stranded DNA viruses. It can be spread through an infected pig and is one of the most prevalent infectious agents affecting pig productivity. As a result, during the forecast period, it will contribute to a significant market share.
Competitive Analysis

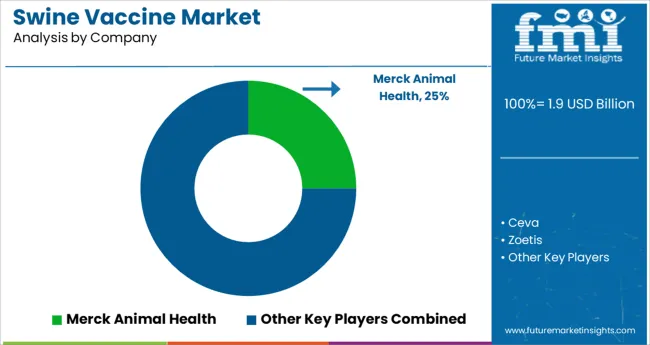
Some of the key competitors in the Swine Vaccine Market are Merck Animal Health, Ceva, Zoetis, Boehringer Ingelheim GmbH, Elanco, Indian Immunologicals Ltd., BiogénesisBagó, Phibro Animal Health, KM Biologics, and HIPRA.

Some of the recent developments in the Swine Vaccine Market are as follows:

  • In February 2021, Merck Animal Health acquired PrognostiX Poultry Ltd., a provider of health and environmental monitoring solutions to bring enhanced solutions for poultry producers.
  • In February 2021, Zoetics partnered with InRoads College for exploring the diverse opportunities in the Animal Health segment. This will provide them with an opportunity to identify and develop talented scientists and veterinarians.
  • In September 2019, CEVA made an agreement with Biotecon diagnostics for producing a real-time test kit to prevent the spread of Salmonella infection on pig farms.

Similarly, recent developments related to companies offering Swine Vaccine have been tracked by the team at Future Market Insights, which are available in the full report.

Market Segments Covered in Swine Vaccine Market Analysis

By Type:

  • Swine Influenza
  • Classical Swine Fever
  • Porcine Parvovirus
  • Porcine Circovirus Type 2
  • M.Hyo
  • Actinobacillus Pleuropneumonia
  • PRRS
  • Foot & Mouth Disease
  • Pseudorabies
  • PEDV
  • Other Types

By Product:

  • Attenuated Live Vaccines
  • Inactivated Vaccines
  • Subunit Vaccines
  • DNA Vaccines
  • Recombinant Vaccines

By Region type:

  • North America
  • Latin America
  • Europe
  • APAC
  • Middle East and Africa (MEA)

Frequently Asked Questions

What is the current valuation of the Global Swine Vaccine Market?

The Global Swine Vaccine Market is currently valued at US$ 1.5 billion and is expected to reach a valuation of US$ 1.6 billion by the end of 2022.

What is the Absolute Dollar Opportunity in the Global Market for Swine Vaccines?

The Global Market for Swine Vaccine is expected to provide an Absolute Dollar Opportunity of US$ 1.2 billion during the period between 2022 and 2032 by growing at a CAGR of 5.8%.

Which Product segment is expected to prevail during the forecast period and why?

The Inactivated Vaccines segment is likely to maintain its dominance and is expected to grow at a CAGR of 5.9% during the forecast period. This growth is attributable to easy availability, low cost, low risk of revert reaction of destroyed viruses, and fresh advances by key companies.

Mention some key players in the Swine Vaccine market?

The key players operating in the Swine Vaccine market are Merck Animal Health, Ceva, Zoetis, Boehringer Ingelheim GmbH, Elanco, Indian Immunologicals Ltd., BiogénesisBagó, Phibro Animal Health, KM Biologics, and HIPRA.

Table of Content

1. Executive Summary | Swine Vaccine Market

    1.1. Global Market Outlook

    1.2. Summary of Statistics

    1.3. Key Market Characteristics & Attributes

    1.4. Analysis and Recommendations

2. Market Overview

    2.1. Market Coverage / Taxonomy

    2.2. Market Definition / Scope / Limitations

3. Market Risks and Trends Assessment

    3.1. Risk Assessment

        3.1.1. COVID-19 Crisis and Impact on Demand

        3.1.2. COVID-19 Impact Benchmark with Previous Crisis

        3.1.3. Impact on Market Value (US$ Million)

        3.1.4. Assessment by Key Countries

        3.1.5. Assessment by Key Market Segments

        3.1.6. Action Points and Recommendation for Suppliers

    3.2. Key Trends Impacting the Market

    3.3. Formulation and Product Development Trends

4. Market Background and Foundation Data Points

    4.1. Global Market (US$ Million)

    4.2. Market Opportunity Assessment (US$ Million)

        4.2.1. Total Available Market

        4.2.2. Serviceable Addressable Market

        4.2.3. Serviceable Obtainable Market

    4.3. Market Scenario Forecast

        4.3.1. Demand in optimistic Scenario

        4.3.2. Demand in Likely Scenario

        4.3.3. Demand in Conservative Scenario

    4.4. Investment Feasibility Analysis

        4.4.1. Investment in Established Markets

            4.4.1.1. In Short Term

            4.4.1.2. In Long Term

        4.4.2. Investment in Emerging Markets

            4.4.2.1. In Short Term

            4.4.2.2. In Long Term

    4.5. Forecast Factors - Relevance & Impact

        4.5.1. Top Companies Historical Growth

        4.5.2. Global Market Growth

        4.5.3. Adoption Rate, By Country

    4.6. Market Dynamics

        4.6.1. Market Driving Factors and Impact Assessment

        4.6.2. Prominent Market Challenges and Impact Assessment

        4.6.3. Market Opportunities

        4.6.4. Prominent Trends in the Global Market & Their Impact Assessment

5. Key Success Factors

    5.1. Manufacturers’ Focus on Low Penetration High Growth Markets

    5.2. Banking on with Segments High Incremental Opportunity

    5.3. Peer Benchmarking

6. Global Market Demand Analysis 2017 to 2021 and Forecast, 2022 to 2032

    6.1. Historical Market Analysis, 2017 to 2021

    6.2. Current and Future Market Projections, 2022 to 2032

    6.3. Y-o-Y Growth Trend Analysis

7. Global Market Value Analysis 2017 to 2021 and Forecast, 2022 to 2032

    7.1. Historical Market Value (US$ Million) Analysis, 2017 to 2021

    7.2. Current and Future Market Value (US$ Million) Projections, 2022 to 2032

        7.2.1. Y-o-Y Growth Trend Analysis

        7.2.2. Absolute $ Opportunity Analysis

8. Global Market Analysis 2017 to 2021 and Forecast 2022 to 2032, By Type

    8.1. Introduction / Key Findings

    8.2. Historical Market Size (US$ Million) Analysis By Type, 2017 to 2021

    8.3. Current and Future Market Size (US$ Million) Analysis and Forecast By Type, 2022 to 2032

        8.3.1. Swine Influenza

        8.3.2. Classical Swine Fever

        8.3.3. Porcine Parvovirus

        8.3.4. Porcine Circovirus Type 2

        8.3.5. M.Hyo

        8.3.6. Actinobacillus Pleuropneumonia

        8.3.7. Classical Swine Fever

        8.3.8. Foot & Mouth Disease

        8.3.9. Pseudorabies

        8.3.10. PEDV

9. Global Market Analysis 2017 to 2021 and Forecast 2022 to 2032, By Product

    9.1. Introduction / Key Findings

    9.2. Historical Market Size (US$ Million) Analysis By Product, 2017 to 2021

    9.3. Current and Future Market Size (US$ Million) Analysis and Forecast By Product, 2022 to 2032

        9.3.1. Attenuated Live Vaccines

        9.3.2. Inactivated Vaccines

        9.3.3. Subunit Vaccines

        9.3.4. DNA Vaccines

        9.3.5. Recombinant Vaccines

    9.4. Market Attractiveness Analysis By Product

10. Global Market Analysis 2017 to 2021 and Forecast 2022 to 2032, By Region

    10.1. Introduction

    10.2. Historical Market Size (US$ Million) Analysis By Region, 2017 to 2021

    10.3. Current Market Size (US$ Million) & Analysis and Forecast By Region, 2022 to 2032

        10.3.1. North America

        10.3.2. Latin America

        10.3.3. Europe

        10.3.4. Asia Pacific

        10.3.5. Middle East and Africa (MEA)

    10.4. Market Attractiveness Analysis By Region

11. North America Market Analysis 2017 to 2021 and Forecast 2022 to 2032

    11.1. Introduction

    11.2. Pricing Analysis

    11.3. Historical Market Value (US$ Million) Trend Analysis By Market Taxonomy, 2017 to 2021

    11.4. Market Value (US$ Million) & Forecast By Market Taxonomy, 2022 to 2032

        11.4.1. By Country

            11.4.1.1. United States of America

            11.4.1.2. Canada

            11.4.1.3. Rest of North America

        11.4.2. By Type

        11.4.3. By Product

    11.5. Market Attractiveness Analysis

        11.5.1. By Country

        11.5.2. By Type

        11.5.3. By Product

12. Latin America Market Analysis 2017 to 2021 and Forecast 2022 to 2032

    12.1. Introduction

    12.2. Pricing Analysis

    12.3. Historical Market Value (US$ Million) Trend Analysis By Market Taxonomy, 2017 to 2021

    12.4. Market Value (US$ Million) & Forecast By Market Taxonomy, 2022 to 2032

        12.4.1. By Country

            12.4.1.1. Brazil

            12.4.1.2. Mexico

            12.4.1.3. Rest of Latin America

        12.4.2. By Type

        12.4.3. By Product

    12.5. Market Attractiveness Analysis

        12.5.1. By Country

        12.5.2. By Type

        12.5.3. By Product

13. Europe Market Analysis 2017 to 2021 and Forecast 2022 to 2032

    13.1. Introduction

    13.2. Pricing Analysis

    13.3. Historical Market Value (US$ Million) Trend Analysis By Market Taxonomy, 2017 to 2021

    13.4. Market Value (US$ Million) & Forecast By Market Taxonomy, 2022 to 2032

        13.4.1. By Country

            13.4.1.1. Germany

            13.4.1.2. France

            13.4.1.3. United Kingdom

            13.4.1.4. Italy

            13.4.1.5. Benelux

            13.4.1.6. Nordic Countries

            13.4.1.7. Rest of Europe

        13.4.2. By Type

        13.4.3. By Product

    13.5. Market Attractiveness Analysis

        13.5.1. By Country

        13.5.2. By Type

        13.5.3. By Product

14. Asia Pacific Market Analysis 2017 to 2021 and Forecast 2022 to 2032

    14.1. Introduction

    14.2. Pricing Analysis

    14.3. Historical Market Value (US$ Million) Trend Analysis By Market Taxonomy, 2017 to 2021

    14.4. Market Value (US$ Million) & Forecast By Market Taxonomy, 2022 to 2032

        14.4.1. By Country

            14.4.1.1. China

            14.4.1.2. Japan

            14.4.1.3. South Korea

            14.4.1.4. Rest of Asia Pacific

        14.4.2. By Type

        14.4.3. By Product

    14.5. Market Attractiveness Analysis

        14.5.1. By Country

        14.5.2. By Type

        14.5.3. By Product

15. Middle East and Africa Market Analysis 2017 to 2021 and Forecast 2022 to 2032

    15.1. Introduction

    15.2. Pricing Analysis

    15.3. Historical Market Value (US$ Million) Trend Analysis By Market Taxonomy, 2017 to 2021

    15.4. Market Value (US$ Million) & Forecast By Market Taxonomy, 2022 to 2032

        15.4.1. By Country

            15.4.1.1. GCC Countries

            15.4.1.2. South Africa

            15.4.1.3. Turkey

            15.4.1.4. Rest of Middle East and Africa

        15.4.2. By Type

        15.4.3. By Product

    15.5. Market Attractiveness Analysis

        15.5.1. By Country

        15.5.2. By Type

        15.5.3. By Product

16. Key Countries Market Analysis 2017 to 2021 and Forecast 2022 to 2032

    16.1. Introduction

        16.1.1. Market Value Proportion Analysis, By Key Countries

        16.1.2. Global Vs. Country Growth Comparison

    16.2. US Market Analysis

        16.2.1. Value Proportion Analysis by Market Taxonomy

        16.2.2. Value & Analysis and Forecast by Market Taxonomy, 2017 to 2032

            16.2.2.1. By Type

            16.2.2.2. By Product

    16.3. Canada Market Analysis

        16.3.1. Value Proportion Analysis by Market Taxonomy

        16.3.2. Value & Analysis and Forecast by Market Taxonomy, 2017 to 2032

            16.3.2.1. By Type

            16.3.2.2. By Product

    16.4. Mexico Market Analysis

        16.4.1. Value Proportion Analysis by Market Taxonomy

        16.4.2. Value & Analysis and Forecast by Market Taxonomy, 2017 to 2032

            16.4.2.1. By Type

            16.4.2.2. By Product

    16.5. Brazil Market Analysis

        16.5.1. Value Proportion Analysis by Market Taxonomy

        16.5.2. Value & Analysis and Forecast by Market Taxonomy, 2017 to 2032

            16.5.2.1. By Type

            16.5.2.2. By Product

    16.6. Germany Market Analysis

        16.6.1. Value Proportion Analysis by Market Taxonomy

        16.6.2. Value & Analysis and Forecast by Market Taxonomy, 2017 to 2032

            16.6.2.1. By Type

            16.6.2.2. By Product

    16.7. France Market Analysis

        16.7.1. Value Proportion Analysis by Market Taxonomy

        16.7.2. Value & Analysis and Forecast by Market Taxonomy, 2017 to 2032

            16.7.2.1. By Type

            16.7.2.2. By Product

    16.8. Italy Market Analysis

        16.8.1. Value Proportion Analysis by Market Taxonomy

        16.8.2. Value & Analysis and Forecast by Market Taxonomy, 2017 to 2032

            16.8.2.1. By Type

            16.8.2.2. By Product

    16.9. BENELUX Market Analysis

        16.9.1. Value Proportion Analysis by Market Taxonomy

        16.9.2. Value & Analysis and Forecast by Market Taxonomy, 2017 to 2032

            16.9.2.1. By Type

            16.9.2.2. By Product

    16.10. UK Market Analysis

        16.10.1. Value Proportion Analysis by Market Taxonomy

        16.10.2. Value & Analysis and Forecast by Market Taxonomy, 2017 to 2032

            16.10.2.1. By Type

            16.10.2.2. By Product

    16.11. Nordic Countries Market Analysis

        16.11.1. Value Proportion Analysis by Market Taxonomy

        16.11.2. Value & Analysis and Forecast by Market Taxonomy, 2017 to 2032

            16.11.2.1. By Type

            16.11.2.2. By Product

    16.12. China Market Analysis

        16.12.1. Value Proportion Analysis by Market Taxonomy

        16.12.2. Value & Analysis and Forecast by Market Taxonomy, 2017 to 2032

            16.12.2.1. By Type

            16.12.2.2. By Product

    16.13. Japan Market Analysis

        16.13.1. Value Proportion Analysis by Market Taxonomy

        16.13.2. Value & Analysis and Forecast by Market Taxonomy, 2017 to 2032

            16.13.2.1. By Type

            16.13.2.2. By Product

    16.14. South Korea Market Analysis

        16.14.1. Value Proportion Analysis by Market Taxonomy

        16.14.2. Value & Analysis and Forecast by Market Taxonomy, 2017 to 2032

            16.14.2.1. By Type

            16.14.2.2. By Product

    16.15. GCC Countries Market Analysis

        16.15.1. Value Proportion Analysis by Market Taxonomy

        16.15.2. Value & Analysis and Forecast by Market Taxonomy, 2017 to 2032

            16.15.2.1. By Type

            16.15.2.2. By Product

    16.16. South Africa Market Analysis

        16.16.1. Value Proportion Analysis by Market Taxonomy

        16.16.2. Value & Analysis and Forecast by Market Taxonomy, 2017 to 2032

            16.16.2.1. By Type

            16.16.2.2. By Product

    16.17. Turkey Market Analysis

        16.17.1. Value Proportion Analysis by Market Taxonomy

        16.17.2. Value & Analysis and Forecast by Market Taxonomy, 2017 to 2032

            16.17.2.1. By Type

            16.17.2.2. By Product

        16.17.3. Competition Landscape and Player Concentration in the Country

17. Market Structure Analysis

    17.1. Market Analysis by Tier of Companies

    17.2. Market Concentration

    17.3. Market Share Analysis of Top Players

    17.4. Market Presence Analysis

        17.4.1. By Regional footprint of Players

        17.4.2. Product footprint by Players

18. Competition Analysis

    18.1. Competition Dashboard

    18.2. Competition Benchmarking

    18.3. Competition Deep Dive

        18.3.1. Merck Animal Health

            18.3.1.1. Overview

            18.3.1.2. Product Portfolio

            18.3.1.3. Sales Footprint

            18.3.1.4. Strategy Overview

        18.3.2. Ceva

            18.3.2.1. Overview

            18.3.2.2. Product Portfolio

            18.3.2.3. Sales Footprint

            18.3.2.4. Strategy Overview

        18.3.3. Zoetis

            18.3.3.1. Overview

            18.3.3.2. Product Portfolio

            18.3.3.3. Sales Footprint

            18.3.3.4. Strategy Overview

        18.3.4. Boehringer Ingelheim GmbH

            18.3.4.1. Overview

            18.3.4.2. Product Portfolio

            18.3.4.3. Sales Footprint

            18.3.4.4. Strategy Overview

        18.3.5. Elanco

            18.3.5.1. Overview

            18.3.5.2. Product Portfolio

            18.3.5.3. Sales Footprint

            18.3.5.4. Strategy Overview

        18.3.6. Indian Immunologicals Ltd

            18.3.6.1. Overview

            18.3.6.2. Product Portfolio

            18.3.6.3. Sales Footprint

            18.3.6.4. Strategy Overview

        18.3.7. BiogénesisBagó

            18.3.7.1. Overview

            18.3.7.2. Product Portfolio

            18.3.7.3. Sales Footprint

            18.3.7.4. Strategy Overview

        18.3.8. Phibro Animal Health

            18.3.8.1. Overview

            18.3.8.2. Product Portfolio

            18.3.8.3. Sales Footprint

            18.3.8.4. Strategy Overview

        18.3.9. KM Biologics

            18.3.9.1. Overview

            18.3.9.2. Product Portfolio

            18.3.9.3. Sales Footprint

            18.3.9.4. Strategy Overview

        18.3.10. HIPRA

            18.3.10.1. Overview

            18.3.10.2. Product Portfolio

            18.3.10.3. Sales Footprint

            18.3.10.4. Strategy Overview

19. Assumptions and Acronyms Used

20. Research Methodology

Don't pay for what you don't need

Customize your report by selecting specific countries or regions and save 30%!

List of Tables

Table 1: Global Market Value (US$ Million), By Type, 2017 to 2021

Table 2: Global Market Value (US$ Million), By Type, 2022 to 2032

Table 3: Global Market Value (US$ Million), By Product, 2017 to 2021

Table 4: Global Market Value (US$ Million), By Product, 2022 to 2032

Table 5: Global Market, By Region, 2017 to 2021

Table 6: Global Market, By Region, 2022 to 2032

Table 7: North America Market Value (US$ Million), By Type, 2017 to 2021

Table 8: North America Market Value (US$ Million), By Type, 2022 to 2032

Table 9: North America Market Value (US$ Million), By Product, 2017 to 2021

Table 10: North America Market Value (US$ Million), By Product, 2022 to 2032

Table 11: North America Market, By Country, 2017 to 2021

Table 12: North America Market, By Country, 2022 to 2032

Table 13: Latin America Market Value (US$ Million), By Type, 2017 to 2021

Table 14: Latin America Market Value (US$ Million), By Type, 2022 to 2032

Table 15: Latin America Market Value (US$ Million), By Product, 2017 to 2021

Table 16: Latin America Market Value (US$ Million), By Product, 2022 to 2032

Table 17: Latin America Market, By Country, 2017 to 2021

Table 18: Latin America Market, By Country, 2022 to 2032

Table 19: Europe Market Value (US$ Million), By Type, 2017 to 2021

Table 20: Europe Market Value (US$ Million), By Type, 2022 to 2032

Table 21: Europe Market Value (US$ Million), By Product, 2017 to 2021

Table 22: Europe Market Value (US$ Million), By Product, 2022 to 2032

Table 23: Europe Market, By Country, 2017 to 2021

Table 24: Europe Market, By Country, 2022 to 2032

Table 25: Asia Pacific Market Value (US$ Million), By Type, 2017 to 2021

Table 26: Asia Pacific Market Value (US$ Million), By Type, 2022 to 2032

Table 27: Asia Pacific Market Value (US$ Million), By Product, 2017 to 2021

Table 28: Asia Pacific Market Value (US$ Million), By Product, 2022 to 2032

Table 29: Asia Pacific Market, By Country, 2017 to 2021

Table 30: Asia Pacific Market, By Country, 2022 to 2032

Table 31: MEA Market Value (US$ Million), By Type, 2017 to 2021

Table 32: MEA Market Value (US$ Million), By Type, 2022 to 2032

Table 33: MEA Market Value (US$ Million), By Product, 2017 to 2021

Table 34: MEA Market Value (US$ Million), By Product, 2022 to 2032

Table 35: MEA Market, By Country, 2017 to 2021

Table 36: MEA Market, By Country, 2022 to 2032

Table 37: Global Market Incremental $ Opportunity, By Type, 2017 to 2021

Table 38: Global Market Incremental $ Opportunity, By Product, 2022 to 2032

Table 39: Global Market Incremental $ Opportunity, By Region, 2022 to 2032

Table 40: North America Market Incremental $ Opportunity, By Type, 2017 to 2021

Table 41: North America Market Incremental $ Opportunity, By Product, 2022 to 2032

Table 42: North America Market Incremental $ Opportunity, By Country, 2022 to 2032

Table 43: Latin America Market Incremental $ Opportunity, By Type, 2017 to 2021

Table 44: Latin America Market Incremental $ Opportunity, By Product, 2022 to 2032

Table 45: Latin America Market Incremental $ Opportunity, By Country, 2022 to 2032

Table 46: Europe Market Incremental $ Opportunity, By Type, 2017 to 2021

Table 47: Europe Market Incremental $ Opportunity, By Product, 2022 to 2032

Table 48: Europe Market Incremental $ Opportunity, By Country, 2022 to 2032

Table 49: Asia Pacific Market Incremental $ Opportunity, By Type, 2017 to 2021

Table 50: Asia Pacific Market Incremental $ Opportunity, By Product, 2022 to 2032

Table 51: Asia Pacific Market Incremental $ Opportunity, By Country, 2022 to 2032

Table 52: MEA Market Incremental $ Opportunity, By Type, 2017 to 2021

Table 53: MEA Market Incremental $ Opportunity, By Product, 2022 to 2032

Table 54: MEA Market Incremental $ Opportunity, By Country, 2022 to 2032
Sabyasachi Ghosh
Sabyasachi Ghosh

Principal Consultant

Talk to Analyst

Find your sweet spots for generating winning opportunities in this market.

List of Charts

Figure 1: Global Market Value (US$ Million) and Year-on-Year Growth, 2017 to 2032

Figure 2: Global Market Absolute $ Historical Gain (2017 to 2021) and Opportunity (2022 to 2032), US$ Million

Figure 3: Global Market Share, By Type, 2022 to 2032

Figure 4: Global Market Y-o-Y Growth Projections, By Type - 2022 to 2032

Figure 5: Global Market Attractiveness Index, By Type - 2022 to 2032

Figure 6: Global Market Share, By Product, 2022 to 2032

Figure 7: Global Market Y-o-Y Growth Projections, By Product - 2022 to 2032

Figure 8: Global Market Attractiveness Index, By Product - 2022 to 2032

Figure 9: Global Market Share, By Region, 2022 to 2032

Figure 10: Global Market Y-o-Y Growth Projections, By Region - 2022 to 2032

Figure 11: Global Market Attractiveness Index, By Region - 2022 to 2032

Figure 12: North America Market Value (US$ Million) and Year-on-Year Growth, 2017 to 2032

Figure 13: North America Market Absolute $ Opportunity Historical (2017 to 2021) and Forecast Period (2022 to 2032), US$ Million

Figure 14: North America Market Share, By Type, 2022 to 2032

Figure 15: North America Market Y-o-Y Growth Projections, By Type - 2022 to 2032

Figure 16: North America Market Attractiveness Index, By Type - 2022 to 2032

Figure 17: North America Market Share, By Product, 2022 to 2032

Figure 18: North America Market Y-o-Y Growth Projections, By Product - 2022 to 2032

Figure 19: North America Market Attractiveness Index, By Product - 2022 to 2032

Figure 20: North America Market Share, By Country, 2022 to 2032

Figure 21: North America Market Y-o-Y Growth Projections, By Country - 2022 to 2032

Figure 22: North America Market Attractiveness Index, By Country - 2022 to 2032

Figure 23: Latin America Market Value (US$ Million) and Year-on-Year Growth, 2017 to 2032

Figure 24: Latin America Market Absolute $ Opportunity Historical (2017 to 2021) and Forecast Period (2022 to 2032), US$ Million

Figure 25: Latin America Market Share, By Type, 2022 to 2032

Figure 26: Latin America Market Y-o-Y Growth Projections, By Type - 2022 to 2032

Figure 27: Latin America Market Attractiveness Index, By Type - 2022 to 2032

Figure 28: Latin America Market Share, By Product, 2022 to 2032

Figure 29: Latin America Market Y-o-Y Growth Projections, By Product - 2022 to 2032

Figure 30: Latin America Market Attractiveness Index, By Product - 2022 to 2032

Figure 31: Latin America Market Share, By Country, 2022 to 2032

Figure 32: Latin America Market Y-o-Y Growth Projections, By Country - 2022 to 2032

Figure 33: Latin America Market Attractiveness Index, By Country - 2022 to 2032

Figure 34: Europe Market Value (US$ Million) and Year-on-Year Growth, 2017 to 2032

Figure 35: Europe Market Absolute $ Opportunity Historical (2017 to 2021) and Forecast Period (2022 to 2032), US$ Million

Figure 36: Europe Market Share, By Type, 2022 to 2032

Figure 37: Europe Market Y-o-Y Growth Projections, By Type - 2022 to 2032

Figure 38: Europe Market Attractiveness Index, By Type - 2022 to 2032

Figure 39: Europe Market Share, By Product, 2022 to 2032

Figure 40: Europe Market Y-o-Y Growth Projections, By Product - 2022 to 2032

Figure 41: Europe Market Attractiveness Index, By Product - 2022 to 2032

Figure 42: Europe Market Share, By Country, 2022 to 2032

Figure 43: Europe Market Y-o-Y Growth Projections, By Country - 2022 to 2032

Figure 44: Europe Market Attractiveness Index, By Country - 2022 to 2032

Figure 45: MEA Market Value (US$ Million) and Year-on-Year Growth, 2017 to 2032

Figure 46: MEA Market Absolute $ Opportunity Historical (2017 to 2021) and Forecast Period (2022 to 2032), US$ Million

Figure 47: MEA Market Share, By Type, 2022 to 2032

Figure 48: MEA Market Y-o-Y Growth Projections, By Type - 2022 to 2032

Figure 49: MEA Market Attractiveness Index, By Type - 2022 to 2032

Figure 50: MEA Market Share, By Product, 2022 to 2032

Figure 51: MEA Market Y-o-Y Growth Projections, By Product - 2022 to 2032

Figure 52: MEA Market Attractiveness Index, By Product - 2022 to 2032

Figure 53: MEA Market Share, By Country, 2022 to 2032

Figure 54: MEA Market Y-o-Y Growth Projections, By Country - 2022 to 2032

Figure 55: MEA Market Attractiveness Index, By Country - 2022 to 2032

Figure 56: Asia Pacific Market Value (US$ Million) and Year-on-Year Growth, 2017 to 2032

Figure 57: Asia Pacific Market Absolute $ Opportunity Historical (2017 to 2021) and Forecast Period (2022 to 2032), US$ Million

Figure 58: Asia Pacific Market Share, By Type, 2022 to 2032

Figure 59: Asia Pacific Market Y-o-Y Growth Projections, By Type - 2022 to 2032

Figure 60: Asia Pacific Market Attractiveness Index, By Type - 2022 to 2032

Figure 61: Asia Pacific Market Share, By Product, 2022 to 2032

Figure 62: Asia Pacific Market Y-o-Y Growth Projections, By Product - 2022 to 2032

Figure 63: Asia Pacific Market Attractiveness Index, By Product - 2022 to 2032

Figure 64: Asia Pacific Market Share, By Country, 2022 to 2032

Figure 65: Asia Pacific Market Y-o-Y Growth Projections, By Country - 2022 to 2032

Figure 66: Asia Pacific Market Attractiveness Index, By Country - 2022 to 2032

Figure 67: US Market Value (US$ Million) and Forecast, 2022 to 2032

Figure 68: US Market Share, By Type, 2021

Figure 69: US Market Share, By Product, 2021

Figure 70: Canada Market Value (US$ Million) and Forecast, 2022 to 2032

Figure 71: Canada Market Share, By Type, 2021

Figure 72: Canada Market Share, By Product, 2021

Figure 73: Brazil Market Value (US$ Million) and Forecast, 2022 to 2032

Figure 74: Brazil Market Share, By Type, 2021

Figure 75: Brazil Market Share, By Product, 2021

Figure 76: Mexico Market Value (US$ Million) and Forecast, 2022 to 2032

Figure 77: Mexico Market Share, By Type, 2021

Figure 78: Mexico Market Share, By Product, 2021

Figure 79: Germany Market Value (US$ Million) and Forecast, 2022 to 2032

Figure 80: Germany Market Share, By Type, 2021

Figure 81: Germany Market Share, By Product, 2021

Figure 82: UK Market Value (US$ Million) and Forecast, 2022 to 2032

Figure 83: UK Market Share, By Type, 2021

Figure 84: UK Market Share, By Product, 2021

Figure 85: France Market Value (US$ Million) and Forecast, 2022 to 2032

Figure 86: France Market Share, By Type, 2021

Figure 87: France Market Share, By Product, 2021

Figure 88: Italy Market Value (US$ Million) and Forecast, 2022 to 2032

Figure 89: Italy Market Share, By Type, 2021

Figure 90: Italy Market Share, By Product, 2021

Figure 91: BENELUX Market Value (US$ Million) and Forecast, 2022 to 2032

Figure 92: BENELUX Market Share, By Type, 2021

Figure 93: BENELUX Market Share, By Product, 2021

Figure 94: Nordic Countries Market Value (US$ Million) and Forecast, 2022 to 2032

Figure 95: Nordic Countries Market Share, By Type, 2021

Figure 96: Nordic Countries Market Share, By Product, 2021

Figure 97: China Market Value (US$ Million) and Forecast, 2022 to 2032

Figure 98: China Market Share, By Type, 2021

Figure 99: China Market Share, By Product, 2021

Figure 100: Japan Market Value (US$ Million) and Forecast, 2022 to 2032

Figure 101: Japan Market Share, By Type, 2021

Figure 102: Japan Market Share, By Product, 2021

Figure 103: South Korea Market Value (US$ Million) and Forecast, 2022 to 2032

Figure 104: South Korea Market Share, By Type, 2021

Figure 105: South Korea Market Share, By Product, 2021

Figure 106: GCC Countries Market Value (US$ Million) and Forecast, 2022 to 2032

Figure 107: GCC Countries Market Share, By Type, 2021

Figure 108: GCC Countries Market Share, By Product, 2021

Figure 109: South Africa Market Value (US$ Million) and Forecast, 2022 to 2032

Figure 110: South Africa Market Share, By Type, 2021

Figure 111: South Africa Market Share, By Product, 2021

Figure 112: Turkey Market Value (US$ Million) and Forecast, 2022 to 2032

Figure 113: Turkey Market Share, By Type, 2021

Figure 114: Turkey Market Share, By Product, 2021

Recommendations

Healthcare

Paediatric Vaccine Market

Published : September 2023

Healthcare

Swine Respiratory Diseases Treatment Market

Published : October 2022

Healthcare

Covid-19 Vaccine Development Tools Market

Published : May 2022

Healthcare

Needle-Free Vaccine Injectors Market

Published : August 2021

Explore Healthcare Insights

View Reports