Reports

- Global Locations -

Headquarters

Future Market Insights, Inc.

Christiana Corporate, 200
Continental Drive, Suite 401,
Newark, Delaware - 19713,
United States

T: +1-845-579-5705

Americas

Future Market Insights, Inc.

616 Corporate Way, Suite 2-9018,
Valley Cottage, NY 10989, United States

T: +1-347-918-3531

MEA

Future Market Insights

1602-6 Jumeirah Bay X2 Tower, Plot No: JLT-PH2-X2A,
Jumeirah Lakes Towers, Dubai,
United Arab Emirates

Europe

Future Market Insights

3rd Floor, 207 Regent Street,
W1B 3HH London
United Kingdom

T: + 44 (0) 20 8123 9659
D: +44 (0) 20 3287 4268

Asia Pacific

Future Market Insights

IndiaLand Global Tech Park, Unit UG-1, Behind Grand HighStreet, Phase 1, Hinjawadi, MH, Pune – 411057, India

Vaccines Market Outlook

The vaccines market is likely to strengthen its boundaries at an average CAGR of 6.6% during the forecast period. The market is expected to hold a value of US$ 42.7 billion in 2023 while it is anticipated to cross a value of US$ 80.8 billion by 2033.

The research report on the vaccines market explains that the Covid-19 spread turning into a full-fledged pandemic has fueled the demand for vaccines. Furthermore, governments investing huge capital in progressive healthcare systems are anticipated to expand the vaccine market size. Government healthcare programs deliver vaccines to infants to provide them with prevention from chronic diseases like tuberculosis, rotavirus, etc. The rise in new diseases like H1B1 infection, and swine flu (H1N1) is pushing the authorities to adopt new methods that help in preventing the diseases.

The vaccines market outlook states that the rising incidence of diseases worldwide is encouraging the adoption of vaccines, thereby creating prospects for the growth of the vaccines market. Deadly diseases such as tuberculosis, cancer, influenza, and pneumonia have high fatality rates, which is compelling people to opt for vaccinations. For instance, as per the World Health Organization (WHO), around 1.5 million people died from tuberculosis in 2020 while over 10 million people fell ill with TB. Additionally, increasing public awareness about the benefits of vaccination along with rising government support in research and development is likely to act as a catalyst for the growth of the vaccines market.

Attributes Details
Vaccines Market CAGR (2023 to 2033) 6.6%
Vaccines Market Size (2023) US$ 42.7 billion
Vaccines Market Size (2033) US$ 80.8 billion

Don't pay for what you don't need

Customize your report by selecting specific countries or regions and save 30%!

How is the Future Outlook (2023 to 2033)  for the Vaccines Market in Comparison to the Historical Pattern (2017 to 2022)

Short-term Growth: Factors such as the rising prevalence of chronic and infectious diseases, increase in immunization programs, advancements in vaccine technology, and changing attitudes towards vaccines are some of the key factors expected to drive the growth in the vaccines market during the forecast period.

Since their invention, vaccines have completely revolutionized the healthcare industry across the world. They have become ideal healthcare preventive products used for enhancing immunity against numerous diseases. Expansion of the prevention vaccines market and growing awareness among people in developing regions about the benefits of vaccines is likely to boost the vaccines market growth.

Mid-term Growth: The rising need for protecting children from deadly chronic and infectious diseases like tuberculosis, cancer, hepatitis, influence, etc. is expected to create lucrative opportunities for vaccine manufacturers during the forecast period. According to the United Nations Children’s Fund (UNICEF), each year vaccination saves 2 to 3 million children from deadly diseases.

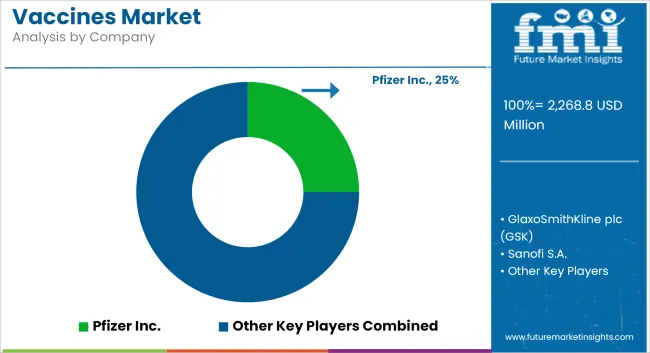
Vaccine manufacturing giants like Pfizer and GSK are vigorously investing in vaccine research and development for introducing new products with a highly effective nature. Besides this, they are holding various trials for establishing the safety and efficacy of vaccines. For instance, in January 2022, Pfizer Inc., and BioNTech SE initiated a clinical study to evaluate the safety, immunogenicity, and tolerability of an Omicron-based vaccine candidate in adults aged 18 to 55. The market is anticipated to thrive at a significant CAGR between 2022 and 2028.

Long-term Growth: Rapidly evolving technology has a profound impact on vaccine market trends. Developments like the introduction of genetic engineering and lab automation are helping vaccine manufacturers to develop low-cost vaccines, which may attract markets and eventually enable vaccine market access.

Additionally, various initiatives taken by governments of emerging nations for launching mass vaccination drives may augment the overall vaccines industry worth in the future. Global vaccine demand is anticipated to rise at 6.6% CAGR during the forecast period from 2023 and 2033.

Which Factors Are Challenging the Vaccine Market Growth?

High Capital Investments and Low Purchasing Power in Emerging Markets May Impede Market Development.

The development of vaccines is a lengthy, complicated, and expensive process. As a result, most of the vaccines are usually costlier, which is acting as a key hurdle in the growth of the vaccines market. Similarly, lack of awareness and poor healthcare infrastructure across developing regions have also hampered vaccine market access.

Sabyasachi Ghosh
Sabyasachi Ghosh

Principal Consultant

Talk to Analyst

Find your sweet spots for generating winning opportunities in this market.

Comparative View of the Vaccines Market

Vaccines Market:

Attributes Vaccines Market
CAGR (2023 to 2033) 6.6%
Market Value (2033) US$ 80.8 billion
Growth Factor Increased healthcare budget post-pandemic along with the extended research and development programs fuels the demand for the vaccines market.
Opportunity The increased opportunities are promoted through advanced DNA and RNA-based vaccines.
Key Trends The gene-based vaccines along with immunization and immunotherapy shape new trends in the market.

Influenza Vaccine Market:

Attributes Influenza Vaccine Market
CAGR (2023 to 2033) 8.8%
Market Value (2033) US$ 18.89 billion
Growth Factor The development of combination vaccines along with the development of mRNA vaccines is gaining traction in the influenza vaccine market.
Opportunity Inactivated influenza vaccine and its effective results are creating opportunities for the market.
Key Trends The rising cases of Covid-19 cases have shaped the sales of influenza vaccines globally.

Coronavirus (Covid-19) Current Therapy Market:

Attributes Coronavirus (Covid -19) Current Therapy Market
CAGR (2023 to 2033) 19.8%
Market Value (2033) US$ 150.28 million
Growth Factor Higher sales of anti-viral drugs like remdesivir and RNA-based medications are fueling the sales of coronavirus current therapy solutions.
Opportunity The increasing testing and rising awareness around Covid-19 and its implications are creating opportunities for the market
Key Trends Advanced convalescent plasma therapy is shaping trends in the coronavirus therapy market.

Vaccines Market Country-wise Insights

Regions Absolute Market Growth
United States US$ 14.8 billion
United Kingdom  US$ 1.5 billion
China  US$ 3.5 billion
Japan  US$ 2.3 billion
India US$ 1.3 billion

Which Region leads the Market in terms of Market Share?

Higher Healthcare Budget post Pandemic along with the Presence of Vaccine Giants propels the Regional Growth

United States Market CAGR (2023 to 2033) 6.6%
United States Market Absolute Doller Growth (US$ million/billion) US$ 14.8 billion

The United States is the leading market for vaccines in 2023 and is forecast to grow at a prolific CAGR over the forecast period, owing to the presence of leading vaccine manufacturers, increasing investments in research and development, continuous vaccine launches and approvals, availability of highly advanced technologies, awareness among people about latest vaccines market trends, and expansion of veterinary vaccines market. The United States market is expected to thrive at a CAGR of 6.6% between 2023 and 2033.

Similarly, the rising incidence of infectious and chronic diseases in the country has become a crucial factor in boosting vaccine market growth. According to the Centers for Disease Control and Prevention (CDC), around 6,400,000 to 11,000,000 flu illnesses cases were recorded between October 1, 2021, through May 7, 2022, in the United States.

People in the United States are spending large amounts on vaccines to make themselves immune to various diseases. Thus, growing concerns about rising cases of various infectious diseases and positive attitudes toward vaccines may significantly increase the vaccine industry worth in the future.

Furthermore, increasing government initiatives coupled with the expansion of the COVID-19 vaccine market size are expected to boost the growth of the vaccine market in the United States during the forthcoming period. The market is anticipated to reach a value of US$ 31.4 billion by 2033.

What makes China a Leading Vaccines Market in terms of CAGR?

Changing Attitudes Towards Vaccines and Favorable Government Support Creating Space for Vaccine Market Growth in China

Region Attributes
Chinese Market CAGR (2023 to 2033) 8.9%
Chinese Market Absolute Doller Growth (US$ million/billion) US$ 3.5 billion

As per FMI, the vaccines market in China is poised to exhibit strong on the back of increasing government spending for immunization programs, changing attitudes of people towards vaccinations, rise in the development of novel vaccines, the emergence of new vaccine market trends, the surge in various diseases, and expansion of meningococcal vaccines market in the country. The Chinese market is likely to expand at a CAGR of 8.9% between 2023 and 2033 while it is expected to cross a value of US$ 6.0 billion by 2033.

Furthermore, the rapidly growing population and rising health awareness among people in the country are making a conducive environment for the growth of the vaccine market.

Demand for vaccines was especially high during the COVID-19 pandemic and it is expected to continue at a steady pace during the post-pandemic period as people's attitude towards vaccines takes a positive turn.

Get the data you need at a Fraction of the cost

Personalize your report by choosing insights you need
and save 40%!

Category-wise Insights

Segment Top Vaccine Type
Top Sub-segment Subunit & Conjugate
CAGR (2017 to 2022) 5.8%
CAGR (2023 to 2033) 7.3%
Segment Route of Administration
Top Sub-segment Injectable
CAGR (2017 to 2022) 6.0%
CAGR (2023 to 2033) 6.7%

Highly Applicable for Infants, Conjugate Vaccines work on the Antigen Hiding Prospects

As per FMI, the conjugate vaccines segment accounted for the leading share of the global vaccine market by vaccine type due to increased spending by government and private companies on its development. Rising preference for conjugate vaccines is due to their various additional features including greater antibody persistence and avidity. The segment is likely to thrive at a CAGR of 7.3% between 2023 and 2033.

Growing demand for conjugate vaccines due to their ability to provide long-lasting immunity against diseases may continue to offer lucrative opportunities to vaccine manufacturers during the forecast period, thereby boosting vaccines market growth

Effective, Faster, and Efficient Route of Administration Drive Injectable Type Vaccines

Based on the route of administration, injectable (intramuscular and subcutaneous) routes are the most preferred methods used by medical professionals globally. These routes are especially ideal when larger volumes of drugs are to be administrated into the body.

Administration of drugs through the intramuscular route offers various benefits which include rapid absorption and less pain. The segment thrives at a CAGR of 6.7% between 2023 and 2033.

Competition Scenario

Leading players are continuously investing in research and development activities for introducing novel vaccines with long-term efficacy. Besides this, they are adopting growth strategies such as new product launches and approvals, partnerships, acquisitions, and strengthening of distribution channels to expand their global footprint.

Recent Market Developments

  • In 2021, MSD Pharmaceuticals, a wholly-owned subsidiary of Merck Sharp & Dohme, launched Gardasil 9, India’s first gender-neutral HPV vaccine.
  • In April 2020, the United States Food and Drug Administration (FDA), approved Sanofi’s MenQuadfi vaccine for the prevention of invasive meningococcal diseases in persons aged 2 years and older.
  • In 2021, Abbott launched a new inactivated quadrivalent vaccine for influenza in India that offers protection against four virus strains, in India.

Key Contributors to the Vaccines Market

  • Merck & Co., Inc
  • GlaxoSmithKline
  • Pfizer BioNTech
  • Sanofi SA
  • CSL Limited
  • Emergent Biosolutions Inc.
  • Johnson & Johnson (J&J)
  • AstraZeneca plc
  • Bavarian Nordic A/S
  • Mitsubishi Tanabe Pharma Corporation.
  • Out of these GSK
  • Pfizer
  • Mark
  • Sanofi

Key Segments

By Vaccine Type:

  • Inactivated
  • Live attenuated
  • Recombinant
  • Toxoid
  • Subunit & Conjugate

By Valance:

  • Monovalent
  • Multivalent

By Route of Administration:

  • Injectable
  • Oral

By Indication:

  • Influenza
  • Pneumococcal Diseases
  • Human Papillomavirus
  • Meningococcal Diseases
  • Rotavirus
  • MMR
  • Hepatitis
  • DTP
  • Polio

By Distribution Channel:

  • Hospital Pharmacies
  • Institutional Sales
  • Retail Pharmacies

By Region:

  • North America
  • Latin America
  • Europe
  • Asia Pacific (APAC)
  • The Middle East & Africa (MEA)

Frequently Asked Questions

How Big is the Vaccines Market?

The vaccines market is expected to reach US$ 42.7 billion in 2023.

What is the Anticipated CAGR of the Market?

The market is anticipated to expand at a CAGR of 6.6%.

Which Trends are Yielding Market Expansion?

The emergence of gene-based vaccines in addition to immunotherapy and immunization.

Which Opportunities are Yielding Market Expansion?

The advent of RNA and DNA-based vaccines are yielding significant opportunities.

What is the Market CAGR of China Market?

The China market is expected to expand at a CAGR of 8.9% through 2033.

Table of Content

1. Executive Summary | Vaccines Market

    1.1. Global Market Outlook

    1.2. Demand-side Trends

    1.3. Supply-side Trends

    1.4. Technology Roadmap Analysis

    1.5. Analysis and Recommendations

2. Market Overview

    2.1. Market Coverage / Taxonomy

    2.2. Market Definition / Scope / Limitations

3. Market Background

    3.1. Market Dynamics

        3.1.1. Drivers

        3.1.2. Restraints

        3.1.3. Opportunity

        3.1.4. Trends

    3.2. Scenario Forecast

        3.2.1. Demand in Optimistic Scenario

        3.2.2. Demand in Likely Scenario

        3.2.3. Demand in Conservative Scenario

    3.3. Opportunity Map Analysis

    3.4. Investment Feasibility Matrix

    3.5. PESTLE and Porter’s Analysis

    3.6. Regulatory Landscape

        3.6.1. By Key Regions

        3.6.2. By Key Countries

    3.7. Regional Parent Market Outlook

4. Global Market Analysis 2017 to 2022 and Forecast, 2023 to 2033

    4.1. Historical Market Size Value (US$ Million) Analysis, 2017 to 2022

    4.2. Current and Future Market Size Value (US$ Million) Projections, 2023 to 2033

        4.2.1. Y-o-Y Growth Trend Analysis

        4.2.2. Absolute $ Opportunity Analysis

5. Global Market Analysis 2017 to 2022 and Forecast 2023 to 2033, By Vaccine Type

    5.1. Introduction / Key Findings

    5.2. Historical Market Size Value (US$ Million) Analysis By Vaccine Type, 2017 to 2022

    5.3. Current and Future Market Size Value (US$ Million) Analysis and Forecast By Vaccine Type, 2023 to 2033

        5.3.1. Inactivated

        5.3.2. Live Attenuated

        5.3.3. Toxoid

        5.3.4. Subunit & Conjugate

        5.3.5. Others

    5.4. Y-o-Y Growth Trend Analysis By Vaccine Type, 2017 to 2022

    5.5. Absolute $ Opportunity Analysis By Vaccine Type, 2023 to 2033

6. Global Market Analysis 2017 to 2022 and Forecast 2023 to 2033, By Valance

    6.1. Introduction / Key Findings

    6.2. Historical Market Size Value (US$ Million) Analysis By Valance, 2017 to 2022

    6.3. Current and Future Market Size Value (US$ Million) Analysis and Forecast By Valance, 2023 to 2033

        6.3.1. Monovalent

        6.3.2. Multivalent

    6.4. Y-o-Y Growth Trend Analysis By Valance, 2017 to 2022

    6.5. Absolute $ Opportunity Analysis By Valance, 2023 to 2033

7. Global Market Analysis 2017 to 2022 and Forecast 2023 to 2033, By Indication

    7.1. Introduction / Key Findings

    7.2. Historical Market Size Value (US$ Million) Analysis By Indication , 2017 to 2022

    7.3. Current and Future Market Size Value (US$ Million) Analysis and Forecast By Indication , 2023 to 2033

        7.3.1. DTP

        7.3.2. Hepatitis

        7.3.3. Human Papillomavirus

        7.3.4. Influenza

        7.3.5. Meningococcal Disease

        7.3.6. MMR

        7.3.7. Pneumococcal Disease

        7.3.8. Polio

        7.3.9. Rotavirus

        7.3.10. Others

    7.4. Y-o-Y Growth Trend Analysis By Indication , 2017 to 2022

    7.5. Absolute $ Opportunity Analysis By Indication , 2023 to 2033

8. Global Market Analysis 2017 to 2022 and Forecast 2023 to 2033, By Route of Administration

    8.1. Introduction / Key Findings

    8.2. Historical Market Size Value (US$ Million) Analysis By Route of Administration, 2017 to 2022

    8.3. Current and Future Market Size Value (US$ Million) Analysis and Forecast By Route of Administration, 2023 to 2033

        8.3.1. Injectable

            8.3.1.1. Intramuscular

            8.3.1.2. Subcutaneous

        8.3.2. Oral

        8.3.3. Others

    8.4. Y-o-Y Growth Trend Analysis By Route of Administration, 2017 to 2022

    8.5. Absolute $ Opportunity Analysis By Route of Administration, 2023 to 2033

9. Global Market Analysis 2017 to 2022 and Forecast 2023 to 2033, By Distribution Channel

    9.1. Introduction / Key Findings

    9.2. Historical Market Size Value (US$ Million) Analysis By Distribution Channel, 2017 to 2022

    9.3. Current and Future Market Size Value (US$ Million) Analysis and Forecast By Distribution Channel, 2023 to 2033

        9.3.1. Hospital Pharmacies

        9.3.2. Institutional Sales

        9.3.3. Retail Pharmacies

    9.4. Y-o-Y Growth Trend Analysis By Distribution Channel, 2017 to 2022

    9.5. Absolute $ Opportunity Analysis By Distribution Channel, 2023 to 2033

10. Global Market Analysis 2017 to 2022 and Forecast 2023 to 2033, By Region

    10.1. Introduction

    10.2. Historical Market Size Value (US$ Million) Analysis By Region, 2017 to 2022

    10.3. Current Market Size Value (US$ Million) Analysis and Forecast By Region, 2023 to 2033

        10.3.1. North America

        10.3.2. Latin America

        10.3.3. Europe

        10.3.4. Asia Pacific

        10.3.5. Middle East and Africa

    10.4. Market Attractiveness Analysis By Region

11. North America Market Analysis 2017 to 2022 and Forecast 2023 to 2033, By Country

    11.1. Historical Market Size Value (US$ Million) Trend Analysis By Market Taxonomy, 2017 to 2022

    11.2. Market Size Value (US$ Million) Forecast By Market Taxonomy, 2023 to 2033

        11.2.1. By Country

            11.2.1.1. The USA

            11.2.1.2. Canada

        11.2.2. By Vaccine Type

        11.2.3. By Valance

        11.2.4. By Indication

        11.2.5. By Route of Administration

        11.2.6. By Distribution Channel

    11.3. Market Attractiveness Analysis

        11.3.1. By Country

        11.3.2. By Vaccine Type

        11.3.3. By Valance

        11.3.4. By Indication

        11.3.5. By Route of Administration

        11.3.6. By Distribution Channel

    11.4. Key Takeaways

12. Latin America Market Analysis 2017 to 2022 and Forecast 2023 to 2033, By Country

    12.1. Historical Market Size Value (US$ Million) Trend Analysis By Market Taxonomy, 2017 to 2022

    12.2. Market Size Value (US$ Million) Forecast By Market Taxonomy, 2023 to 2033

        12.2.1. By Country

            12.2.1.1. Brazil

            12.2.1.2. Mexico

            12.2.1.3. Rest of Latin America

        12.2.2. By Vaccine Type

        12.2.3. By Valance

        12.2.4. By Indication

        12.2.5. By Route of Administration

        12.2.6. By Distribution Channel

    12.3. Market Attractiveness Analysis

        12.3.1. By Country

        12.3.2. By Vaccine Type

        12.3.3. By Valance

        12.3.4. By Indication

        12.3.5. By Route of Administration

        12.3.6. By Distribution Channel

    12.4. Key Takeaways

13. Europe Market Analysis 2017 to 2022 and Forecast 2023 to 2033, By Country

    13.1. Historical Market Size Value (US$ Million) Trend Analysis By Market Taxonomy, 2017 to 2022

    13.2. Market Size Value (US$ Million) Forecast By Market Taxonomy, 2023 to 2033

        13.2.1. By Country

            13.2.1.1. Germany

            13.2.1.2. United Kingdom (UK)

            13.2.1.3. France

            13.2.1.4. Spain

            13.2.1.5. Italy

            13.2.1.6. Rest of Europe

        13.2.2. By Vaccine Type

        13.2.3. By Valance

        13.2.4. By Indication

        13.2.5. By Route of Administration

        13.2.6. By Distribution Channel

    13.3. Market Attractiveness Analysis

        13.3.1. By Country

        13.3.2. By Vaccine Type

        13.3.3. By Valance

        13.3.4. By Indication

        13.3.5. By Route of Administration

        13.3.6. By Distribution Channel

    13.4. Key Takeaways

14. Asia Pacific Market Analysis 2017 to 2022 and Forecast 2023 to 2033, By Country

    14.1. Historical Market Size Value (US$ Million) Trend Analysis By Market Taxonomy, 2017 to 2022

    14.2. Market Size Value (US$ Million) Forecast By Market Taxonomy, 2023 to 2033

        14.2.1. By Country

            14.2.1.1. China

            14.2.1.2. India

            14.2.1.3. Thailand

            14.2.1.4. Singapore

            14.2.1.5. Australia

            14.2.1.6. Rest of Asia Pacific

        14.2.2. By Vaccine Type

        14.2.3. By Valance

        14.2.4. By Indication

        14.2.5. By Route of Administration

        14.2.6. By Distribution Channel

    14.3. Market Attractiveness Analysis

        14.3.1. By Country

        14.3.2. By Vaccine Type

        14.3.3. By Valance

        14.3.4. By Indication

        14.3.5. By Route of Administration

        14.3.6. By Distribution Channel

    14.4. Key Takeaways

15. Middle East and Africa Market Analysis 2017 to 2022 and Forecast 2023 to 2033, By Country

    15.1. Historical Market Size Value (US$ Million) Trend Analysis By Market Taxonomy, 2017 to 2022

    15.2. Market Size Value (US$ Million) Forecast By Market Taxonomy, 2023 to 2033

        15.2.1. By Country

            15.2.1.1. GCC Countries

            15.2.1.2. South Africa

            15.2.1.3. Israel

            15.2.1.4. Rest of Middle East and Africa

        15.2.2. By Vaccine Type

        15.2.3. By Valance

        15.2.4. By Indication

        15.2.5. By Route of Administration

        15.2.6. By Distribution Channel

    15.3. Market Attractiveness Analysis

        15.3.1. By Country

        15.3.2. By Vaccine Type

        15.3.3. By Valance

        15.3.4. By Indication

        15.3.5. By Route of Administration

        15.3.6. By Distribution Channel

    15.4. Key Takeaways

16. Key Countries Market Analysis

    16.1. USA

        16.1.1. Pricing Analysis

        16.1.2. Market Share Analysis, 2022

            16.1.2.1. By Vaccine Type

            16.1.2.2. By Valance

            16.1.2.3. By Indication

            16.1.2.4. By Route of Administration

            16.1.2.5. By Distribution Channel

    16.2. Canada

        16.2.1. Pricing Analysis

        16.2.2. Market Share Analysis, 2022

            16.2.2.1. By Vaccine Type

            16.2.2.2. By Valance

            16.2.2.3. By Indication

            16.2.2.4. By Route of Administration

            16.2.2.5. By Distribution Channel

    16.3. Brazil

        16.3.1. Pricing Analysis

        16.3.2. Market Share Analysis, 2022

            16.3.2.1. By Vaccine Type

            16.3.2.2. By Valance

            16.3.2.3. By Indication

            16.3.2.4. By Route of Administration

            16.3.2.5. By Distribution Channel

    16.4. Mexico

        16.4.1. Pricing Analysis

        16.4.2. Market Share Analysis, 2022

            16.4.2.1. By Vaccine Type

            16.4.2.2. By Valance

            16.4.2.3. By Indication

            16.4.2.4. By Route of Administration

            16.4.2.5. By Distribution Channel

    16.5. Germany

        16.5.1. Pricing Analysis

        16.5.2. Market Share Analysis, 2022

            16.5.2.1. By Vaccine Type

            16.5.2.2. By Valance

            16.5.2.3. By Indication

            16.5.2.4. By Route of Administration

            16.5.2.5. By Distribution Channel

    16.6. UK

        16.6.1. Pricing Analysis

        16.6.2. Market Share Analysis, 2022

            16.6.2.1. By Vaccine Type

            16.6.2.2. By Valance

            16.6.2.3. By Indication

            16.6.2.4. By Route of Administration

            16.6.2.5. By Distribution Channel

    16.7. France

        16.7.1. Pricing Analysis

        16.7.2. Market Share Analysis, 2022

            16.7.2.1. By Vaccine Type

            16.7.2.2. By Valance

            16.7.2.3. By Indication

            16.7.2.4. By Route of Administration

            16.7.2.5. By Distribution Channel

    16.8. Spain

        16.8.1. Pricing Analysis

        16.8.2. Market Share Analysis, 2022

            16.8.2.1. By Vaccine Type

            16.8.2.2. By Valance

            16.8.2.3. By Indication

            16.8.2.4. By Route of Administration

            16.8.2.5. By Distribution Channel

    16.9. Italy

        16.9.1. Pricing Analysis

        16.9.2. Market Share Analysis, 2022

            16.9.2.1. By Vaccine Type

            16.9.2.2. By Valance

            16.9.2.3. By Indication

            16.9.2.4. By Route of Administration

            16.9.2.5. By Distribution Channel

    16.10. China

        16.10.1. Pricing Analysis

        16.10.2. Market Share Analysis, 2022

            16.10.2.1. By Vaccine Type

            16.10.2.2. By Valance

            16.10.2.3. By Indication

            16.10.2.4. By Route of Administration

            16.10.2.5. By Distribution Channel

    16.11. India

        16.11.1. Pricing Analysis

        16.11.2. Market Share Analysis, 2022

            16.11.2.1. By Vaccine Type

            16.11.2.2. By Valance

            16.11.2.3. By Indication

            16.11.2.4. By Route of Administration

            16.11.2.5. By Distribution Channel

    16.12. Thailand

        16.12.1. Pricing Analysis

        16.12.2. Market Share Analysis, 2022

            16.12.2.1. By Vaccine Type

            16.12.2.2. By Valance

            16.12.2.3. By Indication

            16.12.2.4. By Route of Administration

            16.12.2.5. By Distribution Channel

    16.13. Singapore

        16.13.1. Pricing Analysis

        16.13.2. Market Share Analysis, 2022

            16.13.2.1. By Vaccine Type

            16.13.2.2. By Valance

            16.13.2.3. By Indication

            16.13.2.4. By Route of Administration

            16.13.2.5. By Distribution Channel

    16.14. Australia

        16.14.1. Pricing Analysis

        16.14.2. Market Share Analysis, 2022

            16.14.2.1. By Vaccine Type

            16.14.2.2. By Valance

            16.14.2.3. By Indication

            16.14.2.4. By Route of Administration

            16.14.2.5. By Distribution Channel

    16.15. GCC Countries

        16.15.1. Pricing Analysis

        16.15.2. Market Share Analysis, 2022

            16.15.2.1. By Vaccine Type

            16.15.2.2. By Valance

            16.15.2.3. By Indication

            16.15.2.4. By Route of Administration

            16.15.2.5. By Distribution Channel

    16.16. South Africa

        16.16.1. Pricing Analysis

        16.16.2. Market Share Analysis, 2022

            16.16.2.1. By Vaccine Type

            16.16.2.2. By Valance

            16.16.2.3. By Indication

            16.16.2.4. By Route of Administration

            16.16.2.5. By Distribution Channel

    16.17. Israel

        16.17.1. Pricing Analysis

        16.17.2. Market Share Analysis, 2022

            16.17.2.1. By Vaccine Type

            16.17.2.2. By Valance

            16.17.2.3. By Indication

            16.17.2.4. By Route of Administration

            16.17.2.5. By Distribution Channel

17. Market Structure Analysis

    17.1. Competition Dashboard

    17.2. Competition Benchmarking

    17.3. Market Share Analysis of Top Players

        17.3.1. By Regional

        17.3.2. By Vaccine Type

        17.3.3. By Valance

        17.3.4. By Indication

        17.3.5. By Route of Administration

        17.3.6. By Distribution Channel

18. Competition Analysis

    18.1. Competition Deep Dive

        18.1.1. Sanofi SA

            18.1.1.1. Overview

            18.1.1.2. Product Portfolio

            18.1.1.3. Profitability by Market Segments

            18.1.1.4. Sales Footprint

            18.1.1.5. Strategy Overview

                18.1.1.5.1. Marketing Strategy

        18.1.2. Merck & Co., Inc

            18.1.2.1. Overview

            18.1.2.2. Product Portfolio

            18.1.2.3. Profitability by Market Segments

            18.1.2.4. Sales Footprint

            18.1.2.5. Strategy Overview

                18.1.2.5.1. Marketing Strategy

        18.1.3. Pfizer BioNTech

            18.1.3.1. Overview

            18.1.3.2. Product Portfolio

            18.1.3.3. Profitability by Market Segments

            18.1.3.4. Sales Footprint

            18.1.3.5. Strategy Overview

                18.1.3.5.1. Marketing Strategy

        18.1.4. CSL Limited

            18.1.4.1. Overview

            18.1.4.2. Product Portfolio

            18.1.4.3. Profitability by Market Segments

            18.1.4.4. Sales Footprint

            18.1.4.5. Strategy Overview

                18.1.4.5.1. Marketing Strategy

        18.1.5. Johnson & Johnson

            18.1.5.1. Overview

            18.1.5.2. Product Portfolio

            18.1.5.3. Profitability by Market Segments

            18.1.5.4. Sales Footprint

            18.1.5.5. Strategy Overview

                18.1.5.5.1. Marketing Strategy

        18.1.6. Emergent Biosolutions Inc.

            18.1.6.1. Overview

            18.1.6.2. Product Portfolio

            18.1.6.3. Profitability by Market Segments

            18.1.6.4. Sales Footprint

            18.1.6.5. Strategy Overview

                18.1.6.5.1. Marketing Strategy

        18.1.7. AstraZeneca plc

            18.1.7.1. Overview

            18.1.7.2. Product Portfolio

            18.1.7.3. Profitability by Market Segments

            18.1.7.4. Sales Footprint

            18.1.7.5. Strategy Overview

                18.1.7.5.1. Marketing Strategy

        18.1.8. Bavarian Nordic A/S

            18.1.8.1. Overview

            18.1.8.2. Product Portfolio

            18.1.8.3. Profitability by Market Segments

            18.1.8.4. Sales Footprint

            18.1.8.5. Strategy Overview

                18.1.8.5.1. Marketing Strategy

        18.1.9. Mitsubishi Tanabe Pharma Corporation

            18.1.9.1. Overview

            18.1.9.2. Product Portfolio

            18.1.9.3. Profitability by Market Segments

            18.1.9.4. Sales Footprint

            18.1.9.5. Strategy Overview

                18.1.9.5.1. Marketing Strategy

        18.1.10. Serum Institute of India Pvt. Ltd.

            18.1.10.1. Overview

            18.1.10.2. Product Portfolio

            18.1.10.3. Profitability by Market Segments

            18.1.10.4. Sales Footprint

            18.1.10.5. Strategy Overview

                18.1.10.5.1. Marketing Strategy

19. Assumptions & Acronyms Used

20. Research Methodology

Don't pay for what you don't need

Customize your report by selecting specific countries or regions and save 30%!

List of Tables

Table 1: Global Market Value (US$ Million) Forecast by Region, 2017 to 2033

Table 2: Global Market Value (US$ Million) Forecast by Vaccine Type, 2017 to 2033

Table 3: Global Market Value (US$ Million) Forecast by Valance, 2017 to 2033

Table 4: Global Market Value (US$ Million) Forecast by Indication , 2017 to 2033

Table 5: Global Market Value (US$ Million) Forecast by Route of Administration, 2017 to 2033

Table 6: Global Market Value (US$ Million) Forecast by Distribution Channel, 2017 to 2033

Table 7: North America Market Value (US$ Million) Forecast by Country, 2017 to 2033

Table 8: North America Market Value (US$ Million) Forecast by Vaccine Type, 2017 to 2033

Table 9: North America Market Value (US$ Million) Forecast by Valance, 2017 to 2033

Table 10: North America Market Value (US$ Million) Forecast by Indication , 2017 to 2033

Table 11: North America Market Value (US$ Million) Forecast by Route of Administration, 2017 to 2033

Table 12: North America Market Value (US$ Million) Forecast by Distribution Channel, 2017 to 2033

Table 13: Latin America Market Value (US$ Million) Forecast by Country, 2017 to 2033

Table 14: Latin America Market Value (US$ Million) Forecast by Vaccine Type, 2017 to 2033

Table 15: Latin America Market Value (US$ Million) Forecast by Valance, 2017 to 2033

Table 16: Latin America Market Value (US$ Million) Forecast by Indication , 2017 to 2033

Table 17: Latin America Market Value (US$ Million) Forecast by Route of Administration, 2017 to 2033

Table 18: Latin America Market Value (US$ Million) Forecast by Distribution Channel, 2017 to 2033

Table 19: Europe Market Value (US$ Million) Forecast by Country, 2017 to 2033

Table 20: Europe Market Value (US$ Million) Forecast by Vaccine Type, 2017 to 2033

Table 21: Europe Market Value (US$ Million) Forecast by Valance, 2017 to 2033

Table 22: Europe Market Value (US$ Million) Forecast by Indication , 2017 to 2033

Table 23: Europe Market Value (US$ Million) Forecast by Route of Administration, 2017 to 2033

Table 24: Europe Market Value (US$ Million) Forecast by Distribution Channel, 2017 to 2033

Table 25: Asia Pacific Market Value (US$ Million) Forecast by Country, 2017 to 2033

Table 26: Asia Pacific Market Value (US$ Million) Forecast by Vaccine Type, 2017 to 2033

Table 27: Asia Pacific Market Value (US$ Million) Forecast by Valance, 2017 to 2033

Table 28: Asia Pacific Market Value (US$ Million) Forecast by Indication , 2017 to 2033

Table 29: Asia Pacific Market Value (US$ Million) Forecast by Route of Administration, 2017 to 2033

Table 30: Asia Pacific Market Value (US$ Million) Forecast by Distribution Channel, 2017 to 2033

Table 31: Middle East and Africa Market Value (US$ Million) Forecast by Country, 2017 to 2033

Table 32: Middle East and Africa Market Value (US$ Million) Forecast by Vaccine Type, 2017 to 2033

Table 33: Middle East and Africa Market Value (US$ Million) Forecast by Valance, 2017 to 2033

Table 34: Middle East and Africa Market Value (US$ Million) Forecast by Indication , 2017 to 2033

Table 35: Middle East and Africa Market Value (US$ Million) Forecast by Route of Administration, 2017 to 2033

Table 36: Middle East and Africa Market Value (US$ Million) Forecast by Distribution Channel, 2017 to 2033
Sabyasachi Ghosh
Sabyasachi Ghosh

Principal Consultant

Talk to Analyst

Find your sweet spots for generating winning opportunities in this market.

List of Charts

Figure 1: Global Market Value (US$ Million) by Vaccine Type, 2023 to 2033

Figure 2: Global Market Value (US$ Million) by Valance, 2023 to 2033

Figure 3: Global Market Value (US$ Million) by Indication , 2023 to 2033

Figure 4: Global Market Value (US$ Million) by Route of Administration, 2023 to 2033

Figure 5: Global Market Value (US$ Million) by Distribution Channel, 2023 to 2033

Figure 6: Global Market Value (US$ Million) by Region, 2023 to 2033

Figure 7: Global Market Value (US$ Million) Analysis by Region, 2017 to 2033

Figure 8: Global Market Value Share (%) and BPS Analysis by Region, 2023 to 2033

Figure 9: Global Market Y-o-Y Growth (%) Projections by Region, 2023 to 2033

Figure 10: Global Market Value (US$ Million) Analysis by Vaccine Type, 2017 to 2033

Figure 11: Global Market Value Share (%) and BPS Analysis by Vaccine Type, 2023 to 2033

Figure 12: Global Market Y-o-Y Growth (%) Projections by Vaccine Type, 2023 to 2033

Figure 13: Global Market Value (US$ Million) Analysis by Valance, 2017 to 2033

Figure 14: Global Market Value Share (%) and BPS Analysis by Valance, 2023 to 2033

Figure 15: Global Market Y-o-Y Growth (%) Projections by Valance, 2023 to 2033

Figure 16: Global Market Value (US$ Million) Analysis by Indication , 2017 to 2033

Figure 17: Global Market Value Share (%) and BPS Analysis by Indication , 2023 to 2033

Figure 18: Global Market Y-o-Y Growth (%) Projections by Indication , 2023 to 2033

Figure 19: Global Market Value (US$ Million) Analysis by Route of Administration, 2017 to 2033

Figure 20: Global Market Value Share (%) and BPS Analysis by Route of Administration, 2023 to 2033

Figure 21: Global Market Y-o-Y Growth (%) Projections by Route of Administration, 2023 to 2033

Figure 22: Global Market Value (US$ Million) Analysis by Distribution Channel, 2017 to 2033

Figure 23: Global Market Value Share (%) and BPS Analysis by Distribution Channel, 2023 to 2033

Figure 24: Global Market Y-o-Y Growth (%) Projections by Distribution Channel, 2023 to 2033

Figure 25: Global Market Attractiveness by Vaccine Type, 2023 to 2033

Figure 26: Global Market Attractiveness by Valance, 2023 to 2033

Figure 27: Global Market Attractiveness by Indication , 2023 to 2033

Figure 28: Global Market Attractiveness by Route of Administration, 2023 to 2033

Figure 29: Global Market Attractiveness by Distribution Channel, 2023 to 2033

Figure 30: Global Market Attractiveness by Region, 2023 to 2033

Figure 31: North America Market Value (US$ Million) by Vaccine Type, 2023 to 2033

Figure 32: North America Market Value (US$ Million) by Valance, 2023 to 2033

Figure 33: North America Market Value (US$ Million) by Indication , 2023 to 2033

Figure 34: North America Market Value (US$ Million) by Route of Administration, 2023 to 2033

Figure 35: North America Market Value (US$ Million) by Distribution Channel, 2023 to 2033

Figure 36: North America Market Value (US$ Million) by Country, 2023 to 2033

Figure 37: North America Market Value (US$ Million) Analysis by Country, 2017 to 2033

Figure 38: North America Market Value Share (%) and BPS Analysis by Country, 2023 to 2033

Figure 39: North America Market Y-o-Y Growth (%) Projections by Country, 2023 to 2033

Figure 40: North America Market Value (US$ Million) Analysis by Vaccine Type, 2017 to 2033

Figure 41: North America Market Value Share (%) and BPS Analysis by Vaccine Type, 2023 to 2033

Figure 42: North America Market Y-o-Y Growth (%) Projections by Vaccine Type, 2023 to 2033

Figure 43: North America Market Value (US$ Million) Analysis by Valance, 2017 to 2033

Figure 44: North America Market Value Share (%) and BPS Analysis by Valance, 2023 to 2033

Figure 45: North America Market Y-o-Y Growth (%) Projections by Valance, 2023 to 2033

Figure 46: North America Market Value (US$ Million) Analysis by Indication , 2017 to 2033

Figure 47: North America Market Value Share (%) and BPS Analysis by Indication , 2023 to 2033

Figure 48: North America Market Y-o-Y Growth (%) Projections by Indication , 2023 to 2033

Figure 49: North America Market Value (US$ Million) Analysis by Route of Administration, 2017 to 2033

Figure 50: North America Market Value Share (%) and BPS Analysis by Route of Administration, 2023 to 2033

Figure 51: North America Market Y-o-Y Growth (%) Projections by Route of Administration, 2023 to 2033

Figure 52: North America Market Value (US$ Million) Analysis by Distribution Channel, 2017 to 2033

Figure 53: North America Market Value Share (%) and BPS Analysis by Distribution Channel, 2023 to 2033

Figure 54: North America Market Y-o-Y Growth (%) Projections by Distribution Channel, 2023 to 2033

Figure 55: North America Market Attractiveness by Vaccine Type, 2023 to 2033

Figure 56: North America Market Attractiveness by Valance, 2023 to 2033

Figure 57: North America Market Attractiveness by Indication , 2023 to 2033

Figure 58: North America Market Attractiveness by Route of Administration, 2023 to 2033

Figure 59: North America Market Attractiveness by Distribution Channel, 2023 to 2033

Figure 60: North America Market Attractiveness by Country, 2023 to 2033

Figure 61: Latin America Market Value (US$ Million) by Vaccine Type, 2023 to 2033

Figure 62: Latin America Market Value (US$ Million) by Valance, 2023 to 2033

Figure 63: Latin America Market Value (US$ Million) by Indication , 2023 to 2033

Figure 64: Latin America Market Value (US$ Million) by Route of Administration, 2023 to 2033

Figure 65: Latin America Market Value (US$ Million) by Distribution Channel, 2023 to 2033

Figure 66: Latin America Market Value (US$ Million) by Country, 2023 to 2033

Figure 67: Latin America Market Value (US$ Million) Analysis by Country, 2017 to 2033

Figure 68: Latin America Market Value Share (%) and BPS Analysis by Country, 2023 to 2033

Figure 69: Latin America Market Y-o-Y Growth (%) Projections by Country, 2023 to 2033

Figure 70: Latin America Market Value (US$ Million) Analysis by Vaccine Type, 2017 to 2033

Figure 71: Latin America Market Value Share (%) and BPS Analysis by Vaccine Type, 2023 to 2033

Figure 72: Latin America Market Y-o-Y Growth (%) Projections by Vaccine Type, 2023 to 2033

Figure 73: Latin America Market Value (US$ Million) Analysis by Valance, 2017 to 2033

Figure 74: Latin America Market Value Share (%) and BPS Analysis by Valance, 2023 to 2033

Figure 75: Latin America Market Y-o-Y Growth (%) Projections by Valance, 2023 to 2033

Figure 76: Latin America Market Value (US$ Million) Analysis by Indication , 2017 to 2033

Figure 77: Latin America Market Value Share (%) and BPS Analysis by Indication , 2023 to 2033

Figure 78: Latin America Market Y-o-Y Growth (%) Projections by Indication , 2023 to 2033

Figure 79: Latin America Market Value (US$ Million) Analysis by Route of Administration, 2017 to 2033

Figure 80: Latin America Market Value Share (%) and BPS Analysis by Route of Administration, 2023 to 2033

Figure 81: Latin America Market Y-o-Y Growth (%) Projections by Route of Administration, 2023 to 2033

Figure 82: Latin America Market Value (US$ Million) Analysis by Distribution Channel, 2017 to 2033

Figure 83: Latin America Market Value Share (%) and BPS Analysis by Distribution Channel, 2023 to 2033

Figure 84: Latin America Market Y-o-Y Growth (%) Projections by Distribution Channel, 2023 to 2033

Figure 85: Latin America Market Attractiveness by Vaccine Type, 2023 to 2033

Figure 86: Latin America Market Attractiveness by Valance, 2023 to 2033

Figure 87: Latin America Market Attractiveness by Indication , 2023 to 2033

Figure 88: Latin America Market Attractiveness by Route of Administration, 2023 to 2033

Figure 89: Latin America Market Attractiveness by Distribution Channel, 2023 to 2033

Figure 90: Latin America Market Attractiveness by Country, 2023 to 2033

Figure 91: Europe Market Value (US$ Million) by Vaccine Type, 2023 to 2033

Figure 92: Europe Market Value (US$ Million) by Valance, 2023 to 2033

Figure 93: Europe Market Value (US$ Million) by Indication , 2023 to 2033

Figure 94: Europe Market Value (US$ Million) by Route of Administration, 2023 to 2033

Figure 95: Europe Market Value (US$ Million) by Distribution Channel, 2023 to 2033

Figure 96: Europe Market Value (US$ Million) by Country, 2023 to 2033

Figure 97: Europe Market Value (US$ Million) Analysis by Country, 2017 to 2033

Figure 98: Europe Market Value Share (%) and BPS Analysis by Country, 2023 to 2033

Figure 99: Europe Market Y-o-Y Growth (%) Projections by Country, 2023 to 2033

Figure 100: Europe Market Value (US$ Million) Analysis by Vaccine Type, 2017 to 2033

Figure 101: Europe Market Value Share (%) and BPS Analysis by Vaccine Type, 2023 to 2033

Figure 102: Europe Market Y-o-Y Growth (%) Projections by Vaccine Type, 2023 to 2033

Figure 103: Europe Market Value (US$ Million) Analysis by Valance, 2017 to 2033

Figure 104: Europe Market Value Share (%) and BPS Analysis by Valance, 2023 to 2033

Figure 105: Europe Market Y-o-Y Growth (%) Projections by Valance, 2023 to 2033

Figure 106: Europe Market Value (US$ Million) Analysis by Indication , 2017 to 2033

Figure 107: Europe Market Value Share (%) and BPS Analysis by Indication , 2023 to 2033

Figure 108: Europe Market Y-o-Y Growth (%) Projections by Indication , 2023 to 2033

Figure 109: Europe Market Value (US$ Million) Analysis by Route of Administration, 2017 to 2033

Figure 110: Europe Market Value Share (%) and BPS Analysis by Route of Administration, 2023 to 2033

Figure 111: Europe Market Y-o-Y Growth (%) Projections by Route of Administration, 2023 to 2033

Figure 112: Europe Market Value (US$ Million) Analysis by Distribution Channel, 2017 to 2033

Figure 113: Europe Market Value Share (%) and BPS Analysis by Distribution Channel, 2023 to 2033

Figure 114: Europe Market Y-o-Y Growth (%) Projections by Distribution Channel, 2023 to 2033

Figure 115: Europe Market Attractiveness by Vaccine Type, 2023 to 2033

Figure 116: Europe Market Attractiveness by Valance, 2023 to 2033

Figure 117: Europe Market Attractiveness by Indication , 2023 to 2033

Figure 118: Europe Market Attractiveness by Route of Administration, 2023 to 2033

Figure 119: Europe Market Attractiveness by Distribution Channel, 2023 to 2033

Figure 120: Europe Market Attractiveness by Country, 2023 to 2033

Figure 121: Asia Pacific Market Value (US$ Million) by Vaccine Type, 2023 to 2033

Figure 122: Asia Pacific Market Value (US$ Million) by Valance, 2023 to 2033

Figure 123: Asia Pacific Market Value (US$ Million) by Indication , 2023 to 2033

Figure 124: Asia Pacific Market Value (US$ Million) by Route of Administration, 2023 to 2033

Figure 125: Asia Pacific Market Value (US$ Million) by Distribution Channel, 2023 to 2033

Figure 126: Asia Pacific Market Value (US$ Million) by Country, 2023 to 2033

Figure 127: Asia Pacific Market Value (US$ Million) Analysis by Country, 2017 to 2033

Figure 128: Asia Pacific Market Value Share (%) and BPS Analysis by Country, 2023 to 2033

Figure 129: Asia Pacific Market Y-o-Y Growth (%) Projections by Country, 2023 to 2033

Figure 130: Asia Pacific Market Value (US$ Million) Analysis by Vaccine Type, 2017 to 2033

Figure 131: Asia Pacific Market Value Share (%) and BPS Analysis by Vaccine Type, 2023 to 2033

Figure 132: Asia Pacific Market Y-o-Y Growth (%) Projections by Vaccine Type, 2023 to 2033

Figure 133: Asia Pacific Market Value (US$ Million) Analysis by Valance, 2017 to 2033

Figure 134: Asia Pacific Market Value Share (%) and BPS Analysis by Valance, 2023 to 2033

Figure 135: Asia Pacific Market Y-o-Y Growth (%) Projections by Valance, 2023 to 2033

Figure 136: Asia Pacific Market Value (US$ Million) Analysis by Indication , 2017 to 2033

Figure 137: Asia Pacific Market Value Share (%) and BPS Analysis by Indication , 2023 to 2033

Figure 138: Asia Pacific Market Y-o-Y Growth (%) Projections by Indication , 2023 to 2033

Figure 139: Asia Pacific Market Value (US$ Million) Analysis by Route of Administration, 2017 to 2033

Figure 140: Asia Pacific Market Value Share (%) and BPS Analysis by Route of Administration, 2023 to 2033

Figure 141: Asia Pacific Market Y-o-Y Growth (%) Projections by Route of Administration, 2023 to 2033

Figure 142: Asia Pacific Market Value (US$ Million) Analysis by Distribution Channel, 2017 to 2033

Figure 143: Asia Pacific Market Value Share (%) and BPS Analysis by Distribution Channel, 2023 to 2033

Figure 144: Asia Pacific Market Y-o-Y Growth (%) Projections by Distribution Channel, 2023 to 2033

Figure 145: Asia Pacific Market Attractiveness by Vaccine Type, 2023 to 2033

Figure 146: Asia Pacific Market Attractiveness by Valance, 2023 to 2033

Figure 147: Asia Pacific Market Attractiveness by Indication , 2023 to 2033

Figure 148: Asia Pacific Market Attractiveness by Route of Administration, 2023 to 2033

Figure 149: Asia Pacific Market Attractiveness by Distribution Channel, 2023 to 2033

Figure 150: Asia Pacific Market Attractiveness by Country, 2023 to 2033

Figure 151: Middle East and Africa Market Value (US$ Million) by Vaccine Type, 2023 to 2033

Figure 152: Middle East and Africa Market Value (US$ Million) by Valance, 2023 to 2033

Figure 153: Middle East and Africa Market Value (US$ Million) by Indication , 2023 to 2033

Figure 154: Middle East and Africa Market Value (US$ Million) by Route of Administration, 2023 to 2033

Figure 155: Middle East and Africa Market Value (US$ Million) by Distribution Channel, 2023 to 2033

Figure 156: Middle East and Africa Market Value (US$ Million) by Country, 2023 to 2033

Figure 157: Middle East and Africa Market Value (US$ Million) Analysis by Country, 2017 to 2033

Figure 158: Middle East and Africa Market Value Share (%) and BPS Analysis by Country, 2023 to 2033

Figure 159: Middle East and Africa Market Y-o-Y Growth (%) Projections by Country, 2023 to 2033

Figure 160: Middle East and Africa Market Value (US$ Million) Analysis by Vaccine Type, 2017 to 2033

Figure 161: Middle East and Africa Market Value Share (%) and BPS Analysis by Vaccine Type, 2023 to 2033

Figure 162: Middle East and Africa Market Y-o-Y Growth (%) Projections by Vaccine Type, 2023 to 2033

Figure 163: Middle East and Africa Market Value (US$ Million) Analysis by Valance, 2017 to 2033

Figure 164: Middle East and Africa Market Value Share (%) and BPS Analysis by Valance, 2023 to 2033

Figure 165: Middle East and Africa Market Y-o-Y Growth (%) Projections by Valance, 2023 to 2033

Figure 166: Middle East and Africa Market Value (US$ Million) Analysis by Indication , 2017 to 2033

Figure 167: Middle East and Africa Market Value Share (%) and BPS Analysis by Indication , 2023 to 2033

Figure 168: Middle East and Africa Market Y-o-Y Growth (%) Projections by Indication , 2023 to 2033

Figure 169: Middle East and Africa Market Value (US$ Million) Analysis by Route of Administration, 2017 to 2033

Figure 170: Middle East and Africa Market Value Share (%) and BPS Analysis by Route of Administration, 2023 to 2033

Figure 171: Middle East and Africa Market Y-o-Y Growth (%) Projections by Route of Administration, 2023 to 2033

Figure 172: Middle East and Africa Market Value (US$ Million) Analysis by Distribution Channel, 2017 to 2033

Figure 173: Middle East and Africa Market Value Share (%) and BPS Analysis by Distribution Channel, 2023 to 2033

Figure 174: Middle East and Africa Market Y-o-Y Growth (%) Projections by Distribution Channel, 2023 to 2033

Figure 175: Middle East and Africa Market Attractiveness by Vaccine Type, 2023 to 2033

Figure 176: Middle East and Africa Market Attractiveness by Valance, 2023 to 2033

Figure 177: Middle East and Africa Market Attractiveness by Indication , 2023 to 2033

Figure 178: Middle East and Africa Market Attractiveness by Route of Administration, 2023 to 2033

Figure 179: Middle East and Africa Market Attractiveness by Distribution Channel, 2023 to 2033

Figure 180: Middle East and Africa Market Attractiveness by Country, 2023 to 2033

Recommendations

Healthcare

Anti-Infective Vaccines Market

Published : December 2022

Healthcare

Meningococcal Vaccines Market

Published : July 2022

Explore Healthcare Insights

View Reports