Reports

- Global Locations -

Headquarters

Future Market Insights, Inc.

Christiana Corporate, 200
Continental Drive, Suite 401,
Newark, Delaware - 19713,
United States

T: +1-845-579-5705

Americas

Future Market Insights, Inc.

616 Corporate Way, Suite 2-9018,
Valley Cottage, NY 10989, United States

T: +1-347-918-3531

MEA

Future Market Insights

1602-6 Jumeirah Bay X2 Tower, Plot No: JLT-PH2-X2A,
Jumeirah Lakes Towers, Dubai,
United Arab Emirates

Europe

Future Market Insights

3rd Floor, 207 Regent Street,
W1B 3HH London
United Kingdom

T: + 44 (0) 20 8123 9659
D: +44 (0) 20 3287 4268

Asia Pacific

Future Market Insights

IndiaLand Global Tech Park, Unit UG-1, Behind Grand HighStreet, Phase 1, Hinjawadi, MH, Pune – 411057, India

Inflammatory Bowel Disease Treatment Outlook (2022 to 2032)

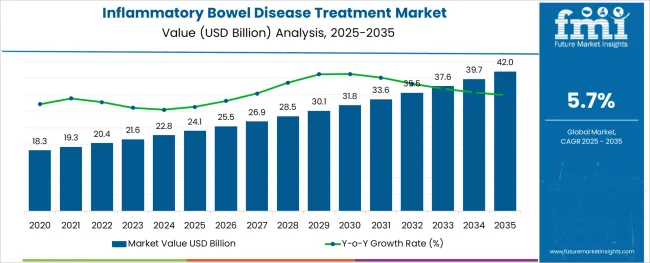
In 2021, the Global Inflammatory Bowel Disease Treatment market was worth around US$ 19.3 Billion. With the increasing expenditure incurred on Inflammatory Bowel Disease Treatment worldwide, the market is expected to reach a worth of about US$ 35.1 Billion by the end of 2032, with a projected CAGR of 5.7% from 2022 to 2032. From 2017 to 2021, the Inflammatory Bowel Disease Treatment Market experienced a growth of 4.7%.

Attributes Details
Global Inflammatory Bowel Disease Treatment Market Size (2021) US$ 19.3 Billion
Global Inflammatory Bowel Disease Treatment Market Size (2022) US$ 20.2 Billion
Projected Market Value (2032) US$ 35.1 Billion
Global Market Growth Rate (2022 to 2032) 5.7% CAGR
United States Growth Rate (2022 to 2032) 6.4% CAGR
Share of Top 5 Countries 61%
Key Companies Profiled
  • AbbVie Inc.
  • Biogen
  • Johnson & Johnson Services, Inc.
  • Amgen Inc.
  • UCB S.A.
  • Novartis AG
  • Takeda Pharmaceutical Company Limited
  • Merck & Co., Inc.
  • Pfizer Inc.
  • Eli Lilly

Inflammatory Bowel Disease can occur at any age, although the disease is most common in adolescents and adults between the ages of 15 and 35. Diet and Stress do not cause inflammatory bowel disease but they can worsen the conditions. According to some recent research, hereditary, genetic, and environmental factors contribute to the disease’s development.

According to a 2019 estimate from the Crohn's and Colitis Foundation, 1.6 million Americans have inflammatory bowel disease. In addition, the European Federation of Crohn's and Ulcerative Colitis Associations (EFCCA) estimates that in 2020, there were about 3.4 million people in Europe who have IBD of some kind. IBD is affecting more and more people, which increases the need for efficient treatment solutions.

In the forthcoming years, the Inflammatory Bowel Disease Treatment market is expected to expand due to the rising use of biologics for the treatment of inflammatory bowel disease and the release of potent pipeline medications including Risankizumab, Ustekinumab, Tofacitinib, and upadacitinib.

In the upcoming years, the Inflammatory Bowel Disease Treatment market expansion is expected to be boosted by an increase in initiatives taken by various organizations to address the difficulties in the creation of novel therapies. For instance, the Crohn's and Colitis Foundation published a five-year plan in May 2019 to identify gaps in IBD research, development, and care. Additionally, the European Chronic Disease Alliance has made a lot of efforts to enhance the quality of life for people with inflammatory bowel disease.

Don't pay for what you don't need

Customize your report by selecting specific countries or regions and save 30%!

Region-wise Insights

Which region holds the largest market for Inflammatory Bowel Disease Treatment?

North America holds the largest Inflammatory Bowel Disease Treatment market. In 2021, North America contributed to around 40% of the global revenue. As of 2019, there were 730 clinical trials for IBD, including drug development, observational studies, and others, according to the USA National Library of Medicine. Of these, 268 clinical trials were carried out only in the USA.

A substantial portion of the IBD market in North America is held by Canada. The number of Canadians with IBD is almost around 300,000. It is anticipated that treating Canadians with IBD will cost US$ 1.28 Billion each year. The Quebec government launched a biosimilars initiative in 2021, according to announcements made by the minister of health and social services, Christian Dubé, patients will transition from original biologic medications to their biosimilar equivalents.

Besides, Asia-Pacific accounts for a promising Inflammatory Bowel Disease Treatment market. This is mainly due to the growing access to healthcare, increasing per capita medical expenditure, and rise in the number of patients with inflammatory bowel disease. The commonness of inflammatory bowel disease is higher in Asian countries including India, China, and Japan.

With 1.5 million IBD patients in 2020, India surpassed the USA as the nation with the most IBD patients. In India, only 3% of patients use biologics, a much lower percentage than in Western nations. Infliximab and Adalimumab, two biologics, have IBD approval in India. Since June 2020, Vedolizumab has also been approved.

A significant portion of all cases of inflammatory bowel disease is seen in Japan. Only infliximab and Adalimumab are approved in Japan for the treatment of both UC and CD, and the USA Food and Drug Administration approved five biological drugs for the treatment of IBD in 2016.

Country-wise Insights

USA Inflammatory Bowel Disease Treatment Market

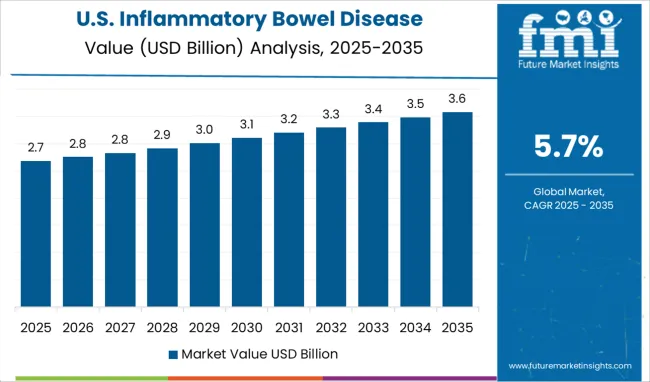
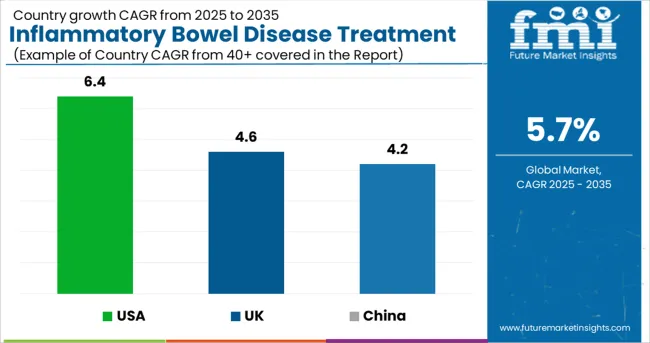
The USA has the largest market for Inflammatory Bowel Disease Treatment, which is projected to reach a valuation of US$ 13.6 Billion by 2032. From 2017 to 2021, the Inflammatory Bowel Disease Treatment market in the USA grew at a CAGR of 4.7% and is expected to experience a CAGR of 6.4% in the next ten years. Between 2022 and 2032, the USA is expected to be a market with a US$ 6.2 Billion absolute dollar opportunity.

According to the Crohn's and Colitis Foundation (CCFA), the number of new cases of Inflammatory Bowel Disease reported in the USA each year exceeds 70,000. Infliximab, Adalimumab, Certolizumab Pegol, and Golimumab are the four anti-TNF medications that have been authorized for the treatment of IBD in the USA. Two anti-integrin biologics, Natalizumab and Vedolizumab, have been licensed for the treatment of IBD, and biosimilars for both anti-TNF medications have been created. In the USA, the biologic Stekinumab, which inhibits the cytokines IL-12 and IL-23, has been licensed for the treatment of Crohn's disease.

China Inflammatory Bowel Disease Treatment Market

In 2021, China was the second-largest Inflammatory Bowel Disease Treatment Market after the USA. The market in the country is expected to reach a valuation of US$ 4.2 Billion by 2032. From the year 2017 to 2021 China’s Inflammatory Bowel Disease Treatment Market experienced a CAGR of 5.5% and is projected to see a similar CAGR of 6.8% in the next ten years. By 2032, China is expected to be an absolute dollar opportunity of US$ 2 Billion.

A huge portion of the population smokes in China owing to the country's rising industrialization and evolving lifestyle. The World Bank estimates that in 2016, 48.4% of all male smokers were in China. Smoking has a negative impact on both the small and large intestines, which raises the prevalence of IBD treatment in China.

Reistone Biopharma Co. Ltd., a Chinese biopharmaceutical company in the clinical stages, reported positive findings from a phase II clinical trial that assessed the safety and effectiveness of its drug candidate, SHR0302, an investigational selective Janus kinase type 1 (JAK1) inhibitor, for the treatment of moderate-to-severe ulcerative colitis. The trials are being carried out in various locations, such as China, the USA, and other countries. The company was considering launching a phase III clinical trial in 2021.

United Kingdom Inflammatory Bowel Disease Treatment Market

The market in the United Kingdom is expected to grow from US$ 842.5 Million in 2017 to reach a valuation of US$ 1.4 Billion by 2032. During the next 10 years, the market in the country is expected to grow at a CAGR of 4.6% to gross an absolute dollar opportunity of US$ 509 Million during the forecast period.

Sabyasachi Ghosh
Sabyasachi Ghosh

Principal Consultant

Talk to Analyst

Find your sweet spots for generating winning opportunities in this market.

Category-wise Insights

Which Type of Inflammatory Bowel Disease Treatment is generating the most revenue in the Market?

Crohn’s Disease is seen to be the most common Inflammatory Bowel Disease. Revenue through the treatment of Crohn’s Disease expanded at a CAGR of 5% from 2017 to 2021 and is projected to grow at a CAGR of 6% from 2022 to 2032.

In 2021, revenue from Crohn's Disease treatment outscored the management of Crohn's Disease 2021 with a market share close to 60 percent. That with the increase in cases has helped to authorize the use of more and more biologics in the marketplace for the treatment of Inflammatory Bowel Disease.

According to Crohn’s and Colitis Foundation, around 25% of patients with Crohn's disease in the USA are prescribed biologics. Moreover, the popularity of Crohn’s disease is about 319 per 100,000 population in North America, while in Europe it is about 322 per 100,000 population.
Competitive Landscape

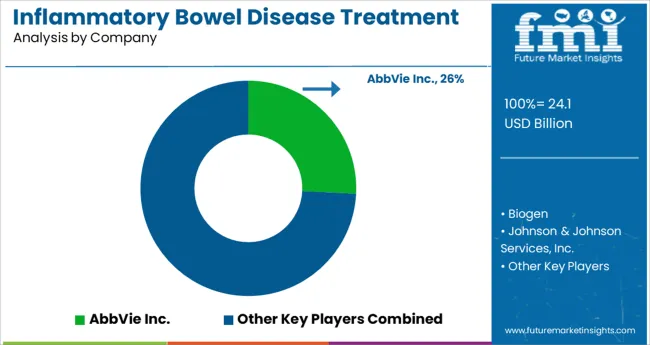
The Inflammatory Bowel Disease Treatment market is moderately competitive and has numerous players. The key companies operating in the Inflammatory Bowel Disease Treatment Market are AbbVie Inc., Biogen, Johnson & Johnson Services, Inc., Amgen Inc., UCB S.A., Novartis AG, Takeda Pharmaceutical Company Limited, Merck & Co., Inc., Pfizer Inc., and Eli Lilly. To secure a dominating position in the market making key players are focusing on introducing new products through collaborations and partnerships.

Some of the recent developments by the key providers of Inflammatory Bowel Disease Treatment are as follows:

  • In May 2022, The IBD NutriCare App was released by the Indian Council of Medical Research (ICMR) to enhance patient care for inflammatory bowel disease (IBD). This software offers real-time data that notifies the dietician or nutritionist of concerns with inaccurate information, enabling prompt nutritional changes.
  • In March 2022, The USA Drug and Food Administration authorized RINVOQ (Upadacitinib) for the treatment of people with moderately to highly active Ulcerative Colitis, according to a statement from AbbVie Inc.
  • In May 2021, the USA Food and Drug Administration have authorized Zeposia (ozanimod) 0.92 mg for the treatment of individuals with moderately to highly active Ulcerative Colitis, according to Bristol-Myers Squibb Company.
  • In March 2021, the monoclonal antibody Lucent-1, developed by the American pharmaceutical company Eli Lilly and Company is being studied in phase III for the treatment of moderate to severe ulcerative colitis.
  • In March 2020, Entyvio (vedolizumab), a drug manufactured by the Japanese multinational pharmaceutical corporation Takeda Pharmaceutical Co. Ltd., has been given approval in China by the National Medical Products Administration (NMPA). For people in China who were intolerant of or sensitive to conventional therapy or tumor necrosis factor-alpha (TNF) inhibitors, it is a gut selective biologic approved to treat moderate to severe ulcerative colitis and Crohn's disease.

Get the data you need at a Fraction of the cost

Personalize your report by choosing insights you need
and save 40%!

Key Segments Covered in Inflammatory Bowel Disease Treatment Market Survey

Inflammatory Bowel Disease Treatment Market by Type:

  • Crohn’s Disease
  • Ulcerative Colitis

Inflammatory Bowel Disease Treatment Market by Drug Case:

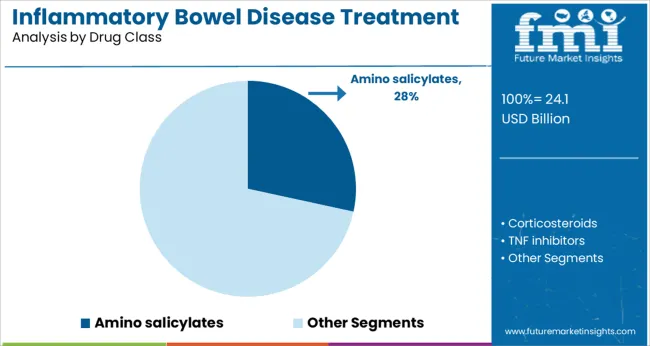
  • Amino salicylates
  • Corticosteroids
  • TNF inhibitors
  • IL inhibitors
  • Anti-integrin
  • JAK inhibitors
  • Other Drug Classes

Inflammatory Bowel Disease Treatment Market by Route of Administration:

  • Oral
  • Injectable

Inflammatory Bowel Disease Treatment Market by Distribution Channel:

  • Hospital Pharmacy
  • Retail Pharmacy
  • Online Pharmacy

Inflammatory Bowel Disease Treatment Market by Region:

  • North America
  • Europe
  • Asia Pacific
  • Middle East and Africa(MEA)
  • Latin America

Frequently Asked Questions

How much is the global Inflammatory Bowel Disease Treatment Market currently worth?

The global Inflammatory Bowel Disease Treatment Market was valued at US$ 20.2 Billion in 2022 and is expected to be a US$ 14.9 Billion absolute dollar opportunity by 2032.

What is the Inflammatory Bowel Disease Treatment Market Forecast through 2032?

Over the projected period, the Inflammatory Bowel Disease Treatment Market is expected to increase at a CAGR of 5.7%, reaching a value of US$ 35.1 Billion by 2032.

At what rate did demand for Inflammatory Bowel Disease Treatment increase over the past few years?

The Inflammatory Bowel Disease Treatment Market expanded at a CAGR of 4.7% from 2017 through 2021.

Which Inflammatory Bowel Disease is seen to be the most common among patients?

Crohn’s Disease is seen to be the most common Inflammatory Bowel Disease. Revenue through the treatment of Crohn’s Disease expanded at a CAGR of 5% from 2017 to 2021 and is projected to grow at a CAGR of 6% by 2032.

Who are the key players shaping the Inflammatory Bowel Disease Treatment Industry?

AbbVie Inc., Biogen, Johnson & Johnson Services, Inc., Amgen Inc., UCB S.A., Novartis AG, Takeda Pharmaceutical Company Limited, Merck & Co., Inc., and Pfizer Inc., are some of the key players in the Inflammatory Bowel Disease Treatment Industry.

Who are the top 5 countries driving the highest Inflammatory Bowel Disease Treatment?

The USA, United Kingdom, China, Japan, and South Korea are expected to drive the most Inflammatory Bowel Disease Treatment.

Table of Content

1. Executive Summary | Inflammatory Bowel Disease Treatment Market

    1.1. Global Market Outlook

    1.2. Demand-side Trends

    1.3. Supply-side Trends

    1.4. Technology Roadmap Analysis

    1.5. Analysis and Recommendations

2. Market Overview

    2.1. Market Coverage / Taxonomy

    2.2. Market Definition / Scope / Limitations

3. Market Background

    3.1. Market Dynamics

        3.1.1. Drivers

        3.1.2. Restraints

        3.1.3. Opportunity

        3.1.4. Trends

    3.2. Scenario Forecast

        3.2.1. Demand in Optimistic Scenario

        3.2.2. Demand in Likely Scenario

        3.2.3. Demand in Conservative Scenario

    3.3. Opportunity Map Analysis

    3.4. Investment Feasibility Matrix

    3.5. PESTLE and Porter’s Analysis

    3.6. Regulatory Landscape

        3.6.1. By Key Regions

        3.6.2. By Key Countries

    3.7. Regional Parent Market Outlook

4. Global Market Analysis 2017 to 2021 and Forecast, 2022 to 2032

    4.1. Historical Market Size Value (US$ Million) Analysis, 2017 to 2021

    4.2. Current and Future Market Size Value (US$ Million) Projections, 2022 to 2032

        4.2.1. Y-o-Y Growth Trend Analysis

        4.2.2. Absolute $ Opportunity Analysis

5. Global Market Analysis 2017 to 2021 and Forecast 2022 to 2032, By Type

    5.1. Introduction / Key Findings

    5.2. Historical Market Size Value (US$ Million) Analysis By Type, 2017 to 2021

    5.3. Current and Future Market Size Value (US$ Million) Analysis and Forecast By Type, 2022 to 2032

        5.3.1. Crohn's Disease

        5.3.2. Ulcerative Colitis

    5.4. Y-o-Y Growth Trend Analysis By Type, 2017 to 2021

    5.5. Absolute $ Opportunity Analysis By Type, 2022 to 2032

6. Global Market Analysis 2017 to 2021 and Forecast 2022 to 2032, By Drug Case

    6.1. Introduction / Key Findings

    6.2. Historical Market Size Value (US$ Million) Analysis By Drug Case, 2017 to 2021

    6.3. Current and Future Market Size Value (US$ Million) Analysis and Forecast By Drug Case, 2022 to 2032

        6.3.1. Amino salicylates

        6.3.2. Corticosteroids

        6.3.3. TNF inhibitors

        6.3.4. IL inhibitors

        6.3.5. Anti- integrin

        6.3.6. JAK inhibitors

        6.3.7. Other Drug Classes

    6.4. Y-o-Y Growth Trend Analysis By Drug Case, 2017 to 2021

    6.5. Absolute $ Opportunity Analysis By Drug Case, 2022 to 2032

7. Global Market Analysis 2017 to 2021 and Forecast 2022 to 2032, By Route of Administration

    7.1. Introduction / Key Findings

    7.2. Historical Market Size Value (US$ Million) Analysis By Route of Administration, 2017 to 2021

    7.3. Current and Future Market Size Value (US$ Million) Analysis and Forecast By Route of Administration, 2022 to 2032

        7.3.1. Oral

        7.3.2. Injectable

    7.4. Y-o-Y Growth Trend Analysis By Route of Administration, 2017 to 2021

    7.5. Absolute $ Opportunity Analysis By Route of Administration, 2022 to 2032

8. Global Market Analysis 2017 to 2021 and Forecast 2022 to 2032, By Distribution Channel

    8.1. Introduction / Key Findings

    8.2. Historical Market Size Value (US$ Million) Analysis By Distribution Channel, 2017 to 2021

    8.3. Current and Future Market Size Value (US$ Million) Analysis and Forecast By Distribution Channel, 2022 to 2032

        8.3.1. Hospital Pharmacy

        8.3.2. Retail Pharmacy

        8.3.3. Online Pharmacy

    8.4. Y-o-Y Growth Trend Analysis By Distribution Channel, 2017 to 2021

    8.5. Absolute $ Opportunity Analysis By Distribution Channel, 2022 to 2032

9. Global Market Analysis 2017 to 2021 and Forecast 2022 to 2032, By Region

    9.1. Introduction

    9.2. Historical Market Size Value (US$ Million) Analysis By Region, 2017 to 2021

    9.3. Current Market Size Value (US$ Million) Analysis and Forecast By Region, 2022 to 2032

        9.3.1. North America

        9.3.2. Latin America

        9.3.3. Europe

        9.3.4. Asia Pacific

        9.3.5. Middle East and Africa(MEA)

    9.4. Market Attractiveness Analysis By Region

10. North America Market Analysis 2017 to 2021 and Forecast 2022 to 2032, By Country

    10.1. Historical Market Size Value (US$ Million) Trend Analysis By Market Taxonomy, 2017 to 2021

    10.2. Market Size Value (US$ Million) Forecast By Market Taxonomy, 2022 to 2032

        10.2.1. By Country

            10.2.1.1. USA

            10.2.1.2. Canada

        10.2.2. By Type

        10.2.3. By Drug Case

        10.2.4. By Route of Administration

        10.2.5. By Distribution Channel

    10.3. Market Attractiveness Analysis

        10.3.1. By Country

        10.3.2. By Type

        10.3.3. By Drug Case

        10.3.4. By Route of Administration

        10.3.5. By Distribution Channel

    10.4. Key Takeaways

11. Latin America Market Analysis 2017 to 2021 and Forecast 2022 to 2032, By Country

    11.1. Historical Market Size Value (US$ Million) Trend Analysis By Market Taxonomy, 2017 to 2021

    11.2. Market Size Value (US$ Million) Forecast By Market Taxonomy, 2022 to 2032

        11.2.1. By Country

            11.2.1.1. Brazil

            11.2.1.2. Mexico

            11.2.1.3. Rest of Latin America

        11.2.2. By Type

        11.2.3. By Drug Case

        11.2.4. By Route of Administration

        11.2.5. By Distribution Channel

    11.3. Market Attractiveness Analysis

        11.3.1. By Country

        11.3.2. By Type

        11.3.3. By Drug Case

        11.3.4. By Route of Administration

        11.3.5. By Distribution Channel

    11.4. Key Takeaways

12. Europe Market Analysis 2017 to 2021 and Forecast 2022 to 2032, By Country

    12.1. Historical Market Size Value (US$ Million) Trend Analysis By Market Taxonomy, 2017 to 2021

    12.2. Market Size Value (US$ Million) Forecast By Market Taxonomy, 2022 to 2032

        12.2.1. By Country

            12.2.1.1. Germany

            12.2.1.2. United Kingdom

            12.2.1.3. France

            12.2.1.4. Spain

            12.2.1.5. Italy

            12.2.1.6. Rest of Europe

        12.2.2. By Type

        12.2.3. By Drug Case

        12.2.4. By Route of Administration

        12.2.5. By Distribution Channel

    12.3. Market Attractiveness Analysis

        12.3.1. By Country

        12.3.2. By Type

        12.3.3. By Drug Case

        12.3.4. By Route of Administration

        12.3.5. By Distribution Channel

    12.4. Key Takeaways

13. Asia Pacific Market Analysis 2017 to 2021 and Forecast 2022 to 2032, By Country

    13.1. Historical Market Size Value (US$ Million) Trend Analysis By Market Taxonomy, 2017 to 2021

    13.2. Market Size Value (US$ Million) Forecast By Market Taxonomy, 2022 to 2032

        13.2.1. By Country

            13.2.1.1. China

            13.2.1.2. Japan

            13.2.1.3. South Korea

            13.2.1.4. Malaysia

            13.2.1.5. Singapore

            13.2.1.6. Australia

            13.2.1.7. Rest of Asia Pacific

        13.2.2. By Type

        13.2.3. By Drug Case

        13.2.4. By Route of Administration

        13.2.5. By Distribution Channel

    13.3. Market Attractiveness Analysis

        13.3.1. By Country

        13.3.2. By Type

        13.3.3. By Drug Case

        13.3.4. By Route of Administration

        13.3.5. By Distribution Channel

    13.4. Key Takeaways

14. MEA Market Analysis 2017 to 2021 and Forecast 2022 to 2032, By Country

    14.1. Historical Market Size Value (US$ Million) Trend Analysis By Market Taxonomy, 2017 to 2021

    14.2. Market Size Value (US$ Million) Forecast By Market Taxonomy, 2022 to 2032

        14.2.1. By Country

            14.2.1.1. GCC Countries

            14.2.1.2. South Africa

            14.2.1.3. Israel

            14.2.1.4. Rest of Middle East and Africa(MEA)

        14.2.2. By Type

        14.2.3. By Drug Case

        14.2.4. By Route of Administration

        14.2.5. By Distribution Channel

    14.3. Market Attractiveness Analysis

        14.3.1. By Country

        14.3.2. By Type

        14.3.3. By Drug Case

        14.3.4. By Route of Administration

        14.3.5. By Distribution Channel

    14.4. Key Takeaways

15. Key Countries Market Analysis

    15.1. United Kingdom

        15.1.1. Pricing Analysis

        15.1.2. Market Share Analysis, 2021

            15.1.2.1. By Type

            15.1.2.2. By Drug Case

            15.1.2.3. By Route of Administration

            15.1.2.4. By Distribution Channel

    15.2. Canada

        15.2.1. Pricing Analysis

        15.2.2. Market Share Analysis, 2021

            15.2.2.1. By Type

            15.2.2.2. By Drug Case

            15.2.2.3. By Route of Administration

            15.2.2.4. By Distribution Channel

    15.3. Brazil

        15.3.1. Pricing Analysis

        15.3.2. Market Share Analysis, 2021

            15.3.2.1. By Type

            15.3.2.2. By Drug Case

            15.3.2.3. By Route of Administration

            15.3.2.4. By Distribution Channel

    15.4. Mexico

        15.4.1. Pricing Analysis

        15.4.2. Market Share Analysis, 2021

            15.4.2.1. By Type

            15.4.2.2. By Drug Case

            15.4.2.3. By Route of Administration

            15.4.2.4. By Distribution Channel

    15.5. Rest of Latin America

        15.5.1. Pricing Analysis

        15.5.2. Market Share Analysis, 2021

            15.5.2.1. By Type

            15.5.2.2. By Drug Case

            15.5.2.3. By Route of Administration

            15.5.2.4. By Distribution Channel

    15.6. Germany

        15.6.1. Pricing Analysis

        15.6.2. Market Share Analysis, 2021

            15.6.2.1. By Type

            15.6.2.2. By Drug Case

            15.6.2.3. By Route of Administration

            15.6.2.4. By Distribution Channel

    15.7. United Kingdom

        15.7.1. Pricing Analysis

        15.7.2. Market Share Analysis, 2021

            15.7.2.1. By Type

            15.7.2.2. By Drug Case

            15.7.2.3. By Route of Administration

            15.7.2.4. By Distribution Channel

    15.8. France

        15.8.1. Pricing Analysis

        15.8.2. Market Share Analysis, 2021

            15.8.2.1. By Type

            15.8.2.2. By Drug Case

            15.8.2.3. By Route of Administration

            15.8.2.4. By Distribution Channel

    15.9. Spain

        15.9.1. Pricing Analysis

        15.9.2. Market Share Analysis, 2021

            15.9.2.1. By Type

            15.9.2.2. By Drug Case

            15.9.2.3. By Route of Administration

            15.9.2.4. By Distribution Channel

    15.10. Italy

        15.10.1. Pricing Analysis

        15.10.2. Market Share Analysis, 2021

            15.10.2.1. By Type

            15.10.2.2. By Drug Case

            15.10.2.3. By Route of Administration

            15.10.2.4. By Distribution Channel

    15.11. Rest of Europe

        15.11.1. Pricing Analysis

        15.11.2. Market Share Analysis, 2021

            15.11.2.1. By Type

            15.11.2.2. By Drug Case

            15.11.2.3. By Route of Administration

            15.11.2.4. By Distribution Channel

    15.12. China

        15.12.1. Pricing Analysis

        15.12.2. Market Share Analysis, 2021

            15.12.2.1. By Type

            15.12.2.2. By Drug Case

            15.12.2.3. By Route of Administration

            15.12.2.4. By Distribution Channel

    15.13. Japan

        15.13.1. Pricing Analysis

        15.13.2. Market Share Analysis, 2021

            15.13.2.1. By Type

            15.13.2.2. By Drug Case

            15.13.2.3. By Route of Administration

            15.13.2.4. By Distribution Channel

    15.14. South Korea

        15.14.1. Pricing Analysis

        15.14.2. Market Share Analysis, 2021

            15.14.2.1. By Type

            15.14.2.2. By Drug Case

            15.14.2.3. By Route of Administration

            15.14.2.4. By Distribution Channel

    15.15. Malaysia

        15.15.1. Pricing Analysis

        15.15.2. Market Share Analysis, 2021

            15.15.2.1. By Type

            15.15.2.2. By Drug Case

            15.15.2.3. By Route of Administration

            15.15.2.4. By Distribution Channel

    15.16. Singapore

        15.16.1. Pricing Analysis

        15.16.2. Market Share Analysis, 2021

            15.16.2.1. By Type

            15.16.2.2. By Drug Case

            15.16.2.3. By Route of Administration

            15.16.2.4. By Distribution Channel

    15.17. Australia

        15.17.1. Pricing Analysis

        15.17.2. Market Share Analysis, 2021

            15.17.2.1. By Type

            15.17.2.2. By Drug Case

            15.17.2.3. By Route of Administration

            15.17.2.4. By Distribution Channel

    15.18. Rest of Asia Pacific

        15.18.1. Pricing Analysis

        15.18.2. Market Share Analysis, 2021

            15.18.2.1. By Type

            15.18.2.2. By Drug Case

            15.18.2.3. By Route of Administration

            15.18.2.4. By Distribution Channel

    15.19. GCC Countries

        15.19.1. Pricing Analysis

        15.19.2. Market Share Analysis, 2021

            15.19.2.1. By Type

            15.19.2.2. By Drug Case

            15.19.2.3. By Route of Administration

            15.19.2.4. By Distribution Channel

    15.20. South Africa

        15.20.1. Pricing Analysis

        15.20.2. Market Share Analysis, 2021

            15.20.2.1. By Type

            15.20.2.2. By Drug Case

            15.20.2.3. By Route of Administration

            15.20.2.4. By Distribution Channel

    15.21. Israel

        15.21.1. Pricing Analysis

        15.21.2. Market Share Analysis, 2021

            15.21.2.1. By Type

            15.21.2.2. By Drug Case

            15.21.2.3. By Route of Administration

            15.21.2.4. By Distribution Channel

    15.22. Rest of Middle East and Africa(MEA)

        15.22.1. Pricing Analysis

        15.22.2. Market Share Analysis, 2021

            15.22.2.1. By Type

            15.22.2.2. By Drug Case

            15.22.2.3. By Route of Administration

            15.22.2.4. By Distribution Channel

16. Market Structure Analysis

    16.1. Competition Dashboard

    16.2. Competition Benchmarking

    16.3. Market Share Analysis of Top Players

        16.3.1. By Regional

        16.3.2. By Type

        16.3.3. By Drug Case

        16.3.4. By Route of Administration

        16.3.5. By Distribution Channel

17. Competition Analysis

    17.1. Competition Deep Dive

        17.1.1. AbbVie Inc.

            17.1.1.1. Overview

            17.1.1.2. Product Portfolio

            17.1.1.3. Profitability by Market Segments

            17.1.1.4. Sales Footprint

            17.1.1.5. Strategy Overview

                17.1.1.5.1. Marketing Strategy

        17.1.2. Biogen

            17.1.2.1. Overview

            17.1.2.2. Product Portfolio

            17.1.2.3. Profitability by Market Segments

            17.1.2.4. Sales Footprint

            17.1.2.5. Strategy Overview

                17.1.2.5.1. Marketing Strategy

        17.1.3. Johnson & Johnson Services, Inc.

            17.1.3.1. Overview

            17.1.3.2. Product Portfolio

            17.1.3.3. Profitability by Market Segments

            17.1.3.4. Sales Footprint

            17.1.3.5. Strategy Overview

                17.1.3.5.1. Marketing Strategy

        17.1.4. Amgen Inc.

            17.1.4.1. Overview

            17.1.4.2. Product Portfolio

            17.1.4.3. Profitability by Market Segments

            17.1.4.4. Sales Footprint

            17.1.4.5. Strategy Overview

                17.1.4.5.1. Marketing Strategy

        17.1.5. UCB S.A.

            17.1.5.1. Overview

            17.1.5.2. Product Portfolio

            17.1.5.3. Profitability by Market Segments

            17.1.5.4. Sales Footprint

            17.1.5.5. Strategy Overview

                17.1.5.5.1. Marketing Strategy

        17.1.6. Novartis AG

            17.1.6.1. Overview

            17.1.6.2. Product Portfolio

            17.1.6.3. Profitability by Market Segments

            17.1.6.4. Sales Footprint

            17.1.6.5. Strategy Overview

                17.1.6.5.1. Marketing Strategy

        17.1.7. Takeda Pharmaceutical Company Ltd.

            17.1.7.1. Overview

            17.1.7.2. Product Portfolio

            17.1.7.3. Profitability by Market Segments

            17.1.7.4. Sales Footprint

            17.1.7.5. Strategy Overview

                17.1.7.5.1. Marketing Strategy

        17.1.8. Merck & Co., Inc.

            17.1.8.1. Overview

            17.1.8.2. Product Portfolio

            17.1.8.3. Profitability by Market Segments

            17.1.8.4. Sales Footprint

            17.1.8.5. Strategy Overview

                17.1.8.5.1. Marketing Strategy

        17.1.9. Pfizer Inc.

            17.1.9.1. Overview

            17.1.9.2. Product Portfolio

            17.1.9.3. Profitability by Market Segments

            17.1.9.4. Sales Footprint

            17.1.9.5. Strategy Overview

                17.1.9.5.1. Marketing Strategy

        17.1.10. Lilly

            17.1.10.1. Overview

            17.1.10.2. Product Portfolio

            17.1.10.3. Profitability by Market Segments

            17.1.10.4. Sales Footprint

            17.1.10.5. Strategy Overview

                17.1.10.5.1. Marketing Strategy

18. Assumptions & Acronyms Used

19. Research Methodology

Don't pay for what you don't need

Customize your report by selecting specific countries or regions and save 30%!

List of Tables

Table 1: Global Market Value (US$ Million) Forecast by Region, 2017 to 2032

Table 2: Global Market Value (US$ Million) Forecast by Type, 2017 to 2032

Table 3: Global Market Value (US$ Million) Forecast by Drug Case, 2017 to 2032

Table 4: Global Market Value (US$ Million) Forecast by Route of Administration, 2017 to 2032

Table 5: Global Market Value (US$ Million) Forecast by Distribution Channel, 2017 to 2032

Table 6: North America Market Value (US$ Million) Forecast by Country, 2017 to 2032

Table 7: North America Market Value (US$ Million) Forecast by Type, 2017 to 2032

Table 8: North America Market Value (US$ Million) Forecast by Drug Case, 2017 to 2032

Table 9: North America Market Value (US$ Million) Forecast by Route of Administration, 2017 to 2032

Table 10: North America Market Value (US$ Million) Forecast by Distribution Channel, 2017 to 2032

Table 11: Latin America Market Value (US$ Million) Forecast by Country, 2017 to 2032

Table 12: Latin America Market Value (US$ Million) Forecast by Type, 2017 to 2032

Table 13: Latin America Market Value (US$ Million) Forecast by Drug Case, 2017 to 2032

Table 14: Latin America Market Value (US$ Million) Forecast by Route of Administration, 2017 to 2032

Table 15: Latin America Market Value (US$ Million) Forecast by Distribution Channel, 2017 to 2032

Table 16: Europe Market Value (US$ Million) Forecast by Country, 2017 to 2032

Table 17: Europe Market Value (US$ Million) Forecast by Type, 2017 to 2032

Table 18: Europe Market Value (US$ Million) Forecast by Drug Case, 2017 to 2032

Table 19: Europe Market Value (US$ Million) Forecast by Route of Administration, 2017 to 2032

Table 20: Europe Market Value (US$ Million) Forecast by Distribution Channel, 2017 to 2032

Table 21: Asia Pacific Market Value (US$ Million) Forecast by Country, 2017 to 2032

Table 22: Asia Pacific Market Value (US$ Million) Forecast by Type, 2017 to 2032

Table 23: Asia Pacific Market Value (US$ Million) Forecast by Drug Case, 2017 to 2032

Table 24: Asia Pacific Market Value (US$ Million) Forecast by Route of Administration, 2017 to 2032

Table 25: Asia Pacific Market Value (US$ Million) Forecast by Distribution Channel, 2017 to 2032

Table 26: MEA Market Value (US$ Million) Forecast by Country, 2017 to 2032

Table 27: MEA Market Value (US$ Million) Forecast by Type, 2017 to 2032

Table 28: MEA Market Value (US$ Million) Forecast by Drug Case, 2017 to 2032

Table 29: MEA Market Value (US$ Million) Forecast by Route of Administration, 2017 to 2032

Table 30: MEA Market Value (US$ Million) Forecast by Distribution Channel, 2017 to 2032
Sabyasachi Ghosh
Sabyasachi Ghosh

Principal Consultant

Talk to Analyst

Find your sweet spots for generating winning opportunities in this market.

List of Charts

Figure 1: Global Market Value (US$ Million) by Type, 2022 to 2032

Figure 2: Global Market Value (US$ Million) by Drug Case, 2022 to 2032

Figure 3: Global Market Value (US$ Million) by Route of Administration, 2022 to 2032

Figure 4: Global Market Value (US$ Million) by Distribution Channel, 2022 to 2032

Figure 5: Global Market Value (US$ Million) by Region, 2022 to 2032

Figure 6: Global Market Value (US$ Million) Analysis by Region, 2017 to 2032

Figure 7: Global Market Value Share (%) and BPS Analysis by Region, 2022 to 2032

Figure 8: Global Market Y-o-Y Growth (%) Projections by Region, 2022 to 2032

Figure 9: Global Market Value (US$ Million) Analysis by Type, 2017 to 2032

Figure 10: Global Market Value Share (%) and BPS Analysis by Type, 2022 to 2032

Figure 11: Global Market Y-o-Y Growth (%) Projections by Type, 2022 to 2032

Figure 12: Global Market Value (US$ Million) Analysis by Drug Case, 2017 to 2032

Figure 13: Global Market Value Share (%) and BPS Analysis by Drug Case, 2022 to 2032

Figure 14: Global Market Y-o-Y Growth (%) Projections by Drug Case, 2022 to 2032

Figure 15: Global Market Value (US$ Million) Analysis by Route of Administration, 2017 to 2032

Figure 16: Global Market Value Share (%) and BPS Analysis by Route of Administration, 2022 to 2032

Figure 17: Global Market Y-o-Y Growth (%) Projections by Route of Administration, 2022 to 2032

Figure 18: Global Market Value (US$ Million) Analysis by Distribution Channel, 2017 to 2032

Figure 19: Global Market Value Share (%) and BPS Analysis by Distribution Channel, 2022 to 2032

Figure 20: Global Market Y-o-Y Growth (%) Projections by Distribution Channel, 2022 to 2032

Figure 21: Global Market Attractiveness by Type, 2022 to 2032

Figure 22: Global Market Attractiveness by Drug Case, 2022 to 2032

Figure 23: Global Market Attractiveness by Route of Administration, 2022 to 2032

Figure 24: Global Market Attractiveness by Distribution Channel, 2022 to 2032

Figure 25: Global Market Attractiveness by Region, 2022 to 2032

Figure 26: North America Market Value (US$ Million) by Type, 2022 to 2032

Figure 27: North America Market Value (US$ Million) by Drug Case, 2022 to 2032

Figure 28: North America Market Value (US$ Million) by Route of Administration, 2022 to 2032

Figure 29: North America Market Value (US$ Million) by Distribution Channel, 2022 to 2032

Figure 30: North America Market Value (US$ Million) by Country, 2022 to 2032

Figure 31: North America Market Value (US$ Million) Analysis by Country, 2017 to 2032

Figure 32: North America Market Value Share (%) and BPS Analysis by Country, 2022 to 2032

Figure 33: North America Market Y-o-Y Growth (%) Projections by Country, 2022 to 2032

Figure 34: North America Market Value (US$ Million) Analysis by Type, 2017 to 2032

Figure 35: North America Market Value Share (%) and BPS Analysis by Type, 2022 to 2032

Figure 36: North America Market Y-o-Y Growth (%) Projections by Type, 2022 to 2032

Figure 37: North America Market Value (US$ Million) Analysis by Drug Case, 2017 to 2032

Figure 38: North America Market Value Share (%) and BPS Analysis by Drug Case, 2022 to 2032

Figure 39: North America Market Y-o-Y Growth (%) Projections by Drug Case, 2022 to 2032

Figure 40: North America Market Value (US$ Million) Analysis by Route of Administration, 2017 to 2032

Figure 41: North America Market Value Share (%) and BPS Analysis by Route of Administration, 2022 to 2032

Figure 42: North America Market Y-o-Y Growth (%) Projections by Route of Administration, 2022 to 2032

Figure 43: North America Market Value (US$ Million) Analysis by Distribution Channel, 2017 to 2032

Figure 44: North America Market Value Share (%) and BPS Analysis by Distribution Channel, 2022 to 2032

Figure 45: North America Market Y-o-Y Growth (%) Projections by Distribution Channel, 2022 to 2032

Figure 46: North America Market Attractiveness by Type, 2022 to 2032

Figure 47: North America Market Attractiveness by Drug Case, 2022 to 2032

Figure 48: North America Market Attractiveness by Route of Administration, 2022 to 2032

Figure 49: North America Market Attractiveness by Distribution Channel, 2022 to 2032

Figure 50: North America Market Attractiveness by Country, 2022 to 2032

Figure 51: Latin America Market Value (US$ Million) by Type, 2022 to 2032

Figure 52: Latin America Market Value (US$ Million) by Drug Case, 2022 to 2032

Figure 53: Latin America Market Value (US$ Million) by Route of Administration, 2022 to 2032

Figure 54: Latin America Market Value (US$ Million) by Distribution Channel, 2022 to 2032

Figure 55: Latin America Market Value (US$ Million) by Country, 2022 to 2032

Figure 56: Latin America Market Value (US$ Million) Analysis by Country, 2017 to 2032

Figure 57: Latin America Market Value Share (%) and BPS Analysis by Country, 2022 to 2032

Figure 58: Latin America Market Y-o-Y Growth (%) Projections by Country, 2022 to 2032

Figure 59: Latin America Market Value (US$ Million) Analysis by Type, 2017 to 2032

Figure 60: Latin America Market Value Share (%) and BPS Analysis by Type, 2022 to 2032

Figure 61: Latin America Market Y-o-Y Growth (%) Projections by Type, 2022 to 2032

Figure 62: Latin America Market Value (US$ Million) Analysis by Drug Case, 2017 to 2032

Figure 63: Latin America Market Value Share (%) and BPS Analysis by Drug Case, 2022 to 2032

Figure 64: Latin America Market Y-o-Y Growth (%) Projections by Drug Case, 2022 to 2032

Figure 65: Latin America Market Value (US$ Million) Analysis by Route of Administration, 2017 to 2032

Figure 66: Latin America Market Value Share (%) and BPS Analysis by Route of Administration, 2022 to 2032

Figure 67: Latin America Market Y-o-Y Growth (%) Projections by Route of Administration, 2022 to 2032

Figure 68: Latin America Market Value (US$ Million) Analysis by Distribution Channel, 2017 to 2032

Figure 69: Latin America Market Value Share (%) and BPS Analysis by Distribution Channel, 2022 to 2032

Figure 70: Latin America Market Y-o-Y Growth (%) Projections by Distribution Channel, 2022 to 2032

Figure 71: Latin America Market Attractiveness by Type, 2022 to 2032

Figure 72: Latin America Market Attractiveness by Drug Case, 2022 to 2032

Figure 73: Latin America Market Attractiveness by Route of Administration, 2022 to 2032

Figure 74: Latin America Market Attractiveness by Distribution Channel, 2022 to 2032

Figure 75: Latin America Market Attractiveness by Country, 2022 to 2032

Figure 76: Europe Market Value (US$ Million) by Type, 2022 to 2032

Figure 77: Europe Market Value (US$ Million) by Drug Case, 2022 to 2032

Figure 78: Europe Market Value (US$ Million) by Route of Administration, 2022 to 2032

Figure 79: Europe Market Value (US$ Million) by Distribution Channel, 2022 to 2032

Figure 80: Europe Market Value (US$ Million) by Country, 2022 to 2032

Figure 81: Europe Market Value (US$ Million) Analysis by Country, 2017 to 2032

Figure 82: Europe Market Value Share (%) and BPS Analysis by Country, 2022 to 2032

Figure 83: Europe Market Y-o-Y Growth (%) Projections by Country, 2022 to 2032

Figure 84: Europe Market Value (US$ Million) Analysis by Type, 2017 to 2032

Figure 85: Europe Market Value Share (%) and BPS Analysis by Type, 2022 to 2032

Figure 86: Europe Market Y-o-Y Growth (%) Projections by Type, 2022 to 2032

Figure 87: Europe Market Value (US$ Million) Analysis by Drug Case, 2017 to 2032

Figure 88: Europe Market Value Share (%) and BPS Analysis by Drug Case, 2022 to 2032

Figure 89: Europe Market Y-o-Y Growth (%) Projections by Drug Case, 2022 to 2032

Figure 90: Europe Market Value (US$ Million) Analysis by Route of Administration, 2017 to 2032

Figure 91: Europe Market Value Share (%) and BPS Analysis by Route of Administration, 2022 to 2032

Figure 92: Europe Market Y-o-Y Growth (%) Projections by Route of Administration, 2022 to 2032

Figure 93: Europe Market Value (US$ Million) Analysis by Distribution Channel, 2017 to 2032

Figure 94: Europe Market Value Share (%) and BPS Analysis by Distribution Channel, 2022 to 2032

Figure 95: Europe Market Y-o-Y Growth (%) Projections by Distribution Channel, 2022 to 2032

Figure 96: Europe Market Attractiveness by Type, 2022 to 2032

Figure 97: Europe Market Attractiveness by Drug Case, 2022 to 2032

Figure 98: Europe Market Attractiveness by Route of Administration, 2022 to 2032

Figure 99: Europe Market Attractiveness by Distribution Channel, 2022 to 2032

Figure 100: Europe Market Attractiveness by Country, 2022 to 2032

Figure 101: Asia Pacific Market Value (US$ Million) by Type, 2022 to 2032

Figure 102: Asia Pacific Market Value (US$ Million) by Drug Case, 2022 to 2032

Figure 103: Asia Pacific Market Value (US$ Million) by Route of Administration, 2022 to 2032

Figure 104: Asia Pacific Market Value (US$ Million) by Distribution Channel, 2022 to 2032

Figure 105: Asia Pacific Market Value (US$ Million) by Country, 2022 to 2032

Figure 106: Asia Pacific Market Value (US$ Million) Analysis by Country, 2017 to 2032

Figure 107: Asia Pacific Market Value Share (%) and BPS Analysis by Country, 2022 to 2032

Figure 108: Asia Pacific Market Y-o-Y Growth (%) Projections by Country, 2022 to 2032

Figure 109: Asia Pacific Market Value (US$ Million) Analysis by Type, 2017 to 2032

Figure 110: Asia Pacific Market Value Share (%) and BPS Analysis by Type, 2022 to 2032

Figure 111: Asia Pacific Market Y-o-Y Growth (%) Projections by Type, 2022 to 2032

Figure 112: Asia Pacific Market Value (US$ Million) Analysis by Drug Case, 2017 to 2032

Figure 113: Asia Pacific Market Value Share (%) and BPS Analysis by Drug Case, 2022 to 2032

Figure 114: Asia Pacific Market Y-o-Y Growth (%) Projections by Drug Case, 2022 to 2032

Figure 115: Asia Pacific Market Value (US$ Million) Analysis by Route of Administration, 2017 to 2032

Figure 116: Asia Pacific Market Value Share (%) and BPS Analysis by Route of Administration, 2022 to 2032

Figure 117: Asia Pacific Market Y-o-Y Growth (%) Projections by Route of Administration, 2022 to 2032

Figure 118: Asia Pacific Market Value (US$ Million) Analysis by Distribution Channel, 2017 to 2032

Figure 119: Asia Pacific Market Value Share (%) and BPS Analysis by Distribution Channel, 2022 to 2032

Figure 120: Asia Pacific Market Y-o-Y Growth (%) Projections by Distribution Channel, 2022 to 2032

Figure 121: Asia Pacific Market Attractiveness by Type, 2022 to 2032

Figure 122: Asia Pacific Market Attractiveness by Drug Case, 2022 to 2032

Figure 123: Asia Pacific Market Attractiveness by Route of Administration, 2022 to 2032

Figure 124: Asia Pacific Market Attractiveness by Distribution Channel, 2022 to 2032

Figure 125: Asia Pacific Market Attractiveness by Country, 2022 to 2032

Figure 126: MEA Market Value (US$ Million) by Type, 2022 to 2032

Figure 127: MEA Market Value (US$ Million) by Drug Case, 2022 to 2032

Figure 128: MEA Market Value (US$ Million) by Route of Administration, 2022 to 2032

Figure 129: MEA Market Value (US$ Million) by Distribution Channel, 2022 to 2032

Figure 130: MEA Market Value (US$ Million) by Country, 2022 to 2032

Figure 131: MEA Market Value (US$ Million) Analysis by Country, 2017 to 2032

Figure 132: MEA Market Value Share (%) and BPS Analysis by Country, 2022 to 2032

Figure 133: MEA Market Y-o-Y Growth (%) Projections by Country, 2022 to 2032

Figure 134: MEA Market Value (US$ Million) Analysis by Type, 2017 to 2032

Figure 135: MEA Market Value Share (%) and BPS Analysis by Type, 2022 to 2032

Figure 136: MEA Market Y-o-Y Growth (%) Projections by Type, 2022 to 2032

Figure 137: MEA Market Value (US$ Million) Analysis by Drug Case, 2017 to 2032

Figure 138: MEA Market Value Share (%) and BPS Analysis by Drug Case, 2022 to 2032

Figure 139: MEA Market Y-o-Y Growth (%) Projections by Drug Case, 2022 to 2032

Figure 140: MEA Market Value (US$ Million) Analysis by Route of Administration, 2017 to 2032

Figure 141: MEA Market Value Share (%) and BPS Analysis by Route of Administration, 2022 to 2032

Figure 142: MEA Market Y-o-Y Growth (%) Projections by Route of Administration, 2022 to 2032

Figure 143: MEA Market Value (US$ Million) Analysis by Distribution Channel, 2017 to 2032

Figure 144: MEA Market Value Share (%) and BPS Analysis by Distribution Channel, 2022 to 2032

Figure 145: MEA Market Y-o-Y Growth (%) Projections by Distribution Channel, 2022 to 2032

Figure 146: MEA Market Attractiveness by Type, 2022 to 2032

Figure 147: MEA Market Attractiveness by Drug Case, 2022 to 2032

Figure 148: MEA Market Attractiveness by Route of Administration, 2022 to 2032

Figure 149: MEA Market Attractiveness by Distribution Channel, 2022 to 2032

Figure 150: MEA Market Attractiveness by Country, 2022 to 2032

Recommendations

Healthcare

Rare Inflammatory Disease Treatment Market

Published : July 2022

Explore Healthcare Insights

View Reports

Inflammatory Bowel Disease Treatment Market