Reports

- Global Locations -

Headquarters

Future Market Insights, Inc.

Christiana Corporate, 200
Continental Drive, Suite 401,
Newark, Delaware - 19713,
United States

T: +1-845-579-5705

Americas

Future Market Insights, Inc.

616 Corporate Way, Suite 2-9018,
Valley Cottage, NY 10989, United States

T: +1-347-918-3531

MEA

Future Market Insights

1602-6 Jumeirah Bay X2 Tower, Plot No: JLT-PH2-X2A,
Jumeirah Lakes Towers, Dubai,
United Arab Emirates

Europe

Future Market Insights

3rd Floor, 207 Regent Street,
W1B 3HH London
United Kingdom

T: + 44 (0) 20 8123 9659
D: +44 (0) 20 3287 4268

Asia Pacific

Future Market Insights

IndiaLand Global Tech Park, Unit UG-1, Behind Grand HighStreet, Phase 1, Hinjawadi, MH, Pune – 411057, India

Chronic Disease Management Market Outlook

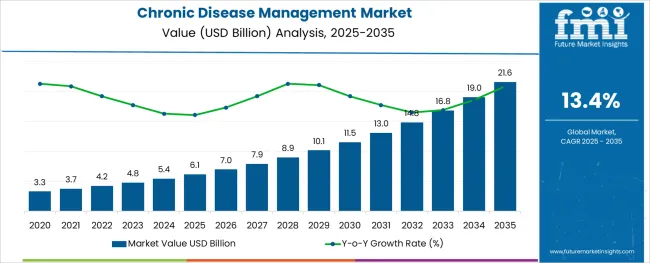
The chronic disease management market is anticipated to flourish at a steady CAGR of 13.4% between 2023 and 2033. The market is expected to hold a market share of US$ 16.83 billion by 2033 while the market is likely to reach a value of US$ 4.77 billion in 2023.

The rising chronic disease management market growth can be attributed to increasing awareness regarding the effects of ailments along with favorable health insurance policies. The market for chronic disease management registered a CAGR of 10.0% in the historical period from 2018 to 2022.

In chronic care management, patients are aware of reliable treatment options and the adoption of chronic disease management rises as patients are thoroughly guided to choose appropriate physicians and treatments to cure the disease. However, there is no specified condition for the patient to provide chronic disease management. Chronic disease management is generally provided in long-term care centers and rehabilitation centers. This improves the quality of care for patients through various means.

Chronic disease management providers make the patient aware of the available reimbursement scenario and help them with Medicare and Medicaid guidance. This, in turn, helps patients to claim their respective allowances. If the patients are opting for chronic disease management, there is a strong possibility that patients get the appropriate treatments at cheap prices and also get the benefit of allocated reimbursement.

Attributes Details
Chronic Disease Management Market CAGR (2023 to 2033) 13.4%
Chronic Disease Management Market Size (2023) US$ 4.77 billion
Chronic Disease Management Market Size (2033) US$ 16.83 billion

Don't pay for what you don't need

Customize your report by selecting specific countries or regions and save 30%!

Chronic Disease Management Market Drivers

The chronic disease management market size is projected to expand to a significant extent over the forecast period due to increasing awareness of people to avail of these services. In addition, there is huge competition among the leading providers in this market.

Both leading and local service provider offers various scheme to compete in the market. Further, chronic disease management service is gaining traction due to the use of health information technologies and improved availability of online resources in healthcare.

The increasing prevalence of chronic diseases such as asthma, COPD, cancer, diabetes, stroke, or musculoskeletal diseases around the globe is the key factor driving the growth of the chronic disease management market. Besides that, increasing awareness regarding healthcare management has also upsurged the demand for chronic disease management over the forecast period.

Improved services by service providers have increased the demand for chronic disease management in the market. Further, the growth in the medical tourism sector and the rise in healthcare IT solutions have fueled the progression of chronic disease management market trends and forecasts.

What are the Challenges Faced by the Chronic Disease Management Market Players?

High investment required to establish the infrastructure and data security concerns related to cloud-based solutions can also hamper the progress of the chronic disease management market. Moreover, inadequate patient engagement and lack of interoperability are responsible for the sluggish growth of this market.
Sabyasachi Ghosh
Sabyasachi Ghosh

Principal Consultant

Talk to Analyst

Find your sweet spots for generating winning opportunities in this market.

Country-wise Insights

Country Revenue Share % (2022)
The United States 38.4%
Germany 5.9%
Japan 3.8%
North America 44.1%
Europe 29.7%
Country CAGR % (2023 to 2033)
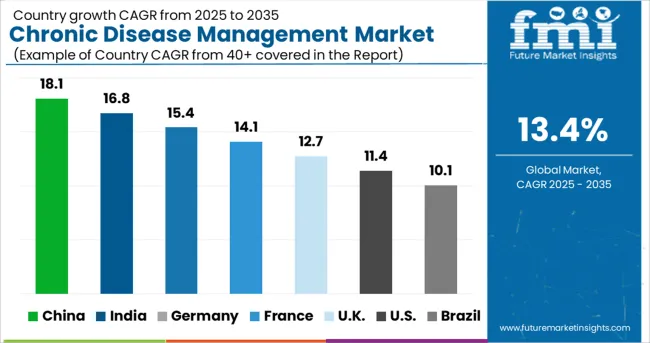
China 19.4%
India 15.9%
Australia 14.1%

Health Insurance Policies Covering Treatment for Chronic Diseases Turns Out to be an Elixir

North America is expected to be an attractive market for chronic disease management due to the availability of advanced healthcare infrastructure in the United States. In addition, the increasing geriatric population in North America is fueling the growth of chronic disease management in the region. Health insurance policies are also contributing to the growth of the market. Thus, due to the aforementioned reasons, North America held a 44.1% market share for the chronic disease management market in 2022.

Reimbursement Policies Favoring Growth of the Chronic Disease Management Market in Europe

Many countries in Europe are affected by cardiovascular diseases. This is leading to people gaining problems with diabetes and obesity. Moreover, cardiovascular diseases are also a key reason for increasing death in the region. This has led to people investing in health insurance policies to manage illnesses better.

Quick and efficient reimbursement facilities are positively influencing the growth of the market in the region. Thus, owing to the reasons mentioned above, Europe held a 29.7% chronic disease management market share in 2022.

Categorical Analysis

Category By Delivery Type
Leading Segment On-premise
Market Share (2022) 54.3%
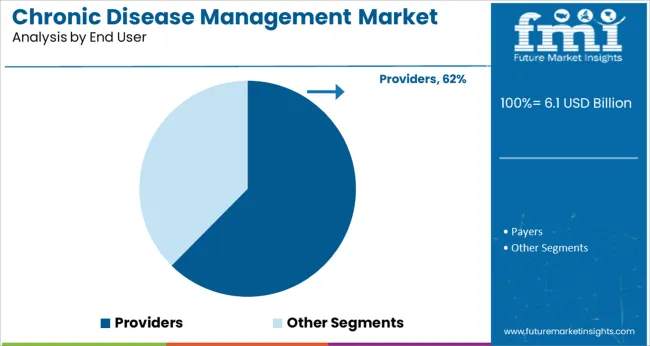
Category By End User Type
Leading Segment Providers
Market Share (2022) 58.8%

Get the data you need at a Fraction of the cost

Personalize your report by choosing insights you need
and save 40%!

How is the Start-Up Ecosystem in the Chronic Disease Management Market?

Key start-ups for chronic disease management are Care Clinic, EveryDose, Pathmate, TheBigPicture, and Phable.

  • Phable, a key start-up player offers a telehealth platform for chronic disease management along with providing a marketplace for users to buy medical devices.
  • A US-based start-up called TheBigPicture develops a smartphone app for managing your health.

It tracks 12 primary human systems, including organs, tissues, and cellular biometrics to assist users in tracking, organizing, maintaining, and improving their health. It includes features like personalized food programs to monitor health indicators and prevent chronic diseases.

Competitive Landscape

Leading service providers in this market are focusing on collaboration and partnership with healthcare stakeholders to provide patient-centric care, in turn bringing about emerging trends in the chronic disease management market. For instance:
  • In November 2021, IBM launched Imaging AI orchestration to help imaging organizations experience the benefits of AI applications working seamlessly together.
  • HealthSmart Holdings, Inc. has offered fully integrated and highly comprehensive care management solutions and services. These solutions manage members with chronic diseases to avoid future health risks.
  • Allscripts Healthcare Solutions, Inc., has its Villa Medical Center which is a patient-centered primary care home, reaching out to patients with chronic illnesses.

Key Players Profiled in the Market

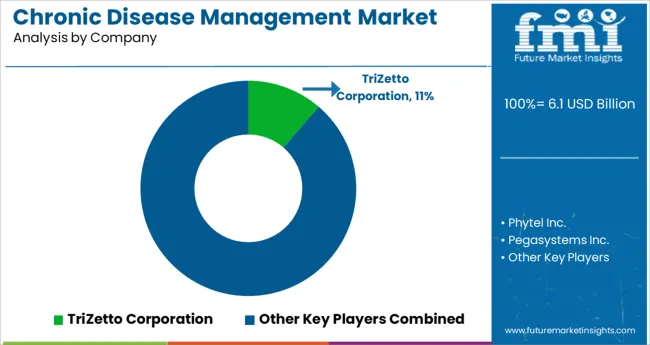
  • TriZetto Corporation
  • IBM
  • Pegasystems Inc.
  • EXL Healthcare
  • AxisPoint Health
  • Wellcentive, Inc.
  • Medecision, Inc.
  • i2i Systems, Inc.
  • HealthSmart Holdings, Inc.
  • Allscripts Healthcare Solutions, Inc.
  • ZeOmega Inc.
  • Epic Corporation Inc.
  • Harmony Information Systems, Inc.

Key Segments Covered

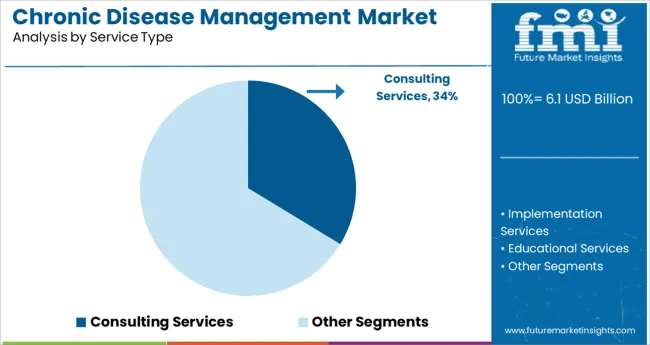
Chronic Disease Management Market by Service Type:

  • Consulting Services
  • Implementation Services
  • Educational Services
  • Other

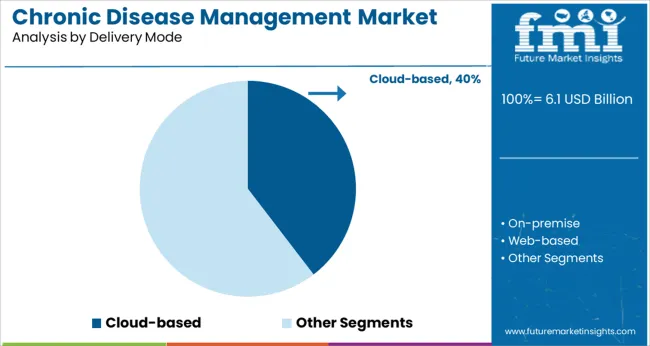
By Delivery Mode:

  • On-premise
  • Web-based
  • Cloud-based

By End User:

  • Providers
  • Payers

Key Regions Covered:

  • North America
    • The United States
    • Canada
  • Latin America
    • Brazil
    • Mexico
    • Rest of Latin America
  • Europe
    • Germany
    • The United Kingdom
    • France
    • Spain
    • Russia
    • Rest of Europe
  • Japan
  • Asia Pacific Excluding Japan
    • China
    • India
    • Malaysia
    • Singapore
    • Australia
    • Rest of Asia Pacific Excluding Japan (APEJ)
  • The Middle East and Africa
    • GCC Countries
    • Israel
    • South Africa
    • The Middle East and Africa (MEA)

Frequently Asked Questions

What was the Global Market Size Reported by FMI for 2022?

The market held a value of US$ 4.31 billion in 2022.

What is the Chronic Disease Management Market Estimated to Reach in 2023?

The market holds a value of US$ 4.77 billion in 2023.

What is the Market Valuation Expected for 2033?

The market is anticipated to hold a share of US$ 16.83 billion by 2033.

What is the Projected CAGR for the Market from 2023 to 2033?

The market is expected to have a CAGR of 13.4% by 2033.

Which Segment Leads the Market by Delivery Type?

The on-premise segment leads the market as it held a market share of 54.3% in 2022.

Which Segment Leads the Market by End User Type?

The providers segment leads the market as it held a market share of 58.8% in 2022.

Table of Content

1. Executive Summary

    1.1. Global Market Outlook

    1.2. Demand-side Trends

    1.3. Supply-side Trends

    1.4. Technology Roadmap Analysis

    1.5. Analysis and Recommendations

2. Market Overview

    2.1. Market Coverage / Taxonomy

    2.2. Market Definition / Scope / Limitations

3. Market Background

    3.1. Market Dynamics

        3.1.1. Drivers

        3.1.2. Restraints

        3.1.3. Opportunity

        3.1.4. Trends

    3.2. Scenario Forecast

        3.2.1. Demand in Optimistic Scenario

        3.2.2. Demand in Likely Scenario

        3.2.3. Demand in Conservative Scenario

    3.3. Opportunity Map Analysis

    3.4. Investment Feasibility Matrix

    3.5. PESTLE and Porter’s Analysis

    3.6. Regulatory Landscape

        3.6.1. By Key Regions

        3.6.2. By Key Countries

    3.7. Regional Parent Market Outlook

4. Global Market Analysis 2018 to 2022 and Forecast, 2023 to 2033

    4.1. Historical Market Size Value (US$ Million) Analysis, 2018 to 2022

    4.2. Current and Future Market Size Value (US$ Million) Projections, 2023 to 2033

        4.2.1. Y-o-Y Growth Trend Analysis

        4.2.2. Absolute $ Opportunity Analysis

5. Global Market Analysis 2018 to 2022 and Forecast 2023 to 2033, By Service Type

    5.1. Introduction / Key Findings

    5.2. Historical Market Size Value (US$ Million) Analysis By Service Type, 2018 to 2022

    5.3. Current and Future Market Size Value (US$ Million) Analysis and Forecast By Service Type, 2023 to 2033

        5.3.1. Consulting Services

        5.3.2. Implementation Services

        5.3.3. Educational Services

        5.3.4. Other Service Types

    5.4. Y-o-Y Growth Trend Analysis By Service Type, 2018 to 2022

    5.5. Absolute $ Opportunity Analysis By Service Type, 2023 to 2033

6. Global Market Analysis 2018 to 2022 and Forecast 2023 to 2033, By Delivery Mode

    6.1. Introduction / Key Findings

    6.2. Historical Market Size Value (US$ Million) Analysis By Delivery Mode, 2018 to 2022

    6.3. Current and Future Market Size Value (US$ Million) Analysis and Forecast By Delivery Mode, 2023 to 2033

        6.3.1. On-premise

        6.3.2. Web-based

        6.3.3. Cloud-based

    6.4. Y-o-Y Growth Trend Analysis By Delivery Mode, 2018 to 2022

    6.5. Absolute $ Opportunity Analysis By Delivery Mode, 2023 to 2033

7. Global Market Analysis 2018 to 2022 and Forecast 2023 to 2033, By End User

    7.1. Introduction / Key Findings

    7.2. Historical Market Size Value (US$ Million) Analysis By End User , 2018 to 2022

    7.3. Current and Future Market Size Value (US$ Million) Analysis and Forecast By End User , 2023 to 2033

        7.3.1. Providers

        7.3.2. Payers

    7.4. Y-o-Y Growth Trend Analysis By End User , 2018 to 2022

    7.5. Absolute $ Opportunity Analysis By End User , 2023 to 2033

8. Global Market Analysis 2018 to 2022 and Forecast 2023 to 2033, By Region

    8.1. Introduction

    8.2. Historical Market Size Value (US$ Million) Analysis By Region, 2018 to 2022

    8.3. Current Market Size Value (US$ Million) Analysis and Forecast By Region, 2023 to 2033

        8.3.1. North America

        8.3.2. Latin America

        8.3.3. Western Europe

        8.3.4. Eastern Europe

        8.3.5. South Asia and Pacific

        8.3.6. East Asia

        8.3.7. Middle East and Africa

    8.4. Market Attractiveness Analysis By Region

9. North America Market Analysis 2018 to 2022 and Forecast 2023 to 2033, By Country

    9.1. Historical Market Size Value (US$ Million) Trend Analysis By Market Taxonomy, 2018 to 2022

    9.2. Market Size Value (US$ Million) Forecast By Market Taxonomy, 2023 to 2033

        9.2.1. By Country

            9.2.1.1. USA.

            9.2.1.2. Canada

        9.2.2. By Service Type

        9.2.3. By Delivery Mode

        9.2.4. By End User

    9.3. Market Attractiveness Analysis

        9.3.1. By Country

        9.3.2. By Service Type

        9.3.3. By Delivery Mode

        9.3.4. By End User

    9.4. Key Takeaways

10. Latin America Market Analysis 2018 to 2022 and Forecast 2023 to 2033, By Country

    10.1. Historical Market Size Value (US$ Million) Trend Analysis By Market Taxonomy, 2018 to 2022

    10.2. Market Size Value (US$ Million) Forecast By Market Taxonomy, 2023 to 2033

        10.2.1. By Country

            10.2.1.1. Brazil

            10.2.1.2. Mexico

            10.2.1.3. Rest of Latin America

        10.2.2. By Service Type

        10.2.3. By Delivery Mode

        10.2.4. By End User

    10.3. Market Attractiveness Analysis

        10.3.1. By Country

        10.3.2. By Service Type

        10.3.3. By Delivery Mode

        10.3.4. By End User

    10.4. Key Takeaways

11. Western Europe Market Analysis 2018 to 2022 and Forecast 2023 to 2033, By Country

    11.1. Historical Market Size Value (US$ Million) Trend Analysis By Market Taxonomy, 2018 to 2022

    11.2. Market Size Value (US$ Million) Forecast By Market Taxonomy, 2023 to 2033

        11.2.1. By Country

            11.2.1.1. Germany

            11.2.1.2. United Kingdom.

            11.2.1.3. France

            11.2.1.4. Spain

            11.2.1.5. Italy

            11.2.1.6. Rest of Western Europe

        11.2.2. By Service Type

        11.2.3. By Delivery Mode

        11.2.4. By End User

    11.3. Market Attractiveness Analysis

        11.3.1. By Country

        11.3.2. By Service Type

        11.3.3. By Delivery Mode

        11.3.4. By End User

    11.4. Key Takeaways

12. Eastern Europe Market Analysis 2018 to 2022 and Forecast 2023 to 2033, By Country

    12.1. Historical Market Size Value (US$ Million) Trend Analysis By Market Taxonomy, 2018 to 2022

    12.2. Market Size Value (US$ Million) Forecast By Market Taxonomy, 2023 to 2033

        12.2.1. By Country

            12.2.1.1. Poland

            12.2.1.2. Russia

            12.2.1.3. Czech Republic

            12.2.1.4. Romania

            12.2.1.5. Rest of Eastern Europe

        12.2.2. By Service Type

        12.2.3. By Delivery Mode

        12.2.4. By End User

    12.3. Market Attractiveness Analysis

        12.3.1. By Country

        12.3.2. By Service Type

        12.3.3. By Delivery Mode

        12.3.4. By End User

    12.4. Key Takeaways

13. South Asia and Pacific Market Analysis 2018 to 2022 and Forecast 2023 to 2033, By Country

    13.1. Historical Market Size Value (US$ Million) Trend Analysis By Market Taxonomy, 2018 to 2022

    13.2. Market Size Value (US$ Million) Forecast By Market Taxonomy, 2023 to 2033

        13.2.1. By Country

            13.2.1.1. India

            13.2.1.2. Bangladesh

            13.2.1.3. Australia

            13.2.1.4. New Zealand

            13.2.1.5. Rest of South Asia and Pacific

        13.2.2. By Service Type

        13.2.3. By Delivery Mode

        13.2.4. By End User

    13.3. Market Attractiveness Analysis

        13.3.1. By Country

        13.3.2. By Service Type

        13.3.3. By Delivery Mode

        13.3.4. By End User

    13.4. Key Takeaways

14. East Asia Market Analysis 2018 to 2022 and Forecast 2023 to 2033, By Country

    14.1. Historical Market Size Value (US$ Million) Trend Analysis By Market Taxonomy, 2018 to 2022

    14.2. Market Size Value (US$ Million) Forecast By Market Taxonomy, 2023 to 2033

        14.2.1. By Country

            14.2.1.1. China

            14.2.1.2. Japan

            14.2.1.3. South Korea

        14.2.2. By Service Type

        14.2.3. By Delivery Mode

        14.2.4. By End User

    14.3. Market Attractiveness Analysis

        14.3.1. By Country

        14.3.2. By Service Type

        14.3.3. By Delivery Mode

        14.3.4. By End User

    14.4. Key Takeaways

15. Middle East and Africa Market Analysis 2018 to 2022 and Forecast 2023 to 2033, By Country

    15.1. Historical Market Size Value (US$ Million) Trend Analysis By Market Taxonomy, 2018 to 2022

    15.2. Market Size Value (US$ Million) Forecast By Market Taxonomy, 2023 to 2033

        15.2.1. By Country

            15.2.1.1. GCC Countries

            15.2.1.2. South Africa

            15.2.1.3. Israel

            15.2.1.4. Rest of MEA

        15.2.2. By Service Type

        15.2.3. By Delivery Mode

        15.2.4. By End User

    15.3. Market Attractiveness Analysis

        15.3.1. By Country

        15.3.2. By Service Type

        15.3.3. By Delivery Mode

        15.3.4. By End User

    15.4. Key Takeaways

16. Key Countries Market Analysis

    16.1. USA.

        16.1.1. Pricing Analysis

        16.1.2. Market Share Analysis, 2022

            16.1.2.1. By Service Type

            16.1.2.2. By Delivery Mode

            16.1.2.3. By End User

    16.2. Canada

        16.2.1. Pricing Analysis

        16.2.2. Market Share Analysis, 2022

            16.2.2.1. By Service Type

            16.2.2.2. By Delivery Mode

            16.2.2.3. By End User

    16.3. Brazil

        16.3.1. Pricing Analysis

        16.3.2. Market Share Analysis, 2022

            16.3.2.1. By Service Type

            16.3.2.2. By Delivery Mode

            16.3.2.3. By End User

    16.4. Mexico

        16.4.1. Pricing Analysis

        16.4.2. Market Share Analysis, 2022

            16.4.2.1. By Service Type

            16.4.2.2. By Delivery Mode

            16.4.2.3. By End User

    16.5. Germany

        16.5.1. Pricing Analysis

        16.5.2. Market Share Analysis, 2022

            16.5.2.1. By Service Type

            16.5.2.2. By Delivery Mode

            16.5.2.3. By End User

    16.6. United Kingdom.

        16.6.1. Pricing Analysis

        16.6.2. Market Share Analysis, 2022

            16.6.2.1. By Service Type

            16.6.2.2. By Delivery Mode

            16.6.2.3. By End User

    16.7. France

        16.7.1. Pricing Analysis

        16.7.2. Market Share Analysis, 2022

            16.7.2.1. By Service Type

            16.7.2.2. By Delivery Mode

            16.7.2.3. By End User

    16.8. Spain

        16.8.1. Pricing Analysis

        16.8.2. Market Share Analysis, 2022

            16.8.2.1. By Service Type

            16.8.2.2. By Delivery Mode

            16.8.2.3. By End User

    16.9. Italy

        16.9.1. Pricing Analysis

        16.9.2. Market Share Analysis, 2022

            16.9.2.1. By Service Type

            16.9.2.2. By Delivery Mode

            16.9.2.3. By End User

    16.10. Poland

        16.10.1. Pricing Analysis

        16.10.2. Market Share Analysis, 2022

            16.10.2.1. By Service Type

            16.10.2.2. By Delivery Mode

            16.10.2.3. By End User

    16.11. Russia

        16.11.1. Pricing Analysis

        16.11.2. Market Share Analysis, 2022

            16.11.2.1. By Service Type

            16.11.2.2. By Delivery Mode

            16.11.2.3. By End User

    16.12. Czech Republic

        16.12.1. Pricing Analysis

        16.12.2. Market Share Analysis, 2022

            16.12.2.1. By Service Type

            16.12.2.2. By Delivery Mode

            16.12.2.3. By End User

    16.13. Romania

        16.13.1. Pricing Analysis

        16.13.2. Market Share Analysis, 2022

            16.13.2.1. By Service Type

            16.13.2.2. By Delivery Mode

            16.13.2.3. By End User

    16.14. India

        16.14.1. Pricing Analysis

        16.14.2. Market Share Analysis, 2022

            16.14.2.1. By Service Type

            16.14.2.2. By Delivery Mode

            16.14.2.3. By End User

    16.15. Bangladesh

        16.15.1. Pricing Analysis

        16.15.2. Market Share Analysis, 2022

            16.15.2.1. By Service Type

            16.15.2.2. By Delivery Mode

            16.15.2.3. By End User

    16.16. Australia

        16.16.1. Pricing Analysis

        16.16.2. Market Share Analysis, 2022

            16.16.2.1. By Service Type

            16.16.2.2. By Delivery Mode

            16.16.2.3. By End User

    16.17. New Zealand

        16.17.1. Pricing Analysis

        16.17.2. Market Share Analysis, 2022

            16.17.2.1. By Service Type

            16.17.2.2. By Delivery Mode

            16.17.2.3. By End User

    16.18. China

        16.18.1. Pricing Analysis

        16.18.2. Market Share Analysis, 2022

            16.18.2.1. By Service Type

            16.18.2.2. By Delivery Mode

            16.18.2.3. By End User

    16.19. Japan

        16.19.1. Pricing Analysis

        16.19.2. Market Share Analysis, 2022

            16.19.2.1. By Service Type

            16.19.2.2. By Delivery Mode

            16.19.2.3. By End User

    16.20. South Korea

        16.20.1. Pricing Analysis

        16.20.2. Market Share Analysis, 2022

            16.20.2.1. By Service Type

            16.20.2.2. By Delivery Mode

            16.20.2.3. By End User

    16.21. GCC Countries

        16.21.1. Pricing Analysis

        16.21.2. Market Share Analysis, 2022

            16.21.2.1. By Service Type

            16.21.2.2. By Delivery Mode

            16.21.2.3. By End User

    16.22. South Africa

        16.22.1. Pricing Analysis

        16.22.2. Market Share Analysis, 2022

            16.22.2.1. By Service Type

            16.22.2.2. By Delivery Mode

            16.22.2.3. By End User

    16.23. Israel

        16.23.1. Pricing Analysis

        16.23.2. Market Share Analysis, 2022

            16.23.2.1. By Service Type

            16.23.2.2. By Delivery Mode

            16.23.2.3. By End User

17. Market Structure Analysis

    17.1. Competition Dashboard

    17.2. Competition Benchmarking

    17.3. Market Share Analysis of Top Players

        17.3.1. By Regional

        17.3.2. By Service Type

        17.3.3. By Delivery Mode

        17.3.4. By End User

18. Competition Analysis

    18.1. Competition Deep Dive

        18.1.1. TriZetto Corporation

            18.1.1.1. Overview

            18.1.1.2. Product Portfolio

            18.1.1.3. Profitability by Market Segments

            18.1.1.4. Sales Footprint

            18.1.1.5. Strategy Overview

                18.1.1.5.1. Marketing Strategy

        18.1.2. Phytel Inc.

            18.1.2.1. Overview

            18.1.2.2. Product Portfolio

            18.1.2.3. Profitability by Market Segments

            18.1.2.4. Sales Footprint

            18.1.2.5. Strategy Overview

                18.1.2.5.1. Marketing Strategy

        18.1.3. Pegasystems Inc.

            18.1.3.1. Overview

            18.1.3.2. Product Portfolio

            18.1.3.3. Profitability by Market Segments

            18.1.3.4. Sales Footprint

            18.1.3.5. Strategy Overview

                18.1.3.5.1. Marketing Strategy

        18.1.4. EXL Healthcare

            18.1.4.1. Overview

            18.1.4.2. Product Portfolio

            18.1.4.3. Profitability by Market Segments

            18.1.4.4. Sales Footprint

            18.1.4.5. Strategy Overview

                18.1.4.5.1. Marketing Strategy

        18.1.5. AxisPoint Health

            18.1.5.1. Overview

            18.1.5.2. Product Portfolio

            18.1.5.3. Profitability by Market Segments

            18.1.5.4. Sales Footprint

            18.1.5.5. Strategy Overview

                18.1.5.5.1. Marketing Strategy

        18.1.6. Wellcentive, Inc.

            18.1.6.1. Overview

            18.1.6.2. Product Portfolio

            18.1.6.3. Profitability by Market Segments

            18.1.6.4. Sales Footprint

            18.1.6.5. Strategy Overview

                18.1.6.5.1. Marketing Strategy

        18.1.7. Medecision, Inc.

            18.1.7.1. Overview

            18.1.7.2. Product Portfolio

            18.1.7.3. Profitability by Market Segments

            18.1.7.4. Sales Footprint

            18.1.7.5. Strategy Overview

                18.1.7.5.1. Marketing Strategy

        18.1.8. i2i Systems, Inc.

            18.1.8.1. Overview

            18.1.8.2. Product Portfolio

            18.1.8.3. Profitability by Market Segments

            18.1.8.4. Sales Footprint

            18.1.8.5. Strategy Overview

                18.1.8.5.1. Marketing Strategy

        18.1.9. HealthSmart Holdings, Inc.

            18.1.9.1. Overview

            18.1.9.2. Product Portfolio

            18.1.9.3. Profitability by Market Segments

            18.1.9.4. Sales Footprint

            18.1.9.5. Strategy Overview

                18.1.9.5.1. Marketing Strategy

        18.1.10. Allscripts Healthcare Solutions, Inc

            18.1.10.1. Overview

            18.1.10.2. Product Portfolio

            18.1.10.3. Profitability by Market Segments

            18.1.10.4. Sales Footprint

            18.1.10.5. Strategy Overview

                18.1.10.5.1. Marketing Strategy

        18.1.11. ZeOmega Inc

            18.1.11.1. Overview

            18.1.11.2. Product Portfolio

            18.1.11.3. Profitability by Market Segments

            18.1.11.4. Sales Footprint

            18.1.11.5. Strategy Overview

                18.1.11.5.1. Marketing Strategy

        18.1.12. Epic Corporation Inc

            18.1.12.1. Overview

            18.1.12.2. Product Portfolio

            18.1.12.3. Profitability by Market Segments

            18.1.12.4. Sales Footprint

            18.1.12.5. Strategy Overview

                18.1.12.5.1. Marketing Strategy

        18.1.13. Harmony Information Systems, Inc.

            18.1.13.1. Overview

            18.1.13.2. Product Portfolio

            18.1.13.3. Profitability by Market Segments

            18.1.13.4. Sales Footprint

            18.1.13.5. Strategy Overview

                18.1.13.5.1. Marketing Strategy

19. Assumptions & Acronyms Used

20. Research Methodology

List of Tables

Table 1: Global Market Value (US$ Million) Forecast by Region, 2018 to 2033

Table 2: Global Market Value (US$ Million) Forecast by Service Type, 2018 to 2033

Table 3: Global Market Value (US$ Million) Forecast by Delivery Mode, 2018 to 2033

Table 4: Global Market Value (US$ Million) Forecast by End User , 2018 to 2033

Table 5: North America Market Value (US$ Million) Forecast by Country, 2018 to 2033

Table 6: North America Market Value (US$ Million) Forecast by Service Type, 2018 to 2033

Table 7: North America Market Value (US$ Million) Forecast by Delivery Mode, 2018 to 2033

Table 8: North America Market Value (US$ Million) Forecast by End User , 2018 to 2033

Table 9: Latin America Market Value (US$ Million) Forecast by Country, 2018 to 2033

Table 10: Latin America Market Value (US$ Million) Forecast by Service Type, 2018 to 2033

Table 11: Latin America Market Value (US$ Million) Forecast by Delivery Mode, 2018 to 2033

Table 12: Latin America Market Value (US$ Million) Forecast by End User , 2018 to 2033

Table 13: Western Europe Market Value (US$ Million) Forecast by Country, 2018 to 2033

Table 14: Western Europe Market Value (US$ Million) Forecast by Service Type, 2018 to 2033

Table 15: Western Europe Market Value (US$ Million) Forecast by Delivery Mode, 2018 to 2033

Table 16: Western Europe Market Value (US$ Million) Forecast by End User , 2018 to 2033

Table 17: Eastern Europe Market Value (US$ Million) Forecast by Country, 2018 to 2033

Table 18: Eastern Europe Market Value (US$ Million) Forecast by Service Type, 2018 to 2033

Table 19: Eastern Europe Market Value (US$ Million) Forecast by Delivery Mode, 2018 to 2033

Table 20: Eastern Europe Market Value (US$ Million) Forecast by End User , 2018 to 2033

Table 21: South Asia and Pacific Market Value (US$ Million) Forecast by Country, 2018 to 2033

Table 22: South Asia and Pacific Market Value (US$ Million) Forecast by Service Type, 2018 to 2033

Table 23: South Asia and Pacific Market Value (US$ Million) Forecast by Delivery Mode, 2018 to 2033

Table 24: South Asia and Pacific Market Value (US$ Million) Forecast by End User , 2018 to 2033

Table 25: East Asia Market Value (US$ Million) Forecast by Country, 2018 to 2033

Table 26: East Asia Market Value (US$ Million) Forecast by Service Type, 2018 to 2033

Table 27: East Asia Market Value (US$ Million) Forecast by Delivery Mode, 2018 to 2033

Table 28: East Asia Market Value (US$ Million) Forecast by End User , 2018 to 2033

Table 29: Middle East and Africa Market Value (US$ Million) Forecast by Country, 2018 to 2033

Table 30: Middle East and Africa Market Value (US$ Million) Forecast by Service Type, 2018 to 2033

Table 31: Middle East and Africa Market Value (US$ Million) Forecast by Delivery Mode, 2018 to 2033

Table 32: Middle East and Africa Market Value (US$ Million) Forecast by End User , 2018 to 2033

List of Charts

Figure 1: Global Market Value (US$ Million) by Service Type, 2023 to 2033

Figure 2: Global Market Value (US$ Million) by Delivery Mode, 2023 to 2033

Figure 3: Global Market Value (US$ Million) by End User , 2023 to 2033

Figure 4: Global Market Value (US$ Million) by Region, 2023 to 2033

Figure 5: Global Market Value (US$ Million) Analysis by Region, 2018 to 2033

Figure 6: Global Market Value Share (%) and BPS Analysis by Region, 2023 to 2033

Figure 7: Global Market Y-o-Y Growth (%) Projections by Region, 2023 to 2033

Figure 8: Global Market Value (US$ Million) Analysis by Service Type, 2018 to 2033

Figure 9: Global Market Value Share (%) and BPS Analysis by Service Type, 2023 to 2033

Figure 10: Global Market Y-o-Y Growth (%) Projections by Service Type, 2023 to 2033

Figure 11: Global Market Value (US$ Million) Analysis by Delivery Mode, 2018 to 2033

Figure 12: Global Market Value Share (%) and BPS Analysis by Delivery Mode, 2023 to 2033

Figure 13: Global Market Y-o-Y Growth (%) Projections by Delivery Mode, 2023 to 2033

Figure 14: Global Market Value (US$ Million) Analysis by End User , 2018 to 2033

Figure 15: Global Market Value Share (%) and BPS Analysis by End User , 2023 to 2033

Figure 16: Global Market Y-o-Y Growth (%) Projections by End User , 2023 to 2033

Figure 17: Global Market Attractiveness by Service Type, 2023 to 2033

Figure 18: Global Market Attractiveness by Delivery Mode, 2023 to 2033

Figure 19: Global Market Attractiveness by End User , 2023 to 2033

Figure 20: Global Market Attractiveness by Region, 2023 to 2033

Figure 21: North America Market Value (US$ Million) by Service Type, 2023 to 2033

Figure 22: North America Market Value (US$ Million) by Delivery Mode, 2023 to 2033

Figure 23: North America Market Value (US$ Million) by End User , 2023 to 2033

Figure 24: North America Market Value (US$ Million) by Country, 2023 to 2033

Figure 25: North America Market Value (US$ Million) Analysis by Country, 2018 to 2033

Figure 26: North America Market Value Share (%) and BPS Analysis by Country, 2023 to 2033

Figure 27: North America Market Y-o-Y Growth (%) Projections by Country, 2023 to 2033

Figure 28: North America Market Value (US$ Million) Analysis by Service Type, 2018 to 2033

Figure 29: North America Market Value Share (%) and BPS Analysis by Service Type, 2023 to 2033

Figure 30: North America Market Y-o-Y Growth (%) Projections by Service Type, 2023 to 2033

Figure 31: North America Market Value (US$ Million) Analysis by Delivery Mode, 2018 to 2033

Figure 32: North America Market Value Share (%) and BPS Analysis by Delivery Mode, 2023 to 2033

Figure 33: North America Market Y-o-Y Growth (%) Projections by Delivery Mode, 2023 to 2033

Figure 34: North America Market Value (US$ Million) Analysis by End User , 2018 to 2033

Figure 35: North America Market Value Share (%) and BPS Analysis by End User , 2023 to 2033

Figure 36: North America Market Y-o-Y Growth (%) Projections by End User , 2023 to 2033

Figure 37: North America Market Attractiveness by Service Type, 2023 to 2033

Figure 38: North America Market Attractiveness by Delivery Mode, 2023 to 2033

Figure 39: North America Market Attractiveness by End User , 2023 to 2033

Figure 40: North America Market Attractiveness by Country, 2023 to 2033

Figure 41: Latin America Market Value (US$ Million) by Service Type, 2023 to 2033

Figure 42: Latin America Market Value (US$ Million) by Delivery Mode, 2023 to 2033

Figure 43: Latin America Market Value (US$ Million) by End User , 2023 to 2033

Figure 44: Latin America Market Value (US$ Million) by Country, 2023 to 2033

Figure 45: Latin America Market Value (US$ Million) Analysis by Country, 2018 to 2033

Figure 46: Latin America Market Value Share (%) and BPS Analysis by Country, 2023 to 2033

Figure 47: Latin America Market Y-o-Y Growth (%) Projections by Country, 2023 to 2033

Figure 48: Latin America Market Value (US$ Million) Analysis by Service Type, 2018 to 2033

Figure 49: Latin America Market Value Share (%) and BPS Analysis by Service Type, 2023 to 2033

Figure 50: Latin America Market Y-o-Y Growth (%) Projections by Service Type, 2023 to 2033

Figure 51: Latin America Market Value (US$ Million) Analysis by Delivery Mode, 2018 to 2033

Figure 52: Latin America Market Value Share (%) and BPS Analysis by Delivery Mode, 2023 to 2033

Figure 53: Latin America Market Y-o-Y Growth (%) Projections by Delivery Mode, 2023 to 2033

Figure 54: Latin America Market Value (US$ Million) Analysis by End User , 2018 to 2033

Figure 55: Latin America Market Value Share (%) and BPS Analysis by End User , 2023 to 2033

Figure 56: Latin America Market Y-o-Y Growth (%) Projections by End User , 2023 to 2033

Figure 57: Latin America Market Attractiveness by Service Type, 2023 to 2033

Figure 58: Latin America Market Attractiveness by Delivery Mode, 2023 to 2033

Figure 59: Latin America Market Attractiveness by End User , 2023 to 2033

Figure 60: Latin America Market Attractiveness by Country, 2023 to 2033

Figure 61: Western Europe Market Value (US$ Million) by Service Type, 2023 to 2033

Figure 62: Western Europe Market Value (US$ Million) by Delivery Mode, 2023 to 2033

Figure 63: Western Europe Market Value (US$ Million) by End User , 2023 to 2033

Figure 64: Western Europe Market Value (US$ Million) by Country, 2023 to 2033

Figure 65: Western Europe Market Value (US$ Million) Analysis by Country, 2018 to 2033

Figure 66: Western Europe Market Value Share (%) and BPS Analysis by Country, 2023 to 2033

Figure 67: Western Europe Market Y-o-Y Growth (%) Projections by Country, 2023 to 2033

Figure 68: Western Europe Market Value (US$ Million) Analysis by Service Type, 2018 to 2033

Figure 69: Western Europe Market Value Share (%) and BPS Analysis by Service Type, 2023 to 2033

Figure 70: Western Europe Market Y-o-Y Growth (%) Projections by Service Type, 2023 to 2033

Figure 71: Western Europe Market Value (US$ Million) Analysis by Delivery Mode, 2018 to 2033

Figure 72: Western Europe Market Value Share (%) and BPS Analysis by Delivery Mode, 2023 to 2033

Figure 73: Western Europe Market Y-o-Y Growth (%) Projections by Delivery Mode, 2023 to 2033

Figure 74: Western Europe Market Value (US$ Million) Analysis by End User , 2018 to 2033

Figure 75: Western Europe Market Value Share (%) and BPS Analysis by End User , 2023 to 2033

Figure 76: Western Europe Market Y-o-Y Growth (%) Projections by End User , 2023 to 2033

Figure 77: Western Europe Market Attractiveness by Service Type, 2023 to 2033

Figure 78: Western Europe Market Attractiveness by Delivery Mode, 2023 to 2033

Figure 79: Western Europe Market Attractiveness by End User , 2023 to 2033

Figure 80: Western Europe Market Attractiveness by Country, 2023 to 2033

Figure 81: Eastern Europe Market Value (US$ Million) by Service Type, 2023 to 2033

Figure 82: Eastern Europe Market Value (US$ Million) by Delivery Mode, 2023 to 2033

Figure 83: Eastern Europe Market Value (US$ Million) by End User , 2023 to 2033

Figure 84: Eastern Europe Market Value (US$ Million) by Country, 2023 to 2033

Figure 85: Eastern Europe Market Value (US$ Million) Analysis by Country, 2018 to 2033

Figure 86: Eastern Europe Market Value Share (%) and BPS Analysis by Country, 2023 to 2033

Figure 87: Eastern Europe Market Y-o-Y Growth (%) Projections by Country, 2023 to 2033

Figure 88: Eastern Europe Market Value (US$ Million) Analysis by Service Type, 2018 to 2033

Figure 89: Eastern Europe Market Value Share (%) and BPS Analysis by Service Type, 2023 to 2033

Figure 90: Eastern Europe Market Y-o-Y Growth (%) Projections by Service Type, 2023 to 2033

Figure 91: Eastern Europe Market Value (US$ Million) Analysis by Delivery Mode, 2018 to 2033

Figure 92: Eastern Europe Market Value Share (%) and BPS Analysis by Delivery Mode, 2023 to 2033

Figure 93: Eastern Europe Market Y-o-Y Growth (%) Projections by Delivery Mode, 2023 to 2033

Figure 94: Eastern Europe Market Value (US$ Million) Analysis by End User , 2018 to 2033

Figure 95: Eastern Europe Market Value Share (%) and BPS Analysis by End User , 2023 to 2033

Figure 96: Eastern Europe Market Y-o-Y Growth (%) Projections by End User , 2023 to 2033

Figure 97: Eastern Europe Market Attractiveness by Service Type, 2023 to 2033

Figure 98: Eastern Europe Market Attractiveness by Delivery Mode, 2023 to 2033

Figure 99: Eastern Europe Market Attractiveness by End User , 2023 to 2033

Figure 100: Eastern Europe Market Attractiveness by Country, 2023 to 2033

Figure 101: South Asia and Pacific Market Value (US$ Million) by Service Type, 2023 to 2033

Figure 102: South Asia and Pacific Market Value (US$ Million) by Delivery Mode, 2023 to 2033

Figure 103: South Asia and Pacific Market Value (US$ Million) by End User , 2023 to 2033

Figure 104: South Asia and Pacific Market Value (US$ Million) by Country, 2023 to 2033

Figure 105: South Asia and Pacific Market Value (US$ Million) Analysis by Country, 2018 to 2033

Figure 106: South Asia and Pacific Market Value Share (%) and BPS Analysis by Country, 2023 to 2033

Figure 107: South Asia and Pacific Market Y-o-Y Growth (%) Projections by Country, 2023 to 2033

Figure 108: South Asia and Pacific Market Value (US$ Million) Analysis by Service Type, 2018 to 2033

Figure 109: South Asia and Pacific Market Value Share (%) and BPS Analysis by Service Type, 2023 to 2033

Figure 110: South Asia and Pacific Market Y-o-Y Growth (%) Projections by Service Type, 2023 to 2033

Figure 111: South Asia and Pacific Market Value (US$ Million) Analysis by Delivery Mode, 2018 to 2033

Figure 112: South Asia and Pacific Market Value Share (%) and BPS Analysis by Delivery Mode, 2023 to 2033

Figure 113: South Asia and Pacific Market Y-o-Y Growth (%) Projections by Delivery Mode, 2023 to 2033

Figure 114: South Asia and Pacific Market Value (US$ Million) Analysis by End User , 2018 to 2033

Figure 115: South Asia and Pacific Market Value Share (%) and BPS Analysis by End User , 2023 to 2033

Figure 116: South Asia and Pacific Market Y-o-Y Growth (%) Projections by End User , 2023 to 2033

Figure 117: South Asia and Pacific Market Attractiveness by Service Type, 2023 to 2033

Figure 118: South Asia and Pacific Market Attractiveness by Delivery Mode, 2023 to 2033

Figure 119: South Asia and Pacific Market Attractiveness by End User , 2023 to 2033

Figure 120: South Asia and Pacific Market Attractiveness by Country, 2023 to 2033

Figure 121: East Asia Market Value (US$ Million) by Service Type, 2023 to 2033

Figure 122: East Asia Market Value (US$ Million) by Delivery Mode, 2023 to 2033

Figure 123: East Asia Market Value (US$ Million) by End User , 2023 to 2033

Figure 124: East Asia Market Value (US$ Million) by Country, 2023 to 2033

Figure 125: East Asia Market Value (US$ Million) Analysis by Country, 2018 to 2033

Figure 126: East Asia Market Value Share (%) and BPS Analysis by Country, 2023 to 2033

Figure 127: East Asia Market Y-o-Y Growth (%) Projections by Country, 2023 to 2033

Figure 128: East Asia Market Value (US$ Million) Analysis by Service Type, 2018 to 2033

Figure 129: East Asia Market Value Share (%) and BPS Analysis by Service Type, 2023 to 2033

Figure 130: East Asia Market Y-o-Y Growth (%) Projections by Service Type, 2023 to 2033

Figure 131: East Asia Market Value (US$ Million) Analysis by Delivery Mode, 2018 to 2033

Figure 132: East Asia Market Value Share (%) and BPS Analysis by Delivery Mode, 2023 to 2033

Figure 133: East Asia Market Y-o-Y Growth (%) Projections by Delivery Mode, 2023 to 2033

Figure 134: East Asia Market Value (US$ Million) Analysis by End User , 2018 to 2033

Figure 135: East Asia Market Value Share (%) and BPS Analysis by End User , 2023 to 2033

Figure 136: East Asia Market Y-o-Y Growth (%) Projections by End User , 2023 to 2033

Figure 137: East Asia Market Attractiveness by Service Type, 2023 to 2033

Figure 138: East Asia Market Attractiveness by Delivery Mode, 2023 to 2033

Figure 139: East Asia Market Attractiveness by End User , 2023 to 2033

Figure 140: East Asia Market Attractiveness by Country, 2023 to 2033

Figure 141: Middle East and Africa Market Value (US$ Million) by Service Type, 2023 to 2033

Figure 142: Middle East and Africa Market Value (US$ Million) by Delivery Mode, 2023 to 2033

Figure 143: Middle East and Africa Market Value (US$ Million) by End User , 2023 to 2033

Figure 144: Middle East and Africa Market Value (US$ Million) by Country, 2023 to 2033

Figure 145: Middle East and Africa Market Value (US$ Million) Analysis by Country, 2018 to 2033

Figure 146: Middle East and Africa Market Value Share (%) and BPS Analysis by Country, 2023 to 2033

Figure 147: Middle East and Africa Market Y-o-Y Growth (%) Projections by Country, 2023 to 2033

Figure 148: Middle East and Africa Market Value (US$ Million) Analysis by Service Type, 2018 to 2033

Figure 149: Middle East and Africa Market Value Share (%) and BPS Analysis by Service Type, 2023 to 2033

Figure 150: Middle East and Africa Market Y-o-Y Growth (%) Projections by Service Type, 2023 to 2033

Figure 151: Middle East and Africa Market Value (US$ Million) Analysis by Delivery Mode, 2018 to 2033

Figure 152: Middle East and Africa Market Value Share (%) and BPS Analysis by Delivery Mode, 2023 to 2033

Figure 153: Middle East and Africa Market Y-o-Y Growth (%) Projections by Delivery Mode, 2023 to 2033

Figure 154: Middle East and Africa Market Value (US$ Million) Analysis by End User , 2018 to 2033

Figure 155: Middle East and Africa Market Value Share (%) and BPS Analysis by End User , 2023 to 2033

Figure 156: Middle East and Africa Market Y-o-Y Growth (%) Projections by End User , 2023 to 2033

Figure 157: Middle East and Africa Market Attractiveness by Service Type, 2023 to 2033

Figure 158: Middle East and Africa Market Attractiveness by Delivery Mode, 2023 to 2033

Figure 159: Middle East and Africa Market Attractiveness by End User , 2023 to 2033

Figure 160: Middle East and Africa Market Attractiveness by Country, 2023 to 2033

Recommendations

Healthcare

Chronic Granulomatous Disease (CGD) Management Market

Published : January 2023

Explore Healthcare Insights

View Reports

Chronic Disease Management Market