Reports

- Global Locations -

Headquarters

Future Market Insights, Inc.

Christiana Corporate, 200
Continental Drive, Suite 401,
Newark, Delaware - 19713,
United States

T: +1-845-579-5705

Americas

Future Market Insights, Inc.

616 Corporate Way, Suite 2-9018,
Valley Cottage, NY 10989, United States

T: +1-347-918-3531

MEA

Future Market Insights

1602-6 Jumeirah Bay X2 Tower, Plot No: JLT-PH2-X2A,
Jumeirah Lakes Towers, Dubai,
United Arab Emirates

Europe

Future Market Insights

3rd Floor, 207 Regent Street,
W1B 3HH London
United Kingdom

T: + 44 (0) 20 8123 9659
D: +44 (0) 20 3287 4268

Asia Pacific

Future Market Insights

IndiaLand Global Tech Park, Unit UG-1, Behind Grand HighStreet, Phase 1, Hinjawadi, MH, Pune – 411057, India

Chronic Hepatitis B Virus Testing Market Snapshot

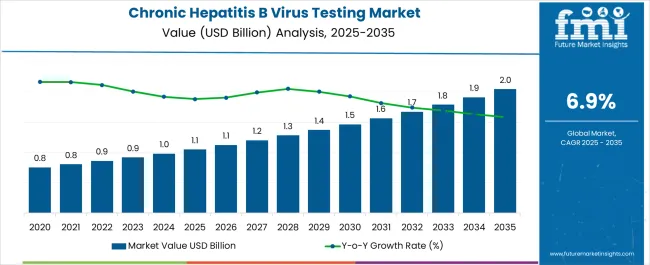
The global Chronic Hepatitis B Virus Testing market garnered a market value of US$ 919 Million in 2023 and is expected to accumulate a market value of US$ 1790 Million by registering a CAGR of 6.9% in the forecast period 2023 to 2033. Growth of the Chronic Hepatitis B Virus Testing market can be attributed to technological advancement in diagnostic tools along with increased awareness regarding testing methodologies. The market for Chronic Hepatitis B Virus Testing registered a CAGR of 5.1% in the historical period 2018 to 2022

Chronic Hepatitis B Virus (HBV) testing refers to a series of laboratory tests that detect the presence of the virus in the blood over an extended period. Chronic hepatitis B is a condition in which the HBV infection lasts for more than six months.

Chronic HBV testing typically involves blood tests that detect various markers of the virus, including the hepatitis B surface antigen (HBsAg), the hepatitis B core antibody (anti-HBc), the hepatitis B e antigen (HBeAg), and the hepatitis B surface antibody (anti-HBs). These markers help to determine the stage and severity of the infection, as well as the risk of transmission to others.

Testing for chronic HBV is crucial because it can lead to severe liver damage, including cirrhosis and liver cancer, if left untreated. Early detection of the infection can help to manage the condition and prevent complications. Treatment options for chronic HBV include antiviral medications and regular monitoring of liver function.

Report Attribute Details
Expected Market Value (2023) US$ 919 Million
Anticipated Forecast Value (2033) US$ 1790 Million
Projected Growth Rate (2023 to 2033) 6.9% CAGR

Don't pay for what you don't need

Customize your report by selecting specific countries or regions and save 30%!

2018 to 2022 Chronic Hepatitis B Virus Testing Market Demand Analysis vs. Forecast 2023 to 2033

According to market research and competitive intelligence provider Future Market Insights- the market for Chronic Hepatitis B Virus Testing reflected a value of 5.1% during the historical period, 2018 to 2022.

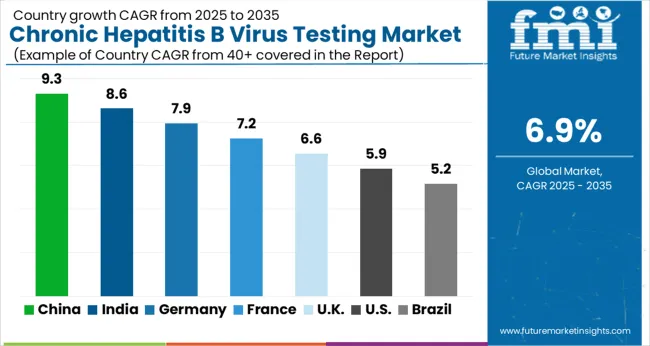
The growth of the market is driven by several factors such as the increasing prevalence of chronic HBV infections, the rising demand for early diagnosis, and the development of advanced diagnostic technologies. The North America region accounted for the largest share of the market, followed by Europe. This was attributed to the high prevalence of chronic HBV infections in countries such as USA and Canada, as well as the availability of advanced diagnostic technologies in developed countries.

Thus, the market for Chronic Hepatitis B Virus Testing is expected to register a CAGR of 6.9% in the forecast period 2023 to 2033.

Which are Some Prominent Drivers of Chronic Hepatitis B Virus Testing Market?

Rising demand for early diagnosis spurring the demand for testing services

HBV is one of the most common viral infections worldwide, with an estimated 292 million people living with chronic HBV infections. This high prevalence drives the demand for HBV testing and monitoring, as early diagnosis and treatment are crucial to prevent disease progression. Early diagnosis of chronic HBV infection is critical to prevent complications such as cirrhosis and liver cancer. As a result, there is a growing demand for diagnostic tests that can detect the virus in its early stages.

Advances in diagnostic technologies, such as nucleic acid testing (NAT) and point-of-care testing (POCT), have made it easier and faster to detect HBV infections accurately. These technologies have improved the accuracy and sensitivity of HBV testing, leading to more effective diagnosis and treatment.

Governments around the world have launched various initiatives to control the spread of HBV and improve access to testing and treatment. For example, the World Health Organization (WHO) has set a target to eliminate HBV as a public health threat by 2030, which is likely to drive demand for testing.

Public awareness campaigns and education programs have helped to increase awareness about the importance of HBV testing and treatment. As a result, more people are seeking testing for HBV, driving demand for diagnostic tests.

Development of advanced diagnostic technologies bolstering demand for Chronic Hepatitis B Virus Testing Market

Hepatitis B surface antigen (HBsAg) test: This test detects the presence of the HBV surface antigen in the blood, which indicates an active HBV infection.

Hepatitis B core antibody (anti-HBc) test: This test detects the presence of antibodies to the HBV core antigen, which indicates a previous or ongoing HBV infection.

Hepatitis B surface antibody (anti-HBs) test: This test detects the presence of antibodies to the HBV surface antigen, which indicates immunity to HBV or successful vaccination against HBV.

Hepatitis B e antigen (HBeAg) test: This test detects the presence of the HBeAg protein, which indicates active viral replication and a higher risk of transmitting the virus to others.

Hepatitis B viral load test: This test measures the amount of HBV DNA in the blood, which can help to monitor the progression of the infection and the effectiveness of treatment.

Liver function tests: These tests measure levels of enzymes and proteins in the blood that are produced by the liver, such as alanine aminotransferase (ALT) and aspartate aminotransferase (AST), which can indicate liver damage or disease.

Sabyasachi Ghosh
Sabyasachi Ghosh

Principal Consultant

Talk to Analyst

Find your sweet spots for generating winning opportunities in this market.

What are the Challenges Faced by the Chronic Hepatitis B Virus Testing Market?

Limited access to testing in developing countries along with high cost of testing affecting market growth

Access to testing for chronic HBV infections can be limited in developing countries due to factors such as a lack of healthcare infrastructure, limited resources, and poor public awareness of the disease. The cost of diagnostic tests for chronic HBV infections can be high, which may limit access for some patients, particularly those without adequate insurance coverage.

The accuracy of diagnostic tests for chronic HBV infections can vary, leading to false-positive or false-negative results. This can lead to delays in diagnosis and treatment or unnecessary treatment and monitoring. Stigma and discrimination surrounding HBV infection can deter some patients from seeking testing and treatment, particularly in certain cultures where there may be a strong association between the disease and social stigma.

Many people are unaware of the risk factors for HBV infection and the importance of testing and treatment. This can lead to a lack of demand for testing and lower rates of diagnosis and treatment. While there are treatments available for chronic HBV infection, they may not be effective for all patients and can have significant side effects. This can make it difficult to manage the disease and may limit the effectiveness of testing in some cases.
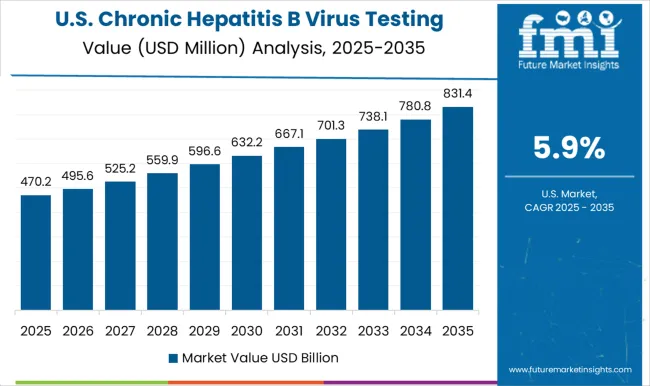
Region-Wise Insights

Large Patient Population and Increasing Awareness Of Chronic Hepatitis B Virus Driving Growth of Market In North America?

Presence of established healthcare infrastructure propelling market growth in North America

The market growth in North America is driven by factors such as the high prevalence of chronic HBV infection in the region, increasing awareness about the importance of early diagnosis and treatment, and the availability of advanced diagnostic technologies. Additionally, the presence of established healthcare infrastructure and favorable government initiatives to control the spread of HBV have contributed to the growth of the market.

Factors such as a large patient population and a strong focus on research and development in the healthcare industry are contributing to the growth of the market. However, the market in Canada is also expected to grow at a significant rate, driven by factors such as increasing public awareness and government initiatives to improve access to testing and treatment.

Overall, the North America Chronic Hepatitis B Virus Testing Market is expected to continue to grow in the coming years, driven by factors such as increasing demand for accurate and reliable diagnostic tests and a growing focus on disease prevention and management in the healthcare industry. Thus, North America is expected to possess 44% market share for Chronic Hepatitis B Virus Testing Market in 2023.

Focus on Early Detection of Hepatitis B Creating Lucrative Opportunities for Chronic Hepatitis B Virus in Europe?

Increasing number of people undergoing HBV testing boosting market growth

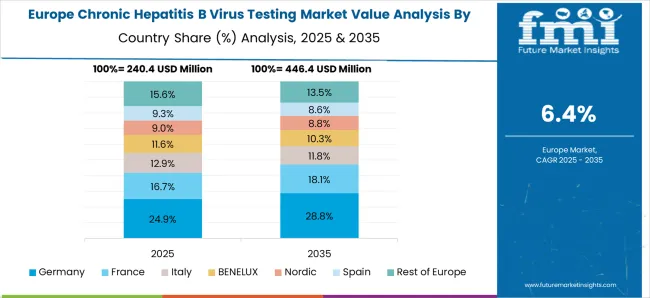
Factors such as increasing demand for accurate and reliable diagnostic tests and a growing focus on disease prevention and management in the healthcare industry is driving the growth of the market in Europe. The market is also expected to grow at a significant rate, driven by factors such as increasing public awareness and government initiatives to improve access to testing and treatment. In addition, the European governments are focusing on developing programs for early detection and treatment of hepatitis B virus infection. This has led to an increase in the number of people undergoing HBV testing, which is driving the growth of the market.

There have been significant advancements in the development of testing technologies for HBV, such as point-of-care tests and nucleic acid testing. This has made testing more accessible and affordable, which has contributed to the growth of the market. Overall, the Europe Chronic Hepatitis B Virus Testing Market is expected to continue to grow in the coming years. Thus, Europe is expected to possess 39% market share for Chronic Hepatitis B Virus Testing Market in 2023.

Get the data you need at a Fraction of the cost

Personalize your report by choosing insights you need
and save 40%!

Category-Wise Insights

Accuracy of EIA Kits Increasing Dependency for Chronic Hepatitis B Virus Testing?

Reliable results maximizing use of EIA kits for testing Chronic Hepatitis B Virus Testing

Enzyme Immunoassay (EIA) kits are widely used for Chronic Hepatitis B Virus (HBV) Testing, and they are considered to be a reliable and accurate option for detecting HBV infection. EIA kits are laboratory-based tests that detect specific antibodies or antigens to HBV in a patient's blood sample.

EIA kits are highly sensitive and specific, meaning that they can accurately detect the presence of HBV in a patient's blood with a low rate of false-positive or false-negative results. They are also easy to use and can provide results within a short period of time, typically within a few hours. Thus, EIA kits are expected to hold 53% market share for Chronic Hepatitis B Virus Testing Market in 2023.

Market Competition

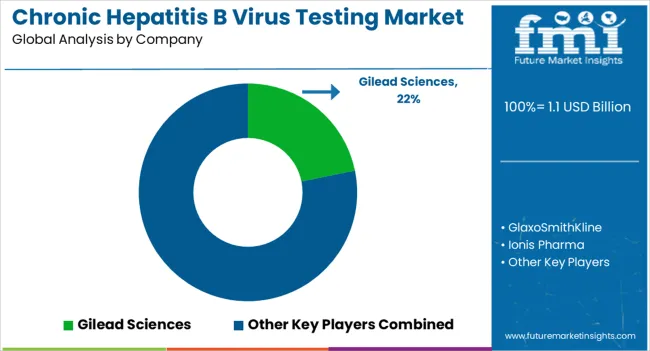
Key players in the Chronic Hepatitis B Virus Testing market are Gilead Sciences, GlaxoSmithKline, Ionis Pharma, Janssen Sciences Ireland, Assembly Biosciences, Janssen and Arrowhead Pharmaceuticals, Roche, Vir Biotechnology, Bio-Rad Laboratories, Inc., DiaSorin S.p.A., Abbott Laboratories, Meridian Bioscience

  • Gilead Sciences has been involved in the development and commercialization of diagnostic tests for HBV infection, including the HBV Confirmatory Test and the HBV Genotyping Test. These tests help to accurately diagnose and characterize HBV infection, which can inform treatment decisions and improve patient outcomes.
  • GlaxoSmithKline has developed Elecsys® HBsAg II assay, a highly sensitive and specific test for the detection of HBV surface antigen (HBsAg) in human serum or plasma. This assay is used for the diagnosis of HBV infection, and it is designed to be compatible with various automated immunoassay analyzers, making it accessible to a broader range of healthcare facilities.

Report Scope

Report Attribute Details
Market Value in 2023 US$ 919 Million
Market Value in 2033 US$ 1790 Million
Growth Rate CAGR of 6.9% from 2023 to 2033
Base Year for Estimation 2022
Historical Data 2018 to 2022
Forecast Period 2023 to 2033
Quantitative Units Revenue in USD Million and CAGR from 2023 to 2033
Report Coverage Revenue Forecast, Volume Forecast, Company Ranking, Competitive Landscape, Growth Factors, Trends and Pricing Analysis
Segments Covered
  • Product Type
  • End User
  • Region
Regions Covered
  • North America
  • Latin America
  • Europe
  • South Asia
  • East Asia
  • Oceania
  • Middle East & Africa
Key Countries Profiled
  • USA
  • Canada
  • Brazil
  • Mexico
  • Rest of Latin America
  • Germany
  • United Kingdom
  • France
  • Spain
  • Italy
  • Rest of Europe
  • India
  • Malaysia
  • Singapore
  • Thailand
  • Rest of South Asia
  • China
  • Japan
  • South Korea
  • Austria
  • New Zealand
  • GCC countries
  • South Africa
  • Israel
  • Rest of MEA
Key Companies Profiled
  • Gilead Sciences
  • GlaxoSmithKline
  • Ionis Pharma
  • Janssen Sciences Ireland
  • Assembly Biosciences
  • Janssen and Arrowhead Pharmaceuticals
  • Roche
  • Vir Biotechnology
  • Bio-Rad Laboratories, Inc.
  • DiaSorin S.p.A.
  • Abbott Laboratories
  • Meridian Bioscience
Customization Available Upon Request

Key Segments Profiled in the Chronic Hepatitis B Virus Testing Market Survey

Product Type:

  • Enzyme Immunoassay Kits
  • Hepatitis B Surface Antigen Test
  • Anti-Hepatitis B Surface Antibody Test
  • Anti-Hepatitis B Core Antibody Test
  • Point-of-Care Testing Kits

End User:

  • Hospitals
  • Clinics
  • Diagnostic Centers
  • Home Care

Region:

  • North America
  • Latin America
  • Europe
  • South Asia
  • East Asia
  • Oceania
  • Middle East & Africa

Frequently Asked Questions

How Big will the Chronic Hepatitis B Virus Testing Market by 2033?

The market is estimated to reach US$ 1,790 million by 2033.

Which Factors are Driving the North America’s Market?

The presence of established healthcare infrastructure propels market growth.

What Restrains the Market Growth?

Limited access to testing in developing countries restrains market growth.

Which is the Top Driver in the Market?

Rising demand for early diagnosis spurs the demand for testing services.

Which Region holds Lucrative Opportunities?

North America holds a substantial share of the market.

Table of Content

1. Executive Summary | Chronic Hepatitis B Virus Testing Market

    1.1. Global Market Outlook

    1.2. Demand-side Trends

    1.3. Supply-side Trends

    1.4. Technology Roadmap Analysis

    1.5. Analysis and Recommendations

2. Market Overview

    2.1. Market Coverage / Taxonomy

    2.2. Market Definition / Scope / Limitations

3. Market Background

    3.1. Market Dynamics

        3.1.1. Drivers

        3.1.2. Restraints

        3.1.3. Opportunity

        3.1.4. Trends

    3.2. Scenario Forecast

        3.2.1. Demand in Optimistic Scenario

        3.2.2. Demand in Likely Scenario

        3.2.3. Demand in Conservative Scenario

    3.3. Opportunity Map Analysis

    3.4. Investment Feasibility Matrix

    3.5. PESTLE and Porter’s Analysis

    3.6. Regulatory Landscape

        3.6.1. By Key Regions

        3.6.2. By Key Countries

    3.7. Regional Parent Market Outlook

4. Global Market Analysis 2018 to 2022 and Forecast, 2023 to 2033

    4.1. Historical Market Size Value (US$ Million) Analysis, 2018 to 2022

    4.2. Current and Future Market Size Value (US$ Million) Projections, 2023 to 2033

        4.2.1. Y-o-Y Growth Trend Analysis

        4.2.2. Absolute $ Opportunity Analysis

5. Global Market Analysis 2018 to 2022 and Forecast 2023 to 2033, By Product Type

    5.1. Introduction / Key Findings

    5.2. Historical Market Size Value (US$ Million) Analysis By Product Type, 2018 to 2022

    5.3. Current and Future Market Size Value (US$ Million) Analysis and Forecast By Product Type, 2023 to 2033

        5.3.1. Enzyme Immunoassay Kits

            5.3.1.1. Hepatitis B Surface Antigen Test

            5.3.1.2. Anti-Hepatitis B Surface Antibody Test

            5.3.1.3. Anti-Hepatitis B Core Antibody Test

        5.3.2. Point-of-Care Testing Kits

    5.4. Y-o-Y Growth Trend Analysis By Product Type, 2018 to 2022

    5.5. Absolute $ Opportunity Analysis By Product Type, 2023 to 2033

6. Global Market Analysis 2018 to 2022 and Forecast 2023 to 2033, ByEnd User

    6.1. Introduction / Key Findings

    6.2. Historical Market Size Value (US$ Million) Analysis ByEnd User, 2018 to 2022

    6.3. Current and Future Market Size Value (US$ Million) Analysis and Forecast ByEnd User, 2023 to 2033

        6.3.1. Hospitals

        6.3.2. Clinics

        6.3.3. Diagnostic Centres

        6.3.4. Home Care

    6.4. Y-o-Y Growth Trend Analysis ByEnd User, 2018 to 2022

    6.5. Absolute $ Opportunity Analysis ByEnd User, 2023 to 2033

7. Global Market Anayslis 2018 to 2022 and Forecast 2023 to 2033, By Region

    7.1. Introduction

    7.2. Historical Market Size Value (US$ Million) Analysis By Region, 2018 to 2022

    7.3. Current Market Size Value (US$ Million) Analysis and Forecast By Region, 2023 to 2033

        7.3.1. North America

        7.3.2. Latin America

        7.3.3. Europe

        7.3.4. South Asia

        7.3.5. East Asia

        7.3.6. Oceania

        7.3.7. MEA

    7.4. Market Attractiveness Analysis By Region

8. North America Market Analysis 2018 to 2022 and Forecast 2023 to 2033, By Country

    8.1. Historical Market Size Value (US$ Million) Trend Analysis By Market Taxonomy, 2018 to 2022

    8.2. Market Size Value (US$ Million) Forecast By Market Taxonomy, 2023 to 2033

        8.2.1. By Country

            8.2.1.1. U.S.

            8.2.1.2. Canada

        8.2.2. By Product Type

        8.2.3. ByEnd User

    8.3. Market Attractiveness Analysis

        8.3.1. By Country

        8.3.2. By Product Type

        8.3.3. ByEnd User

    8.4. Key Takeaways

9. Latin America Market Analysis 2018 to 2022 and Forecast 2023 to 2033, By Country

    9.1. Historical Market Size Value (US$ Million) Trend Analysis By Market Taxonomy, 2018 to 2022

    9.2. Market Size Value (US$ Million) Forecast By Market Taxonomy, 2023 to 2033

        9.2.1. By Country

            9.2.1.1. Brazil

            9.2.1.2. Mexico

            9.2.1.3. Rest of Latin America

        9.2.2. By Product Type

        9.2.3. ByEnd User

    9.3. Market Attractiveness Analysis

        9.3.1. By Country

        9.3.2. By Product Type

        9.3.3. ByEnd User

    9.4. Key Takeaways

10. Europe Market Analysis 2018 to 2022 and Forecast 2023 to 2033, By Country

    10.1. Historical Market Size Value (US$ Million) Trend Analysis By Market Taxonomy, 2018 to 2022

    10.2. Market Size Value (US$ Million) Forecast By Market Taxonomy, 2023 to 2033

        10.2.1. By Country

            10.2.1.1. Germany

            10.2.1.2. U.K.

            10.2.1.3. France

            10.2.1.4. Spain

            10.2.1.5. Italy

            10.2.1.6. Rest of Europe

        10.2.2. By Product Type

        10.2.3. ByEnd User

    10.3. Market Attractiveness Analysis

        10.3.1. By Country

        10.3.2. By Product Type

        10.3.3. ByEnd User

    10.4. Key Takeaways

11. South Asia Market Analysis 2018 to 2022 and Forecast 2023 to 2033, By Country

    11.1. Historical Market Size Value (US$ Million) Trend Analysis By Market Taxonomy, 2018 to 2022

    11.2. Market Size Value (US$ Million) Forecast By Market Taxonomy, 2023 to 2033

        11.2.1. By Country

            11.2.1.1. India

            11.2.1.2. Malaysia

            11.2.1.3. Singapore

            11.2.1.4. Thailand

            11.2.1.5. Rest of South Asia

        11.2.2. By Product Type

        11.2.3. ByEnd User

    11.3. Market Attractiveness Analysis

        11.3.1. By Country

        11.3.2. By Product Type

        11.3.3. ByEnd User

    11.4. Key Takeaways

12. East Asia Market Analysis 2018 to 2022 and Forecast 2023 to 2033, By Country

    12.1. Historical Market Size Value (US$ Million) Trend Analysis By Market Taxonomy, 2018 to 2022

    12.2. Market Size Value (US$ Million) Forecast By Market Taxonomy, 2023 to 2033

        12.2.1. By Country

            12.2.1.1. China

            12.2.1.2. Japan

            12.2.1.3. South Korea

        12.2.2. By Product Type

        12.2.3. ByEnd User

    12.3. Market Attractiveness Analysis

        12.3.1. By Country

        12.3.2. By Product Type

        12.3.3. ByEnd User

    12.4. Key Takeaways

13. Oceania Market Analysis 2018 to 2022 and Forecast 2023 to 2033, By Country

    13.1. Historical Market Size Value (US$ Million) Trend Analysis By Market Taxonomy, 2018 to 2022

    13.2. Market Size Value (US$ Million) Forecast By Market Taxonomy, 2023 to 2033

        13.2.1. By Country

            13.2.1.1. Australia

            13.2.1.2. New Zealand

        13.2.2. By Product Type

        13.2.3. ByEnd User

    13.3. Market Attractiveness Analysis

        13.3.1. By Country

        13.3.2. By Product Type

        13.3.3. ByEnd User

    13.4. Key Takeaways

14. MEA Market Analysis 2018 to 2022 and Forecast 2023 to 2033, By Country

    14.1. Historical Market Size Value (US$ Million) Trend Analysis By Market Taxonomy, 2018 to 2022

    14.2. Market Size Value (US$ Million) Forecast By Market Taxonomy, 2023 to 2033

        14.2.1. By Country

            14.2.1.1. GCC Countries

            14.2.1.2. South Africa

            14.2.1.3. Israel

            14.2.1.4. Rest of MEA

        14.2.2. By Product Type

        14.2.3. ByEnd User

    14.3. Market Attractiveness Analysis

        14.3.1. By Country

        14.3.2. By Product Type

        14.3.3. ByEnd User

    14.4. Key Takeaways

15. Key Countries Market Analysis

    15.1. U.S.

        15.1.1. Pricing Analysis

        15.1.2. Market Share Analysis, 2022

            15.1.2.1. By Product Type

            15.1.2.2. ByEnd User

    15.2. Canada

        15.2.1. Pricing Analysis

        15.2.2. Market Share Analysis, 2022

            15.2.2.1. By Product Type

            15.2.2.2. ByEnd User

    15.3. Brazil

        15.3.1. Pricing Analysis

        15.3.2. Market Share Analysis, 2022

            15.3.2.1. By Product Type

            15.3.2.2. ByEnd User

    15.4. Mexico

        15.4.1. Pricing Analysis

        15.4.2. Market Share Analysis, 2022

            15.4.2.1. By Product Type

            15.4.2.2. ByEnd User

    15.5. Germany

        15.5.1. Pricing Analysis

        15.5.2. Market Share Analysis, 2022

            15.5.2.1. By Product Type

            15.5.2.2. ByEnd User

    15.6. U.K.

        15.6.1. Pricing Analysis

        15.6.2. Market Share Analysis, 2022

            15.6.2.1. By Product Type

            15.6.2.2. ByEnd User

    15.7. France

        15.7.1. Pricing Analysis

        15.7.2. Market Share Analysis, 2022

            15.7.2.1. By Product Type

            15.7.2.2. ByEnd User

    15.8. Spain

        15.8.1. Pricing Analysis

        15.8.2. Market Share Analysis, 2022

            15.8.2.1. By Product Type

            15.8.2.2. ByEnd User

    15.9. Italy

        15.9.1. Pricing Analysis

        15.9.2. Market Share Analysis, 2022

            15.9.2.1. By Product Type

            15.9.2.2. ByEnd User

    15.10. India

        15.10.1. Pricing Analysis

        15.10.2. Market Share Analysis, 2022

            15.10.2.1. By Product Type

            15.10.2.2. ByEnd User

    15.11. Malaysia

        15.11.1. Pricing Analysis

        15.11.2. Market Share Analysis, 2022

            15.11.2.1. By Product Type

            15.11.2.2. ByEnd User

    15.12. Singapore

        15.12.1. Pricing Analysis

        15.12.2. Market Share Analysis, 2022

            15.12.2.1. By Product Type

            15.12.2.2. ByEnd User

    15.13. Thailand

        15.13.1. Pricing Analysis

        15.13.2. Market Share Analysis, 2022

            15.13.2.1. By Product Type

            15.13.2.2. ByEnd User

    15.14. China

        15.14.1. Pricing Analysis

        15.14.2. Market Share Analysis, 2022

            15.14.2.1. By Product Type

            15.14.2.2. ByEnd User

    15.15. Japan

        15.15.1. Pricing Analysis

        15.15.2. Market Share Analysis, 2022

            15.15.2.1. By Product Type

            15.15.2.2. ByEnd User

    15.16. South Korea

        15.16.1. Pricing Analysis

        15.16.2. Market Share Analysis, 2022

            15.16.2.1. By Product Type

            15.16.2.2. ByEnd User

    15.17. Australia

        15.17.1. Pricing Analysis

        15.17.2. Market Share Analysis, 2022

            15.17.2.1. By Product Type

            15.17.2.2. ByEnd User

    15.18. New Zealand

        15.18.1. Pricing Analysis

        15.18.2. Market Share Analysis, 2022

            15.18.2.1. By Product Type

            15.18.2.2. ByEnd User

    15.19. GCC Countries

        15.19.1. Pricing Analysis

        15.19.2. Market Share Analysis, 2022

            15.19.2.1. By Product Type

            15.19.2.2. ByEnd User

    15.20. South Africa

        15.20.1. Pricing Analysis

        15.20.2. Market Share Analysis, 2022

            15.20.2.1. By Product Type

            15.20.2.2. ByEnd User

    15.21. Israel

        15.21.1. Pricing Analysis

        15.21.2. Market Share Analysis, 2022

            15.21.2.1. By Product Type

            15.21.2.2. ByEnd User

16. Market Structure Analysis

    16.1. Competition Dashboard

    16.2. Competition Benchmarking

    16.3. Market Share Analysis of Top Players

        16.3.1. By Regional

        16.3.2. By Product Type

        16.3.3. ByEnd User

17. Competition Analysis

    17.1. Competition Deep Dive

        17.1.1. Gilead Sciences

            17.1.1.1. Overview

            17.1.1.2. Product Portfolio

            17.1.1.3. Profitability by Market Segments

            17.1.1.4. Sales Footprint

            17.1.1.5. Strategy Overview

                17.1.1.5.1. Marketing Strategy

        17.1.2. GlaxoSmithKline

            17.1.2.1. Overview

            17.1.2.2. Product Portfolio

            17.1.2.3. Profitability by Market Segments

            17.1.2.4. Sales Footprint

            17.1.2.5. Strategy Overview

                17.1.2.5.1. Marketing Strategy

        17.1.3. Ionis Pharma

            17.1.3.1. Overview

            17.1.3.2. Product Portfolio

            17.1.3.3. Profitability by Market Segments

            17.1.3.4. Sales Footprint

            17.1.3.5. Strategy Overview

                17.1.3.5.1. Marketing Strategy

        17.1.4. Janssen Sciences Ireland

            17.1.4.1. Overview

            17.1.4.2. Product Portfolio

            17.1.4.3. Profitability by Market Segments

            17.1.4.4. Sales Footprint

            17.1.4.5. Strategy Overview

                17.1.4.5.1. Marketing Strategy

        17.1.5. Assembly Biosciences

            17.1.5.1. Overview

            17.1.5.2. Product Portfolio

            17.1.5.3. Profitability by Market Segments

            17.1.5.4. Sales Footprint

            17.1.5.5. Strategy Overview

                17.1.5.5.1. Marketing Strategy

        17.1.6. Janssen and Arrowhead Pharmaceuticals

            17.1.6.1. Overview

            17.1.6.2. Product Portfolio

            17.1.6.3. Profitability by Market Segments

            17.1.6.4. Sales Footprint

            17.1.6.5. Strategy Overview

                17.1.6.5.1. Marketing Strategy

        17.1.7. Roche

            17.1.7.1. Overview

            17.1.7.2. Product Portfolio

            17.1.7.3. Profitability by Market Segments

            17.1.7.4. Sales Footprint

            17.1.7.5. Strategy Overview

                17.1.7.5.1. Marketing Strategy

        17.1.8. Vir Biotechnology

            17.1.8.1. Overview

            17.1.8.2. Product Portfolio

            17.1.8.3. Profitability by Market Segments

            17.1.8.4. Sales Footprint

            17.1.8.5. Strategy Overview

                17.1.8.5.1. Marketing Strategy

        17.1.9. Bio-Rad Laboratories, Inc.

            17.1.9.1. Overview

            17.1.9.2. Product Portfolio

            17.1.9.3. Profitability by Market Segments

            17.1.9.4. Sales Footprint

            17.1.9.5. Strategy Overview

                17.1.9.5.1. Marketing Strategy

        17.1.10. DiaSorin S.p.A.

            17.1.10.1. Overview

            17.1.10.2. Product Portfolio

            17.1.10.3. Profitability by Market Segments

            17.1.10.4. Sales Footprint

            17.1.10.5. Strategy Overview

                17.1.10.5.1. Marketing Strategy

        17.1.11. Abbott Laboratories

            17.1.11.1. Overview

            17.1.11.2. Product Portfolio

            17.1.11.3. Profitability by Market Segments

            17.1.11.4. Sales Footprint

            17.1.11.5. Strategy Overview

                17.1.11.5.1. Marketing Strategy

        17.1.12. Meridian Bioscience

            17.1.12.1. Overview

            17.1.12.2. Product Portfolio

            17.1.12.3. Profitability by Market Segments

            17.1.12.4. Sales Footprint

            17.1.12.5. Strategy Overview

                17.1.12.5.1. Marketing Strategy

18. Assumptions & Acronyms Used

19. Research Methodology

List of Tables

Table 1: Global Market Value (US$ Million) Forecast by Region, 2018 to 2033

Table 2: Global Market Value (US$ Million) Forecast by Product Type, 2018 to 2033

Table 3: Global Market Value (US$ Million) Forecast by End User, 2018 to 2033

Table 4: North America Market Value (US$ Million) Forecast by Country, 2018 to 2033

Table 5: North America Market Value (US$ Million) Forecast by Product Type, 2018 to 2033

Table 6: North America Market Value (US$ Million) Forecast by End User, 2018 to 2033

Table 7: Latin America Market Value (US$ Million) Forecast by Country, 2018 to 2033

Table 8: Latin America Market Value (US$ Million) Forecast by Product Type, 2018 to 2033

Table 9: Latin America Market Value (US$ Million) Forecast by End User, 2018 to 2033

Table 10: Europe Market Value (US$ Million) Forecast by Country, 2018 to 2033

Table 11: Europe Market Value (US$ Million) Forecast by Product Type, 2018 to 2033

Table 12: Europe Market Value (US$ Million) Forecast by End User, 2018 to 2033

Table 13: South Asia Market Value (US$ Million) Forecast by Country, 2018 to 2033

Table 14: South Asia Market Value (US$ Million) Forecast by Product Type, 2018 to 2033

Table 15: South Asia Market Value (US$ Million) Forecast by End User, 2018 to 2033

Table 16: East Asia Market Value (US$ Million) Forecast by Country, 2018 to 2033

Table 17: East Asia Market Value (US$ Million) Forecast by Product Type, 2018 to 2033

Table 18: East Asia Market Value (US$ Million) Forecast by End User, 2018 to 2033

Table 19: Oceania Market Value (US$ Million) Forecast by Country, 2018 to 2033

Table 20: Oceania Market Value (US$ Million) Forecast by Product Type, 2018 to 2033

Table 21: Oceania Market Value (US$ Million) Forecast by End User, 2018 to 2033

Table 22: MEA Market Value (US$ Million) Forecast by Country, 2018 to 2033

Table 23: MEA Market Value (US$ Million) Forecast by Product Type, 2018 to 2033

Table 24: MEA Market Value (US$ Million) Forecast by End User, 2018 to 2033

List of Charts

Figure 1: Global Market Value (US$ Million) by Product Type, 2023 to 2033

Figure 2: Global Market Value (US$ Million) by End User, 2023 to 2033

Figure 3: Global Market Value (US$ Million) by Region, 2023 to 2033

Figure 4: Global Market Value (US$ Million) Analysis by Region, 2018 to 2033

Figure 5: Global Market Value Share (%) and BPS Analysis by Region, 2023 to 2033

Figure 6: Global Market Y-o-Y Growth (%) Projections by Region, 2023 to 2033

Figure 7: Global Market Value (US$ Million) Analysis by Product Type, 2018 to 2033

Figure 8: Global Market Value Share (%) and BPS Analysis by Product Type, 2023 to 2033

Figure 9: Global Market Y-o-Y Growth (%) Projections by Product Type, 2023 to 2033

Figure 10: Global Market Value (US$ Million) Analysis by End User, 2018 to 2033

Figure 11: Global Market Value Share (%) and BPS Analysis by End User, 2023 to 2033

Figure 12: Global Market Y-o-Y Growth (%) Projections by End User, 2023 to 2033

Figure 13: Global Market Attractiveness by Product Type, 2023 to 2033

Figure 14: Global Market Attractiveness by End User, 2023 to 2033

Figure 15: Global Market Attractiveness by Region, 2023 to 2033

Figure 16: North America Market Value (US$ Million) by Product Type, 2023 to 2033

Figure 17: North America Market Value (US$ Million) by End User, 2023 to 2033

Figure 18: North America Market Value (US$ Million) by Country, 2023 to 2033

Figure 19: North America Market Value (US$ Million) Analysis by Country, 2018 to 2033

Figure 20: North America Market Value Share (%) and BPS Analysis by Country, 2023 to 2033

Figure 21: North America Market Y-o-Y Growth (%) Projections by Country, 2023 to 2033

Figure 22: North America Market Value (US$ Million) Analysis by Product Type, 2018 to 2033

Figure 23: North America Market Value Share (%) and BPS Analysis by Product Type, 2023 to 2033

Figure 24: North America Market Y-o-Y Growth (%) Projections by Product Type, 2023 to 2033

Figure 25: North America Market Value (US$ Million) Analysis by End User, 2018 to 2033

Figure 26: North America Market Value Share (%) and BPS Analysis by End User, 2023 to 2033

Figure 27: North America Market Y-o-Y Growth (%) Projections by End User, 2023 to 2033

Figure 28: North America Market Attractiveness by Product Type, 2023 to 2033

Figure 29: North America Market Attractiveness by End User, 2023 to 2033

Figure 30: North America Market Attractiveness by Country, 2023 to 2033

Figure 31: Latin America Market Value (US$ Million) by Product Type, 2023 to 2033

Figure 32: Latin America Market Value (US$ Million) by End User, 2023 to 2033

Figure 33: Latin America Market Value (US$ Million) by Country, 2023 to 2033

Figure 34: Latin America Market Value (US$ Million) Analysis by Country, 2018 to 2033

Figure 35: Latin America Market Value Share (%) and BPS Analysis by Country, 2023 to 2033

Figure 36: Latin America Market Y-o-Y Growth (%) Projections by Country, 2023 to 2033

Figure 37: Latin America Market Value (US$ Million) Analysis by Product Type, 2018 to 2033

Figure 38: Latin America Market Value Share (%) and BPS Analysis by Product Type, 2023 to 2033

Figure 39: Latin America Market Y-o-Y Growth (%) Projections by Product Type, 2023 to 2033

Figure 40: Latin America Market Value (US$ Million) Analysis by End User, 2018 to 2033

Figure 41: Latin America Market Value Share (%) and BPS Analysis by End User, 2023 to 2033

Figure 42: Latin America Market Y-o-Y Growth (%) Projections by End User, 2023 to 2033

Figure 43: Latin America Market Attractiveness by Product Type, 2023 to 2033

Figure 44: Latin America Market Attractiveness by End User, 2023 to 2033

Figure 45: Latin America Market Attractiveness by Country, 2023 to 2033

Figure 46: Europe Market Value (US$ Million) by Product Type, 2023 to 2033

Figure 47: Europe Market Value (US$ Million) by End User, 2023 to 2033

Figure 48: Europe Market Value (US$ Million) by Country, 2023 to 2033

Figure 49: Europe Market Value (US$ Million) Analysis by Country, 2018 to 2033

Figure 50: Europe Market Value Share (%) and BPS Analysis by Country, 2023 to 2033

Figure 51: Europe Market Y-o-Y Growth (%) Projections by Country, 2023 to 2033

Figure 52: Europe Market Value (US$ Million) Analysis by Product Type, 2018 to 2033

Figure 53: Europe Market Value Share (%) and BPS Analysis by Product Type, 2023 to 2033

Figure 54: Europe Market Y-o-Y Growth (%) Projections by Product Type, 2023 to 2033

Figure 55: Europe Market Value (US$ Million) Analysis by End User, 2018 to 2033

Figure 56: Europe Market Value Share (%) and BPS Analysis by End User, 2023 to 2033

Figure 57: Europe Market Y-o-Y Growth (%) Projections by End User, 2023 to 2033

Figure 58: Europe Market Attractiveness by Product Type, 2023 to 2033

Figure 59: Europe Market Attractiveness by End User, 2023 to 2033

Figure 60: Europe Market Attractiveness by Country, 2023 to 2033

Figure 61: South Asia Market Value (US$ Million) by Product Type, 2023 to 2033

Figure 62: South Asia Market Value (US$ Million) by End User, 2023 to 2033

Figure 63: South Asia Market Value (US$ Million) by Country, 2023 to 2033

Figure 64: South Asia Market Value (US$ Million) Analysis by Country, 2018 to 2033

Figure 65: South Asia Market Value Share (%) and BPS Analysis by Country, 2023 to 2033

Figure 66: South Asia Market Y-o-Y Growth (%) Projections by Country, 2023 to 2033

Figure 67: South Asia Market Value (US$ Million) Analysis by Product Type, 2018 to 2033

Figure 68: South Asia Market Value Share (%) and BPS Analysis by Product Type, 2023 to 2033

Figure 69: South Asia Market Y-o-Y Growth (%) Projections by Product Type, 2023 to 2033

Figure 70: South Asia Market Value (US$ Million) Analysis by End User, 2018 to 2033

Figure 71: South Asia Market Value Share (%) and BPS Analysis by End User, 2023 to 2033

Figure 72: South Asia Market Y-o-Y Growth (%) Projections by End User, 2023 to 2033

Figure 73: South Asia Market Attractiveness by Product Type, 2023 to 2033

Figure 74: South Asia Market Attractiveness by End User, 2023 to 2033

Figure 75: South Asia Market Attractiveness by Country, 2023 to 2033

Figure 76: East Asia Market Value (US$ Million) by Product Type, 2023 to 2033

Figure 77: East Asia Market Value (US$ Million) by End User, 2023 to 2033

Figure 78: East Asia Market Value (US$ Million) by Country, 2023 to 2033

Figure 79: East Asia Market Value (US$ Million) Analysis by Country, 2018 to 2033

Figure 80: East Asia Market Value Share (%) and BPS Analysis by Country, 2023 to 2033

Figure 81: East Asia Market Y-o-Y Growth (%) Projections by Country, 2023 to 2033

Figure 82: East Asia Market Value (US$ Million) Analysis by Product Type, 2018 to 2033

Figure 83: East Asia Market Value Share (%) and BPS Analysis by Product Type, 2023 to 2033

Figure 84: East Asia Market Y-o-Y Growth (%) Projections by Product Type, 2023 to 2033

Figure 85: East Asia Market Value (US$ Million) Analysis by End User, 2018 to 2033

Figure 86: East Asia Market Value Share (%) and BPS Analysis by End User, 2023 to 2033

Figure 87: East Asia Market Y-o-Y Growth (%) Projections by End User, 2023 to 2033

Figure 88: East Asia Market Attractiveness by Product Type, 2023 to 2033

Figure 89: East Asia Market Attractiveness by End User, 2023 to 2033

Figure 90: East Asia Market Attractiveness by Country, 2023 to 2033

Figure 91: Oceania Market Value (US$ Million) by Product Type, 2023 to 2033

Figure 92: Oceania Market Value (US$ Million) by End User, 2023 to 2033

Figure 93: Oceania Market Value (US$ Million) by Country, 2023 to 2033

Figure 94: Oceania Market Value (US$ Million) Analysis by Country, 2018 to 2033

Figure 95: Oceania Market Value Share (%) and BPS Analysis by Country, 2023 to 2033

Figure 96: Oceania Market Y-o-Y Growth (%) Projections by Country, 2023 to 2033

Figure 97: Oceania Market Value (US$ Million) Analysis by Product Type, 2018 to 2033

Figure 98: Oceania Market Value Share (%) and BPS Analysis by Product Type, 2023 to 2033

Figure 99: Oceania Market Y-o-Y Growth (%) Projections by Product Type, 2023 to 2033

Figure 100: Oceania Market Value (US$ Million) Analysis by End User, 2018 to 2033

Figure 101: Oceania Market Value Share (%) and BPS Analysis by End User, 2023 to 2033

Figure 102: Oceania Market Y-o-Y Growth (%) Projections by End User, 2023 to 2033

Figure 103: Oceania Market Attractiveness by Product Type, 2023 to 2033

Figure 104: Oceania Market Attractiveness by End User, 2023 to 2033

Figure 105: Oceania Market Attractiveness by Country, 2023 to 2033

Figure 106: MEA Market Value (US$ Million) by Product Type, 2023 to 2033

Figure 107: MEA Market Value (US$ Million) by End User, 2023 to 2033

Figure 108: MEA Market Value (US$ Million) by Country, 2023 to 2033

Figure 109: MEA Market Value (US$ Million) Analysis by Country, 2018 to 2033

Figure 110: MEA Market Value Share (%) and BPS Analysis by Country, 2023 to 2033

Figure 111: MEA Market Y-o-Y Growth (%) Projections by Country, 2023 to 2033

Figure 112: MEA Market Value (US$ Million) Analysis by Product Type, 2018 to 2033

Figure 113: MEA Market Value Share (%) and BPS Analysis by Product Type, 2023 to 2033

Figure 114: MEA Market Y-o-Y Growth (%) Projections by Product Type, 2023 to 2033

Figure 115: MEA Market Value (US$ Million) Analysis by End User, 2018 to 2033

Figure 116: MEA Market Value Share (%) and BPS Analysis by End User, 2023 to 2033

Figure 117: MEA Market Y-o-Y Growth (%) Projections by End User, 2023 to 2033

Figure 118: MEA Market Attractiveness by Product Type, 2023 to 2033

Figure 119: MEA Market Attractiveness by End User, 2023 to 2033

Figure 120: MEA Market Attractiveness by Country, 2023 to 2033

Recommendations

Healthcare

Venous Ulcer Treatment Market

Published : February 2023

Healthcare

Keratitis Treatment Market

Published : January 2023

Healthcare

Anorectal Malformation Treatment Market

Published : January 2023

Healthcare

Treatment-Resistant Depression Treatment Market

Published : December 2022

Explore Healthcare Insights

View Reports

Chronic Hepatitis B Virus Testing Market