Reports

- Global Locations -

Headquarters

Future Market Insights, Inc.

Christiana Corporate, 200
Continental Drive, Suite 401,
Newark, Delaware - 19713,
United States

T: +1-845-579-5705

Americas

Future Market Insights, Inc.

616 Corporate Way, Suite 2-9018,
Valley Cottage, NY 10989, United States

T: +1-347-918-3531

MEA

Future Market Insights

1602-6 Jumeirah Bay X2 Tower, Plot No: JLT-PH2-X2A,
Jumeirah Lakes Towers, Dubai,
United Arab Emirates

Europe

Future Market Insights

3rd Floor, 207 Regent Street,
W1B 3HH London
United Kingdom

T: + 44 (0) 20 8123 9659
D: +44 (0) 20 3287 4268

Asia Pacific

Future Market Insights

IndiaLand Global Tech Park, Unit UG-1, Behind Grand HighStreet, Phase 1, Hinjawadi, MH, Pune – 411057, India

Chronic Wound Care Market Outlook from (2023 to 2033)

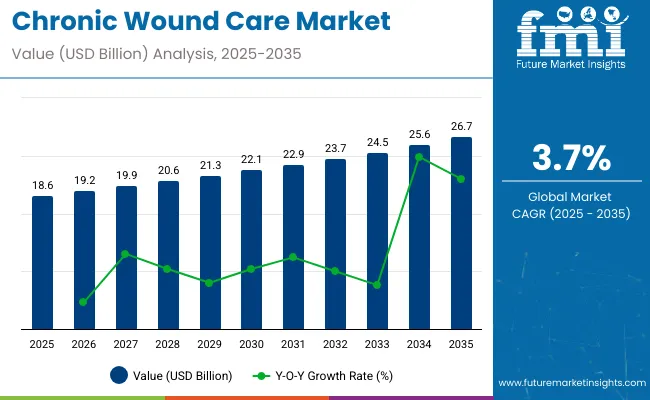
The global chronic wound care market size is expected to rise at a CAGR of 3.8% during the projected period 2023 to 2033. The market value is projected to increase from US$ 17,272.4 million in 2023 to US$ 25,042.5 million by 2033. The chronic wound care market was valued at US$ 16,689.3 million in 2022 and is anticipated to exhibit a y-o-y growth of 3.5% in 2023.

Attributes Key Insights
Chronic Wound Care Market Size (2022A) US$ 16,689.3 million
Estimated Chronic Wound Care Market Value (2023E) US$ 17,272.4 million
Projected Chronic Wound Care Market Value (2033F) US$ 25,042.5 million
Value-based CAGR (2023 to 2033) 3.8%

Don't pay for what you don't need

Customize your report by selecting specific countries or regions and save 30%!

Chronic Wound Care Market Overview

Pharmaceutical goods and therapies, specially created for the management and treatment of chronic wounds, are set to be included in the chronic wound care pharmaceutical market. Growing cases of sports injuries, rising diabetes prevalence, and shifting lifestyles are expected to propel market expansion.

The incidence rate of chronic wounds is predicted to rise globally due to the rising rates of chronic diseases such as cancer, diabetes, and several autoimmune disorders. The surging incidence of non-communicable diseases is attributed to factors such as antimicrobial resistance, unhealthy and sedentary lifestyles, and alcohol and tobacco use.

The COVID-19 pandemic has raised the demand for protective clothing, hand sanitizers, respiratory supplies, diagnostic and laboratory disposables, and medicine delivery products. In the forecast period, it is projected that growing consumer awareness of the advantages of hygiene and cleanliness will propel the market for hand sanitizers, clothing, and sterilization supplies.

Another important aspect that is expected to propel market expansion is the increasing prevalence of obesity, which is linked to lower extremity amputations and chronic wounds. Due to decreased vascular activity in adipose tissue, obese individuals are more likely to develop pressure ulcers. The inability of these individuals to adjust their position in bed serves as a prelude to injuries caused by pressure.

The creases in their skin can create the perfect environment for microbes to proliferate. These microbes break down the skin, which results in ulcers, which can increase the demand for these solutions, which will push the market.

Technological Advancements in Treatment Options Fuel Market Expansion

The chronic wound care sector is expanding as a result of technological developments in treatment choices. The potential for patient outcomes, healing time, and effectiveness of wound care to be dramatically improved by technological advancements is great.

For instance, TRUSHIELD NXT, a surgical wound dressing with a 3D hydrocellular substrate and distinct infection prevention technology, was introduced by Healthium Medtech Limited in October 2021.

Consumers are anticipated to be encouraged to use cutting-edge wound care solutions for the urgent treatment of diabetic foot ulcers and other ailments. This is attributed to key players' investments in research and development and the introduction of a range of novel wound-healing products, including foam dressings and others.

In developed nations, a sizable amount of healthcare spending is allocated to treating wounds. According to studies conducted by Health Science Reports 2022, 50% of hospitalized patients have wounds, compared to 1% to 2% of the general population worldwide who live in affluent nations.

Chronic wounds take longer than the anticipated 30 days to heal. Technologies have been created to solve difficulties in wound care to reduce discomfort, accelerate healing, or reduce wound infections.

It is clear from these trends and advancements in wound care that the global healthcare sector is aggressively addressing the difficulties in treating wounds. It aims to improve patient outcomes and raise the standard of care for those with chronic wounds.

Sabyasachi Ghosh
Sabyasachi Ghosh

Principal Consultant

Talk to Analyst

Find your sweet spots for generating winning opportunities in this market.

2018 to 2022 Chronic Wound Care Market Insights Vs. 2023 to 2033 Demand Forecast

The global chronic wound care market recorded a CAGR of 2.2% in the historical period from 2018 to 2022. The chronic wound care market value was around 63.8% of the global advance wound dressing market.

The global wound dressing market was worth US$ 26,165.24 million in the same period. The increasing incidence of diabetic foot ulcers in the elderly in developing countries is leading to a growing demand for antimicrobial wound dressing products.

Attributes Details
Historical CAGR (2018 to 2022) 2.2%
Forecast CAGR (2023 to 2033) 3.8%

For instance, research published by the National Center for Biotechnology Information in August 2021 states that 1.0% of diabetics in the United States suffer an amputation, and 5.0% of diabetics in the country have foot ulcers. Diabetic foot ulcers can also lead to lower limb amputations and gangrene. These are the most common conditions in hospital wards in less developed countries, which can spur the demand for antimicrobial wound dressing products.

The market for chronic wound care medications is propelled by continued efforts to discover novel and efficient treatment alternatives. It is also projected to be supported by the rising expenditure in healthcare facilities and the expanding use of cutting-edge wound care technologies.

Such advancements are intended to improve patient outcomes and reduce healthcare expenses related to managing chronic wounds. These are further expected to raise the general standard of living for those who have chronic wounds.

Trends and Opportunities in the Chronic Wound Care Market

Attributes Key Factors
Chronic Wound Care Market Trends
  • Advanced Therapies and Biologics: Bioengineered skin substitutes, growth factors, and stem cell-based therapies are examples of advanced wound care therapies that are gaining popularity. The goals of these advancements are to enhance chronic wound healing and hasten wound healing.
  • Telemedicine and Remote Monitoring: Since the COVID-19 epidemic, there has been a surging use of telemedicine and remote monitoring technology. This eliminates the need for in-person visits and enables prompt wound assessment and management.
  • Personalized Wound Care Programs: It's becoming more popular to design wound care programs based on the requirements of certain patients. This entails taking into account variables such as the kind of wound, the patient's general health, way of life, and preferences.
  • Smart Dressings and Devices: Real-time tracking of the process of wound healing is now possible with the introduction of smart dressings and wound monitoring devices that are outfitted with sensors and IoT technology. These gadgets can give medical professionals useful information they need to make wise choices.
Growth Hindrances
  • High Cost of Advanced Therapies: Growth factors and bioengineered skin substitutes are examples of advanced wound care products and therapies that can be costly. This expense can provide a serious obstacle, particularly for those without sufficient insurance.
  • Limited Reimbursement Policies: The cost of a handful of advanced wound care procedures cannot be sufficiently covered by reimbursement policies in underdeveloped areas. This can restrict patients' access to innovative treatments.
  • Regulatory Obstacles: The market for chronic wound care must comply with strict regulations. Getting approvals for novel treatments or products can be an expensive and time-consuming procedure.
Upcoming Opportunities
  • Technological Advancements: There is a lot of room for expansion in the field of wound care technologies, which include smart wound monitoring devices, bioengineered skin substitutes, and sophisticated dressings.
  • Biologics and Regenerative Therapies: A promising path to improving wound healing results is the development of biologic wound healing agents, such as growth factors, stem cells, and tissue-engineered products.

Get the data you need at a Fraction of the cost

Personalize your report by choosing insights you need
and save 40%!

Comparative Overview of Adjacent Chronic Wound Care Markets

The section covers a comparative view of three markets similar to the global chronic wound care market. As per estimations, the chronic pulmonary hypertension treatment market would lead out of the three markets.

The market for chronic wound care is set to reach a valuation of US$ 25,042.5 million by 2023. The chronic pulmonary hypertension treatment and chronic hepatitis B virus testing markets are projected to reach US$ 7 billion and US$ 919 million, respectively, in 2023.

Chronic Wound Care Market:

Attributes Chronic Wound Care Market
CAGR (2023 to 2033) 3.8%
Market Value (2023) US$ 25,042.5 million
Growth Factor Rising patient and healthcare professional knowledge of the value of appropriate wound care and the accessibility of cutting-edge therapies can propel market expansion.
Key Trend The value of patient education and participation in their own wound management is becoming increasingly apparent. Better results can result from providing patients with the information and resources they need to manage themselves.

Chronic Hepatitis B Virus Testing Market:

Attributes Chronic Hepatitis B Virus Testing Market
CAGR (2023 to 2033) 6.9%
Market Value (2023) US$ 919 million
Growth Factor Early diagnosis and detection of chronic hepatitis B virus for timely treatment and prevention of disease progression are increasingly emphasized.
Key Trend Continuous advancements in diagnostic technology, including serology, point-of-care testing, and nucleic acid testing (NAT), are improving the accuracy and efficacy of HBV testing.

Chronic Pulmonary Hypertension Treatment Market:

Attributes Chronic Pulmonary Hypertension Treatment Market
CAGR (2023 to 2033) 5%
Market Value (2023) US$ 7 billion
Growth Factor A key trend in the treatment of CPH is the development of specific treatments, such as endothelin receptor antagonists, phosphodiesterase-5 (PDE-5) inhibitors, and prostacyclin analogs.
Key Trend In an effort to enhance patient outcomes and optimize therapy efficacy, physicians are increasingly investigating combination medicines. Drug combinations with multiple modes of action can provide beneficial benefits when blended.

Country-wise Insights

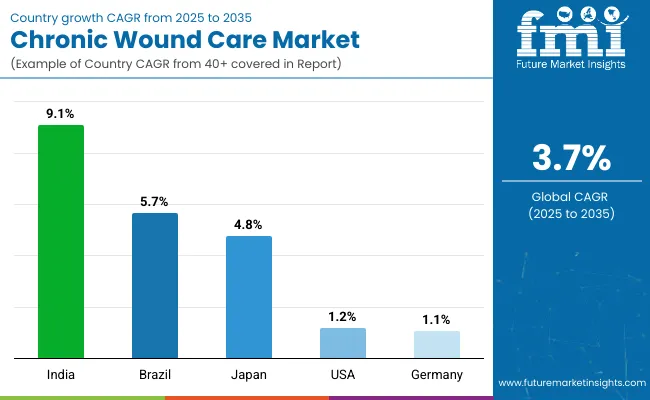
In the table below, the CAGRs of the top six countries are given for the review period 2023 to 2033. China and India are expected to remain dominant by exhibiting CAGRs of 8.9% and 9.1%, respectively. The United States and Japan are anticipated to follow with CAGRs of 1.2% and 4.8%, respectively.

Country Value-based CAGR
United States 1.2%
Germany 1.1%
United Kingdom 0.9%
Japan 4.8%
China 8.9%
India 9.1%

Highly Developed Healthcare Infrastructure in the United States to Raise Demand

The United States dominated the global chronic wound care market with a 34.9% share in 2022. It is projected to continue experiencing high growth throughout the forecast period. The North America market is expected to surge with a CAGR of 1.2% over the forecast period due to the rising prevalence of chronic wounds.

  • Between 2.4 and 4.5 million people in the United States alone are estimated to be impacted by chronic wounds, according to the Advances in Wound Care Report 2015. Chronic leg and foot ulcers, which are related to chronic venous insufficiency, arterial disease, high blood pressure, or neuropathy, are common in people with vascular disease or diabetes.

The rising incidence of chronic diseases such as diabetes, obesity, and vascular diseases has contributed to an increasing number of patients with chronic wounds. This has created a substantial demand for effective wound care drugs in the market.

The growing awareness among healthcare professionals and patients about the importance of early and effective wound management has led to an increased demand for advanced wound care products and drugs. These would help promote faster healing and reduce the risk of complications.

Growing Government Focus on Healthcare Reforms to Drive Sales in China

China dominates the global chronic wound care market and held a 4.2% market share in 2022. It is projected to continue experiencing high growth throughout the forecast period.

The government of China has been focusing on healthcare reforms to improve the accessibility and quality of healthcare services across the country. These initiatives are set to create a conducive environment for manufacturers to introduce and promote chronic wound care in the market.

China's pharmaceutical market has been rapidly expanding, driven by a combination of factors, including increased healthcare expenditure, a growing middle class, and a greater focus on healthcare research and development. This presents an opportunity for manufacturers to tap into the market potential and cater to the growing demand for chronic wound care.

Rising Healthcare Professionals in India to Spur Demand

India held about 4.1% share of the global market in 2022 and is projected to showcase robust growth during the forecast period. The prevalence of chronic conditions such as diabetes, obesity, and cardiovascular diseases is rising in India. These conditions often lead to chronic wounds, creating a significant demand for effective wound care drugs and treatments.

There has been a significant increase in awareness among healthcare professionals and patients regarding the importance of early intervention and effective wound management in India. This heightened awareness has led to a greater demand for advanced wound care products and drugs that facilitate faster healing and reduce the risk of complications.

Awareness Campaigns Related to Wound Care to Surge Demand in Germany

In 2022, Germany held a dominant revenue in the chronic wound care market and is expected to surge at a CAGR of 1.1% through 2033. There are now more specialized wound treatment clinics and facilities available in Germany. These clinics would provide cutting-edge care and knowledge about handling long-term wounds.

Advanced wound dressings with antibacterial qualities are in demand as infection control is crucial to wound care. International enterprises, research centers, and healthcare organizations often collaborate with each other in Germany. These collaborations seek to improve wound care treatments by utilizing knowledge and technology.

In Germany, education and awareness campaigns about the care and prevention of wounds are essential. Patients and medical personnel can both gain from continuing education regarding optimal techniques for managing wounds.

In Germany, telemedicine and remote monitoring technologies are becoming increasingly popular. The use of these technologies eliminates the necessity for in-person visits for consultations and wound evaluations.

Regenerative medicine and tissue engineering, which can find use in the treatment of chronic wounds, have attracted considerable interest in Germany. Healthcare professionals are becoming more conscious of environmental sustainability. Eco-friendly manufacturing methods can provide them with a competitive advantage.

Government Funding for Bioengineering to Drive Sales in Japan

Japan’s chronic wound care market is poised to exhibit a CAGR of 4.8% during the assessment period. Due to its high elderly population, Japan has a substantial market for services and goods related to chronic wound care. The need for enhanced wound care treatments is set to be fueled by the rise of chronic disorders such as diabetes and vascular diseases.

Japan regulates healthcare items under strict guidelines. In order for manufacturers to promote and distribute wound care products in the nation, they must abide by the Pharmaceutical Affairs Law and other pertinent rules.

The country’s market is distinguished by a significant focus on innovation in technology. There is a market for advanced wound care goods, such as wound healing devices and bioengineered dressings.

Buyers in Japan are renowned for having a taste for premium goods. For manufacturers to be successful in this industry, strict standards of quality and safety must be upheld.

In Japan, home healthcare is becoming more popular due to the country's increasing aging population. This involves the requirement for at-home, efficacious treatments for chronic wound care.

Category-wise Insights

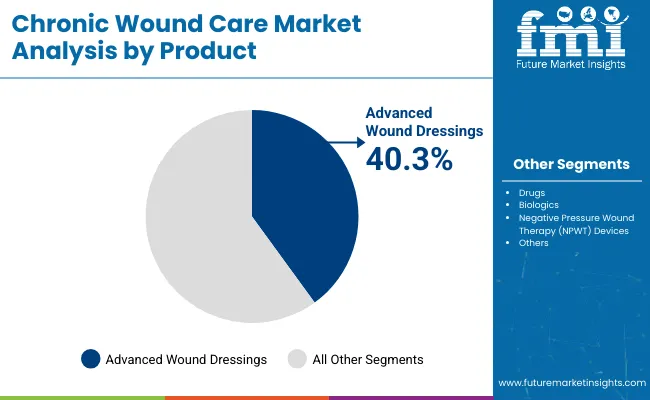
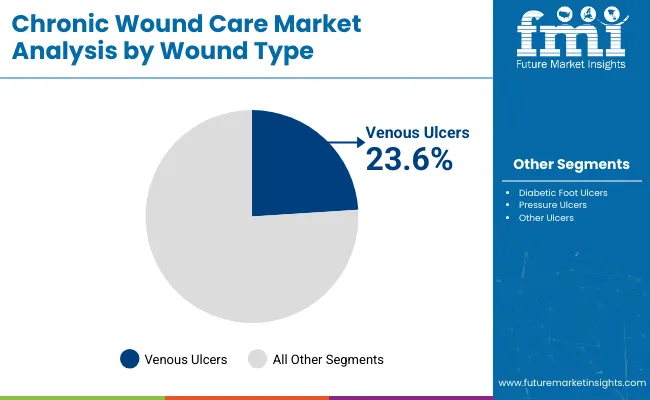
The table below signifies the leading sub-categories under product, wound type, and distribution channel categories in the chronic wound care market. Advanced wound dressing is expected to dominate the market for chronic wound care by exhibiting a 3.0% CAGR in the evaluation period. Under the wound type category, the other ulcers segment is projected to lead the global market at a 1.8% CAGR.

Segment Value CAGR
Advanced Wound Dressings (Product) 3.0%
Other Ulcers (Wound Type) 1.8%
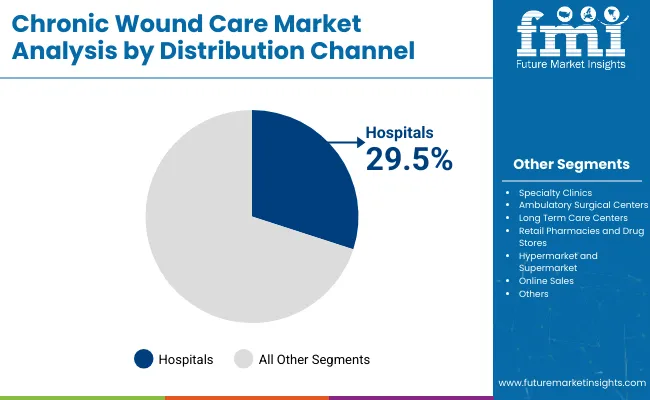
Hospitals (Distribution Channel) 1.2%

Advanced Wound Dressings to be Highly Preferred in the Market by 2033

Advanced wound dressings in terms of the product segment held a share of 40.9% in 2022, and the same trend is set to be followed over the forecast period. The increasing incidence of diabetic foot ulcers in the elderly in developing countries is leading to a steady demand for advanced wound dressing products.

According to estimates by the International Diabetes Federation, the prevalence of diabetic foot ulcers in developed countries was around 2% in 2017, while it was over 20% in resource-poor countries in the Caribbean. This is driving the demand for low-cost antimicrobial wound dressing products in inpatient care and private homes.

Other Ulcers Wound Types to be Popular in the Healthcare Sector

The other ulcers segment dominates the wound type segment and held around 49.6% market share in 2022. Increasing research and development investments in wound care are projected to boost the market for chronic wound care.

The goal of research and development is to create novel dressing materials, incorporate cutting-edge technology, and improve the antibacterial qualities of dressings. Through these expenditures, businesses want to stay competitive and meet the changing demands of both patients and healthcare professionals.

The development of antimicrobial wound dressings with improved qualities and functions is the focus of research and development spending. This includes the development of dressings with higher biocompatibility, longer wear times, improved moisture management, and simplicity of use. Also, the aim of research and development is to develop novel solutions that specifically address the needs of patients and healthcare professionals.

Hospital to be the Leading Distribution Channel in the Global Market

The hospital segment dominates in terms of end-users. The segment held about 31.4% market share in 2022. Hospitals frequently have specialized wound care units with cutting-edge technology and qualified medical staff who are committed to efficiently managing chronic wounds.

Patients with severe or complex chronic wounds frequently need inpatient care for proper monitoring and treatment, which is effectively given in hospital settings. To ensure thorough and integrated treatment regimens for patients with chronic wounds, hospitals frequently facilitate multidisciplinary collaboration among several healthcare professionals. It includes wound care specialists, nurses, and chemists; this improves patient outcomes and boosts the effectiveness of healthcare as a whole.

Competitive Landscape

Collaboration among healthcare professionals from other disciplines, such as surgeons, nurses, microbiologists, and researchers, can improve patient outcomes and promote the use of novel wound care solutions, such as antimicrobial dressings.

Market participants are adopting several strategies, such as collaborations, mergers and acquisitions, and product launches, to strengthen their presence in the market. Furthermore, leading companies are capitalizing heavily on research and development to bring innovative products and advanced technology to market.

For instance,

  • In April 2022, Lupin completed the acquisition of Anglo-French brands.
  • Teva Pharmaceuticals and the Attorney General of Rhode Island settled in March 2022 regarding the state's and its sub-divisions opioid-related claims.
  • In January 2023, to offer epifix, allogeneic placental tissue for wound healing in Japan, Mimedx and Gunze Medical Limited inked an exclusive distribution deal.
  • In November 2022, Medela LLC and Medpro collaborated to increase access to the latter's wound care systems.
  • In March 2022, COnvaTech Group acquired Traid Life Science to enter the wound biologics market.

Scope of the Report

Attribute Details
Chronic Wound Care Market Size (2023) US$ 17,272.4 million
Chronic Wound Care Market Forecast Value (2033) US$ 25,042.5 million
Value-based CAGR (2023 to 2033) 3.8%
Forecast Period 2023 to 2033
Historical Data Available for 2018 to 2022
Market Analysis Value (US$ million)
Key Regions Covered North America, Latin America, East Asia, South Asia Pacific, Western Europe, Eastern Europe, Central Asia, Russia and Belarus, Balkan and Baltic Countries, Middle East and Africa
Key Countries Covered United States, Canada, Brazil, Mexico, Argentina, China, Japan, South Korea, India, Indonesia, Thailand, Philippines, Malaysia, Vietnam, Australia and New Zealand, Western Europe, Eastern Europe, Germany, GCC Countries, Türkiye, Northern Africa, South Africa, Israel.
Key Market Segments Covered
  • Product
  • Wound Type
  • Distribution Channel
  • Region
  • Key Companies Profiled
  • Teva Pharmaceuticals
  • Lupin Ltd
  • Cipla Ltd
  • MTF Biologics
  • MIMEDX Group, Inc.
  • Integra Lifesciences
  • Smith and Nephew plc
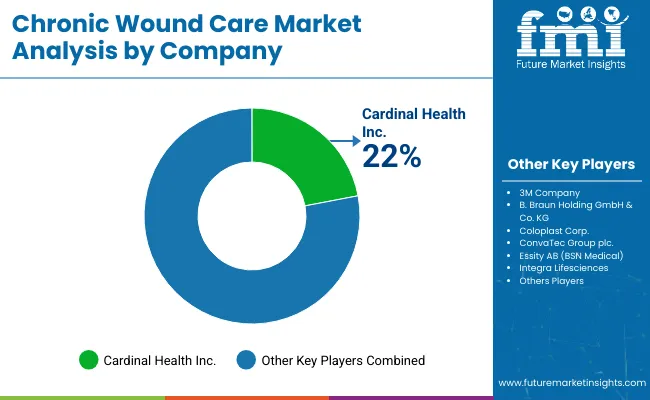
  • Cardinal Health Inc.
  • 3M
  • Mölnlycke Health Care
  • Medline Industries, Inc.
  • ConvaTec Group plc.
  • Coloplast Corp.
  • B. Braun Holding GmbH & Co. KG
  • Johnson & Johnson Innovation, LLC
  • Stryker Corporation
  • Anika Therapeutics, Inc.
  • Becton, Dickinson and Company
  • Novartis AG
  • Perrigo Company plc
  • AstraZeneca
  • Essity AB (BSN Medical)
  • Boen Healthcare Co., Ltd
  • Hakuzo Medical Asia Co., Ltd
  • Organogenesis Holdings Inc.
  • PAUL HARTMANN AG
  • Alleva Medical Ltd. (Devon Medical Products)
  • Olle Larsson Holding AG (Medela AG)
  • Avery Dennison Corporation
  • Oneness Biotech
  • Vericel Corporation
  • Marine Polymer Technologies Inc.
  • SIGVARIS GROUP
  • Taro Pharmaceuticals
  • Prasco Laboratories.
Report Coverage Market Forecast, Competition Intelligence, Market Dynamics and Challenges, Strategic Growth Initiatives

Chronic Wound Care Market Outlook by Category

By Product:

  • Advanced Wound Dressings
    • Antimicrobial Dressings
      • Silver Dressings
      • Non-Silver Dressings
    • Foam Dressings
      • Silicon
      • Non-Silicon Dressings
    • Hydrogels Dressings
    • Semi-Permeable Films Dressings
    • Alginate Dressings
    • Hydrocolloid Dressings
    • Collagen Dressing
    • Contact Layer
    • Honey Dressings
    • Super Absorbent Dressings
    • Other
      • Antimicrobial Gels
      • Antimicrobial Powder
      • Concentrated Surfactant
      • Skin Protectants
      • Wound Cleansers
      • Unna Boots
      • Tapes
  • Drugs
    • Topical Drug
      • Becaplermin
      • Gentamicin
      • Minocycline
      • Lidocaine
      • Sulfadiazine
      • Others
    • Oral Drugs
      • Colchicine
      • Prednisolone
      • Aspirin
      • Anticoagulants
      • Warfarin
      • Others
  • Biologics
    • Biological Skin Substitutes
    • Biomembranes
  • Negative Pressure Wound Therapy (NPWT) Devices
    • Standalone NPWT Devices
    • Disposable NPWT Devices
    • Portable NPWT Devices
    • NPWT Accessories (Canister)

By Wound Type:

  • Diabetic Foot Ulcers
  • Venous Ulcers
  • Pressure Ulcers
  • Other Ulcers

By Distribution Channel:

  • Hospitals
  • Specialty Clinics
  • Ambulatory Surgical Centers
  • Long-Term Care Centers
  • Retail Pharmacies and Drug Stores
  • Hypermarkets and Supermarkets
  • Online Sales

By Region:

  • North America
  • Latin America
  • Western Europe
  • Eastern Europe
  • East Asia
  • South Asia and Pacific
  • Central Asia
  • Russia and Belarus
  • Balkan and Baltic Countries
  • Middle East and Africa

Frequently Asked Questions

How large was the global chronic wound care market in 2022?

The global market was valued at around US$ 16,689.3 million in 2022.

What is the projected value of the global market for 2033?

The global market is set to reach a valuation of US$ 25,042.5 million by 2033.

Which wound dressing segment leads the market?

The antimicrobial dressings segment held a 20.2% share in 2022.

What was the CAGR of the global market from 2018 to 2022?

Demand in the global market increased at a 2.2% CAGR from 2018 to 2022.

What value is the global market estimated to reach by 2023?

The global market is estimated to reach US$ 17,272.4 million by 2023.

What is the United States market outlook?

The United States accounted for around 34.9% share of the global market in 2022.

Table of Content

1. Executive Summary

    1.1. Global Market Outlook

    1.2. Demand Side Trends

    1.3. Supply Side Trends

    1.4. Technological Roadmap

    1.5. Analysis and Recommendations

2. Market Overview

    2.1. Market Coverage / Taxonomy

    2.2. Market Definition / Scope / Limitations

    2.3. Inclusion & Exclusion

3. Key Market Trends

    3.1. Key Trends Impacting the Market

    3.2. Innovation / Development Trends

4. Value Added Insights

    4.1. Disease Epidemiology, By Region

    4.2. Product USPs / Features Anlaysis

    4.3. Reimbursement Scenario

    4.4. Regulatory Landscape

    4.5. Value Chain Analysis

    4.6. PORTER Analysis

    4.7. PESTLE Analysis, By Region

5. Market Background

    5.1. Macro-Economic Factors

        5.1.1. Global GDP Growth Outlook

        5.1.2. Global Healthcare Spending Outlook

    5.2. Forecast Factors - Relevance & Impact

        5.2.1. Growing Prevalence of Diabetic Foot

        5.2.2. Increasing Demand for Wound Care Products

        5.2.3. Rising Healthcare Expenditure

        5.2.4. Rising Geriatric Population Suffering from Pressure Ulcer

        5.2.5. Product Launches and Approvals

        5.2.6. Historic Growth of Key Companies

    5.3. Market Dynamics

        5.3.1. Drivers

        5.3.2. Restraints

        5.3.3. Opportunity Analysis

6. Global Market Demand (in Volume) Analysis 2016 to 2022 and Forecast, 2023 to 2033

    6.1. Historical Market Volume ('000 Units) Analysis, 2016 to 2022

    6.2. Current and Future Market Volume ('000 Units) Projections, 2023 to 2033

        6.2.1. Y-o-Y Growth Trend Analysis

7. Global Market Pricing Analysis

    7.1. Regional Pricing Analysis by Product

    7.2. Pricing Break-up

        7.2.1. Manufacturer-Level Pricing

        7.2.2. Distributor Level Pricing

    7.3. Global Average Pricing Analysis Benchmark

    7.4. Pricing Assumptions

8. Global Market Demand (in Value or Size in US$ million) Analysis 2016 to 2022 and Forecast, 2023 to 2033

    8.1. Revenue Opportunity Scenario

    8.2. Historical Market Value (US$ million) Analysis, 2016 to 2022

    8.3. Current and Future Market Value (US$ million) Projections, 2023 to 2033

        8.3.1. Y-o-Y Growth Trend Analysis

        8.3.2. Absolute $ Opportunity Analysis

9. Global Market Analysis 2016 to 2022 and Forecast 2023 to 2033, By Product

    9.1. Introduction / Key Findings

    9.2. Historical Market Size (US$ million) & Volume Analysis by Product, 2016 to 2022

    9.3. Current and Future Market Size (US$ million) and Volume Analysis Forecast by Product, 2023 to 2033

        9.3.1. Drugs

            9.3.1.1. Topical Drugs

                9.3.1.1.1. Becaplermin

                9.3.1.1.2. Gentamicin

                9.3.1.1.3. Minocycline

                9.3.1.1.4. Lidocaine

                9.3.1.1.5. Sulfadiazine

                9.3.1.1.6. Others

            9.3.1.2. Oral Drugs

                9.3.1.2.1. Colchicine

                9.3.1.2.2. Prednisolone

                9.3.1.2.3. Aspirin

                9.3.1.2.4. Anticoagulants

                9.3.1.2.5. Warfarin

                9.3.1.2.6. Others

        9.3.2. Biologics

            9.3.2.1. Biological Skin Substitutes

            9.3.2.2. Biomembranes

        9.3.3. Negative Pressure Wound Therapy (NPWT) Devices

            9.3.3.1. Standalone NPWT Devices

            9.3.3.2. Disposable NPWT Devices

            9.3.3.3. Portable NPWT Devices

            9.3.3.4. NPWT Accessories (Canister)

        9.3.4. Advanced Wound Dressings

            9.3.4.1. Hydrogels Dressings

            9.3.4.2. Semi-Permeable Films Dressings

            9.3.4.3. Alginate Dressings

            9.3.4.4. Foam Dressings

            9.3.4.5. Silicon

                9.3.4.5.1. Non-Silicon Dressings

                9.3.4.5.2. Hydrocolloid Dressings

            9.3.4.6. Collagen Dressing

            9.3.4.7. Contact Layer

            9.3.4.8. Honey Dressings

            9.3.4.9. Super Absorbent Dressings

            9.3.4.10. Antimicrobial Dressings

            9.3.4.11. Silver Dressings

            9.3.4.12. Non-Silver Dressings

            9.3.4.13. Other

                9.3.4.13.1. Antimicrobial Gels

                9.3.4.13.2. Antimicrobial Powder

                9.3.4.13.3. Concentrated Surfactant

                9.3.4.13.4. Skin Protectants

                9.3.4.13.5. Wound Cleansers

                9.3.4.13.6. Unna Boots

                9.3.4.13.7. Tapes

    9.4. Market Attractiveness Analysis by Product

10. Global Market Analysis 2016 to 2022 and Forecast 2023 to 2033, By Wound Type

    10.1. Introduction / Key Findings

    10.2. Historical Market Size (US$ million) Analysis by Wound Type, 2016 to 2022

    10.3. Current and Future Market Size (US$ million) Analysis and Forecast by Wound Type, 2023 to 2033

        10.3.1. Diabetic Foot Ulcers

        10.3.2. Venous Ulcers

        10.3.3. Pressure Ulcers

        10.3.4. Others Ulcers

    10.4. Market Attractiveness Analysis by Wound Type

11. Global Market Analysis 2016 to 2022 and Forecast 2023 to 2033, By Distribution Channel

    11.1. Introduction / Key Findings

    11.2. Historical Market Size (US$ million) Analysis by Distribution Channel, 2016 to 2022

    11.3. Current and Future Market Size (US$ million) Analysis and Forecast by Distribution Channel, 2023 to 2033

        11.3.1. Hospitals

        11.3.2. Specialty Clinics

        11.3.3. Ambulatory Surgical Centers

        11.3.4. Long Term Care Centers

        11.3.5. Retail Pharmacies & Drug Stores

        11.3.6. Hypermarket & Supermarket

        11.3.7. Online Sales

    11.4. Market Attractiveness Analysis by Age-Group

12. Global Market Analysis 2016 to 2022 and Forecast 2023 to 2033, by Region

    12.1. Introduction

    12.2. Historical Market Size (US$ million) & Volume Analysis by Region, 2016 to 2022

    12.3. Current and Future Market Size (US$ million) and Volume Analysis Forecast by Region, 2023 to 2033

        12.3.1. North America

        12.3.2. Latin America

        12.3.3. East Asia

        12.3.4. South Asia & Pacific

        12.3.5. Europe

        12.3.6. Central Asia

        12.3.7. Russia & Belarus

        12.3.8. Balkan & Baltic Countries

        12.3.9. Middle East & Africa

    12.4. Market Attractiveness Analysis by Region

13. North America Market Analysis 2016 to 2022 and Forecast 2023 to 2033

    13.1. Introduction

    13.2. Historical Market Size (US$ million) & Volume ('000 Units) Trend Analysis by Market Taxonomy, 2016 to 2022

    13.3. Market Size (US$ million) & Volume ('000 Units) Forecast by Market Taxonomy, 2023 to 2033

        13.3.1. By Country

            13.3.1.1. USA

            13.3.1.2. Canada

        13.3.2. By Product

        13.3.3. By Wound Type

        13.3.4. By Distribution Channel

    13.4. Market Attractiveness Analysis

        13.4.1. By Country

        13.4.2. By Product

        13.4.3. By Wound Type

        13.4.4. By Distribution Channel

    13.5. Drivers and Restraints - Impact Analysis

14. Latin America Market Analysis 2016 to 2022 and Forecast 2023 to 2033

    14.1. Introduction

    14.2. Historical Market Size (US$ million) & Volume ('000 Units) Trend Analysis by Market Taxonomy, 2016 to 2022

    14.3. Market Size (US$ million) & Volume ('000 Units) Forecast by Market Taxonomy, 2023 to 2033

        14.3.1. By Country

            14.3.1.1. Brazil

            14.3.1.2. Argentina

            14.3.1.3. Mexico

            14.3.1.4. Rest of Latin America

        14.3.2. By Product

        14.3.3. By Wound Type

        14.3.4. By Distribution Channel

    14.4. Market Attractiveness Analysis

        14.4.1. By Country

        14.4.2. By Product

        14.4.3. By Wound Type

        14.4.4. By Distribution Channel

15. East Asia Market 2016 to 2022 and Forecast 2023 to 2033

    15.1. Introduction

    15.2. Historical Market Size (US$ million) & Volume ('000 Units) Trend Analysis by Market Taxonomy, 2016 to 2022

    15.3. Market Size (US$ million) & Volume ('000 Units) Forecast by Market Taxonomy, 2023 to 2033

        15.3.1. By Country

            15.3.1.1. China

            15.3.1.2. Japan

            15.3.1.3. South Korea

        15.3.2. By Product

        15.3.3. By Wound Type

        15.3.4. By Distribution Channel

    15.4. Market Attractiveness Analysis

        15.4.1. By Country

        15.4.2. By Product

        15.4.3. By Wound Type

        15.4.4. By Distribution Channel

    15.5. Drivers and Restraints - Impact Analysis

16. South Asia & Pacific Market Analysis 2016 to 2022 and Forecast 2023 to 2033

    16.1. Introduction

    16.2. Historical Market Size (US$ million) & Volume ('000 Units) Trend Analysis by Market Taxonomy, 2016 to 2022

    16.3. Market Size (US$ million) & Volume ('000 Units) Forecast by Market Taxonomy, 2023 to 2033

        16.3.1. By Country

            16.3.1.1. India

            16.3.1.2. Indonesia

            16.3.1.3. Thailand

            16.3.1.4. Philippines

            16.3.1.5. Malaysia

            16.3.1.6. Vietnam

            16.3.1.7. Singapore

            16.3.1.8. Australia & New Zealand

        16.3.2. By Product

        16.3.3. By Wound Type

        16.3.4. By Distribution Channel

    16.4. Market Attractiveness Analysis

        16.4.1. By Country

        16.4.2. By Product

        16.4.3. By Wound Type

        16.4.4. By Distribution Channel

    16.5. Drivers and Restraints - Impact Analysis

17. Europe Market 2016 to 2022 and Forecast 2023 to 2033

    17.1. Introduction

    17.2. Historical Market Size (US$ million) & Volume ('000 Units) Trend Analysis by Market Taxonomy, 2016 to 2022

    17.3. Market Size (US$ million) & Volume ('000 Units) Forecast by Market Taxonomy, 2023 to 2033

        17.3.1. By Region

            17.3.1.1. Western Europe

            17.3.1.2. Eastern Europe

            17.3.1.3. Germany

        17.3.2. By Product

        17.3.3. By Wound Type

        17.3.4. By Distribution Channel

    17.4. Market Attractiveness Analysis

18. Central Asia Market Analysis 2016 to 2022 and Forecast 2023 to 2033

    18.1. Introduction

    18.2. Historical Market Size (US$ million) & Volume ('000 Units) Trend Analysis by Market Taxonomy, 2016 to 2022

    18.3. Market Size (US$ million) & Volume ('000 Units) Forecast by Market Taxonomy, 2023 to 2033

    18.4. Market Attractiveness Analysis

        18.4.1. By Product

        18.4.2. By Wound Type

        18.4.3. By Distribution Channel

    18.5. Drivers and Restraints - Impact Analysis

19. Russia & Belarus Market Analysis 2016 to 2022 and Forecast 2023 to 2033

    19.1. Introduction

    19.2. Historical Market Size (US$ million) & Volume ('000 Units) Trend Analysis by Market Taxonomy, 2016 to 2022

    19.3. Market Size (US$ million) & Volume ('000 Units) Forecast by Market Taxonomy, 2023 to 2033

    19.4. Market Attractiveness Analysis

        19.4.1. By Product

        19.4.2. By Wound Type

        19.4.3. By Distribution Channel

    19.5. Drivers and Restraints - Impact Analysis

20. Balkan & Baltic Countries Market Analysis 2016 to 2022 and Forecast 2023 to 2033

    20.1. Introduction

    20.2. Historical Market Size (US$ million) & Volume ('000 Units) Trend Analysis by Market Taxonomy, 2016 to 2022

    20.3. Market Size (US$ million) & Volume ('000 Units) Forecast by Market Taxonomy, 2023 to 2033

    20.4. Market Attractiveness Analysis

        20.4.1. By Product

        20.4.2. By Wound Type

        20.4.3. By Distribution Channel

    20.5. Drivers and Restraints - Impact Analysis

21. Middle East and Africa (MEA) Market 2016 to 2022 and Forecast 2023 to 2033

    21.1. Introduction

    21.2. Historical Market Size (US$ million) & Volume ('000 Units) Trend Analysis by Market Taxonomy, 2016 to 2022

    21.3. Market Size (US$ million) & Volume ('000 Units) Forecast by Market Taxonomy, 2023 to 2033

        21.3.1. By Country

            21.3.1.1. GCC Countries

            21.3.1.2. Kingdom of Saudi Arabia

            21.3.1.3. Turkey

            21.3.1.4. Northern Africa

            21.3.1.5. South Africa

            21.3.1.6. Israel

        21.3.2. By Product

        21.3.3. By Wound Type

        21.3.4. By Distribution Channel

    21.4. Market Attractiveness Analysis

        21.4.1. By Country

        21.4.2. By Product

        21.4.3. By Wound Type

        21.4.4. By Distribution Channel

22. Market Structure Analysis

    22.1. Market Analysis by Tier of Companies

    22.2. Market Share Analysis of Top Players

    22.3. Key Brands Assessment, By Region

    22.4. Pricing Analysis, By Competition

    22.5. Market Presence Analysis

        22.5.1. By Regional footprint of Players

        22.5.2. Product foot print by Players

        22.5.3. Channel Foot Print by Players

23. Competition Analysis

    23.1. Competition Dashboard

    23.2. Key Development Analysis

    23.3. Competition Benchmarking

    23.4. Competition Deep Dive

        23.4.1. Teva Pharmaceuticals

            23.4.1.1. Overview

            23.4.1.2. Key Financials

            23.4.1.3. Product Portfolio

            23.4.1.4. Sales Footprint

            23.4.1.5. SWOT Analysis

            23.4.1.6. Key Development

            23.4.1.7. Strategy

        23.4.2. Lupin Ltd

            23.4.2.1. Overview

            23.4.2.2. Key Financials

            23.4.2.3. Product Portfolio

            23.4.2.4. Sales Footprint

            23.4.2.5. SWOT Analysis

            23.4.2.6. Key Development

            23.4.2.7. Strategy

        23.4.3. Cipla Ltd

            23.4.3.1. Overview

            23.4.3.2. Key Financials

            23.4.3.3. Product Portfolio

            23.4.3.4. Sales Footprint

            23.4.3.5. SWOT Analysis

            23.4.3.6. Key Development

            23.4.3.7. Strategy

        23.4.4. MTF Biologics

            23.4.4.1. Overview

            23.4.4.2. Key Financials

            23.4.4.3. Product Portfolio

            23.4.4.4. Sales Footprint

            23.4.4.5. SWOT Analysis

            23.4.4.6. Key Development

            23.4.4.7. Strategy

        23.4.5. MIMEDX Group, Inc.

            23.4.5.1. Overview

            23.4.5.2. Key Financials

            23.4.5.3. Product Portfolio

            23.4.5.4. Sales Footprint

            23.4.5.5. SWOT Analysis

            23.4.5.6. Key Development

            23.4.5.7. Strategy

        23.4.6. Integra Lifesciences

            23.4.6.1. Overview

            23.4.6.2. Key Financials

            23.4.6.3. Product Portfolio

            23.4.6.4. Sales Footprint

            23.4.6.5. SWOT Analysis

            23.4.6.6. Key Development

            23.4.6.7. Strategy

        23.4.7. Smith and Nephew plc

            23.4.7.1. Overview

            23.4.7.2. Key Financials

            23.4.7.3. Product Portfolio

            23.4.7.4. Sales Footprint

            23.4.7.5. SWOT Analysis

            23.4.7.6. Key Development

            23.4.7.7. Strategy

        23.4.8. Cardinal Health Inc.

            23.4.8.1. Overview

            23.4.8.2. Key Financials

            23.4.8.3. Product Portfolio

            23.4.8.4. Sales Footprint

            23.4.8.5. SWOT Analysis

            23.4.8.6. Key Development

            23.4.8.7. Strategy

        23.4.9. 3M

            23.4.9.1. Overview

            23.4.9.2. Key Financials

            23.4.9.3. Product Portfolio

            23.4.9.4. Sales Footprint

            23.4.9.5. SWOT Analysis

            23.4.9.6. Key Development

            23.4.9.7. Strategy

        23.4.10. Mölnlycke Health Care

            23.4.10.1. Overview

            23.4.10.2. Key Financials

            23.4.10.3. Product Portfolio

            23.4.10.4. Sales Footprint

            23.4.10.5. SWOT Analysis

            23.4.10.6. Key Development

            23.4.10.7. Strategy

        23.4.11. Medline Industries, Inc.

            23.4.11.1. Overview

            23.4.11.2. Key Financials

            23.4.11.3. Product Portfolio

            23.4.11.4. Sales Footprint

            23.4.11.5. SWOT Analysis

            23.4.11.6. Key Development

            23.4.11.7. Strategy

        23.4.12. ConvaTec Group plc.

            23.4.12.1. Overview

            23.4.12.2. Key Financials

            23.4.12.3. Product Portfolio

            23.4.12.4. Sales Footprint

            23.4.12.5. SWOT Analysis

            23.4.12.6. Key Development

            23.4.12.7. Strategy

        23.4.13. Coloplast Corp.

            23.4.13.1. Overview

            23.4.13.2. Key Financials

            23.4.13.3. Product Portfolio

            23.4.13.4. Sales Footprint

            23.4.13.5. SWOT Analysis

            23.4.13.6. Key Development

            23.4.13.7. Strategy

        23.4.14. B. Braun Holding GmbH & Co. KG

            23.4.14.1. Overview

            23.4.14.2. Key Financials

            23.4.14.3. Product Portfolio

            23.4.14.4. Sales Footprint

            23.4.14.5. SWOT Analysis

            23.4.14.6. Key Development

            23.4.14.7. Strategy

        23.4.15. Johnson & Johnson Innovation, LLC

            23.4.15.1. Overview

            23.4.15.2. Key Financials

            23.4.15.3. Product Portfolio

            23.4.15.4. Sales Footprint

            23.4.15.5. SWOT Analysis

            23.4.15.6. Key Development

            23.4.15.7. Strategy

        23.4.16. Stryker Corporation

            23.4.16.1. Overview

            23.4.16.2. Key Financials

            23.4.16.3. Product Portfolio

            23.4.16.4. Sales Footprint

            23.4.16.5. SWOT Analysis

            23.4.16.6. Key Development

            23.4.16.7. Strategy

        23.4.17. Anika Therapeutics, Inc.

            23.4.17.1. Overview

            23.4.17.2. Key Financials

            23.4.17.3. Product Portfolio

            23.4.17.4. Sales Footprint

            23.4.17.5. SWOT Analysis

            23.4.17.6. Key Development

            23.4.17.7. Strategy

        23.4.18. Becton, Dickinson and Company

            23.4.18.1. Overview

            23.4.18.2. Key Financials

            23.4.18.3. Product Portfolio

            23.4.18.4. Sales Footprint

            23.4.18.5. SWOT Analysis

            23.4.18.6. Key Development

            23.4.18.7. Strategy

        23.4.19. Novartis AG

            23.4.19.1. Overview

            23.4.19.2. Key Financials

            23.4.19.3. Product Portfolio

            23.4.19.4. Sales Footprint

            23.4.19.5. SWOT Analysis

            23.4.19.6. Key Development

            23.4.19.7. Strategy

        23.4.20. Perrigo Company plc

            23.4.20.1. Overview

            23.4.20.2. Key Financials

            23.4.20.3. Product Portfolio

            23.4.20.4. Sales Footprint

            23.4.20.5. SWOT Analysis

            23.4.20.6. Key Development

            23.4.20.7. Strategy

        23.4.21. AstraZeneca

            23.4.21.1. Overview

            23.4.21.2. Key Financials

            23.4.21.3. Product Portfolio

            23.4.21.4. Sales Footprint

            23.4.21.5. SWOT Analysis

            23.4.21.6. Key Development

            23.4.21.7. Strategy

        23.4.22. Essity AB (BSN Medical)

            23.4.22.1. Overview

            23.4.22.2. Key Financials

            23.4.22.3. Product Portfolio

            23.4.22.4. Sales Footprint

            23.4.22.5. SWOT Analysis

            23.4.22.6. Key Development

            23.4.22.7. Strategy

        23.4.23. Boen Healthcare Co., Ltd

            23.4.23.1. Overview

            23.4.23.2. Key Financials

            23.4.23.3. Product Portfolio

            23.4.23.4. Sales Footprint

            23.4.23.5. SWOT Analysis

            23.4.23.6. Key Development

            23.4.23.7. Strategy

        23.4.24. Hakuzo Medical Asia Co., Ltd

            23.4.24.1. Overview

            23.4.24.2. Key Financials

            23.4.24.3. Product Portfolio

            23.4.24.4. Sales Footprint

            23.4.24.5. SWOT Analysis

            23.4.24.6. Key Development

            23.4.24.7. Strategy

        23.4.25. Organogenesis Holdings Inc

            23.4.25.1. Overview

            23.4.25.2. Key Financials

            23.4.25.3. Product Portfolio

            23.4.25.4. Sales Footprint

            23.4.25.5. SWOT Analysis

            23.4.25.6. Key Development

            23.4.25.7. Strategy

        23.4.26. PAUL HARTMANN AG

            23.4.26.1. Overview

            23.4.26.2. Key Financials

            23.4.26.3. Product Portfolio

            23.4.26.4. Sales Footprint

            23.4.26.5. SWOT Analysis

            23.4.26.6. Key Development

            23.4.26.7. Strategy

        23.4.27. Alleva Medical Ltd. (Devon Medical Products)

            23.4.27.1. Overview

            23.4.27.2. Key Financials

            23.4.27.3. Product Portfolio

            23.4.27.4. Sales Footprint

            23.4.27.5. SWOT Analysis

            23.4.27.6. Key Development

            23.4.27.7. Strategy

        23.4.28. Olle Larsson Holding AG (Medela AG)

            23.4.28.1. Overview

            23.4.28.2. Key Financials

            23.4.28.3. Product Portfolio

            23.4.28.4. Sales Footprint

            23.4.28.5. SWOT Analysis

            23.4.28.6. Key Development

            23.4.28.7. Strategy

        23.4.29. Avery Dennison Corporation

            23.4.29.1. Overview

            23.4.29.2. Key Financials

            23.4.29.3. Product Portfolio

            23.4.29.4. Sales Footprint

            23.4.29.5. SWOT Analysis

            23.4.29.6. Key Development

            23.4.29.7. Strategy

        23.4.30. Oneness Biotech

            23.4.30.1. Overview

            23.4.30.2. Key Financials

            23.4.30.3. Product Portfolio

            23.4.30.4. Sales Footprint

            23.4.30.5. SWOT Analysis

            23.4.30.6. Key Development

            23.4.30.7. Strategy

        23.4.31. Vericel Corporation

            23.4.31.1. Overview

            23.4.31.2. Key Financials

            23.4.31.3. Product Portfolio

            23.4.31.4. Sales Footprint

            23.4.31.5. SWOT Analysis

            23.4.31.6. Key Development

            23.4.31.7. Strategy

        23.4.32. Marine Polymer Technologies Inc

            23.4.32.1. Overview

            23.4.32.2. Key Financials

            23.4.32.3. Product Portfolio

            23.4.32.4. Sales Footprint

            23.4.32.5. SWOT Analysis

            23.4.32.6. Key Development

            23.4.32.7. Strategy

        23.4.33. SIGVARIS GROUP

            23.4.33.1. Overview

            23.4.33.2. Key Financials

            23.4.33.3. Product Portfolio

            23.4.33.4. Sales Footprint

            23.4.33.5. SWOT Analysis

            23.4.33.6. Key Development

            23.4.33.7. Strategy

        23.4.34. Taro Pharmaceuticals

            23.4.34.1. Overview

            23.4.34.2. Key Financials

            23.4.34.3. Product Portfolio

            23.4.34.4. Sales Footprint

            23.4.34.5. SWOT Analysis

            23.4.34.6. Key Development

            23.4.34.7. Strategy

        23.4.35. Prasco Laboratories.

            23.4.35.1. Overview

            23.4.35.2. Key Financials

            23.4.35.3. Product Portfolio

            23.4.35.4. Sales Footprint

            23.4.35.5. SWOT Analysis

            23.4.35.6. Key Development

            23.4.35.7. Strategy

24. Assumptions and Acronyms Used

25. Research Methodology

Don't pay for what you don't need

Customize your report by selecting specific countries or regions and save 30%!

List of Tables

Table 01: Global Market Size (US$ million) Analysis 2018 to 2022 and Forecast 2023 to 2033, By Product

Table 02: Global Market Size (US$ million) Analysis 2018 to 2022 and Forecast 2023 to 2033, By Product

Table 03: Global Market Size (US$ million) Analysis 2018 to 2022 and Forecast 2023 to 2033, By Product

Table 04: Global Market Size (US$ million) Analysis 2018 to 2022 and Forecast 2023 to 2033, By Product

Table 05: Global Market Size (US$ million) Analysis 2018 to 2022 and Forecast 2023 to 2033, By Wound Type

Table 06: Global Market Size (US$ million) Analysis 2018 to 2022 and Forecast 2023 to 2033, By Distribution Channel

Table 07 (A): Global Market Size (US$ million) Analysis 2018 to 2022 and Forecast 2023 to 2033, By Region

Table 07 (B): Global Market Volume (‘000 Units) Analysis 2018 to 2022 and Forecast 2023 to 2033, By Region

Table 08: North America Market Size (US$ million) Analysis 2018 to 2022 and Forecast 2023 to 2033, By Product

Table 09: North America Market Size (US$ million) Analysis 2018 to 2022 and Forecast 2023 to 2033, By Product

Table 10: North America Market Size (US$ million) Analysis 2018 to 2022 and Forecast 2023 to 2033, By Product

Table 11: North America Market Size (US$ million) Analysis 2018 to 2022 and Forecast 2023 to 2033, By Product

Table 12: North America Market Volume ('000 Units) Analysis 2018 to 2022 and Forecast 2023 to 2033, By Product

Table 13: North America Market Volume ('000 Units) Analysis 2018 to 2022 and Forecast 2023 to 2033, By Product

Table 14: North America Market Volume ('000 Units) Analysis 2018 to 2022 and Forecast 2023 to 2033, By Product

Table 15: North America Market Size (US$ million) Analysis 2018 to 2022 and Forecast 2023 to 2033, By Wound Type

Table 16: North America Market Size (US$ million) Analysis 2018 to 2022 and Forecast 2023 to 2033, By Distribution Channel

Table 17: North America Market Size (US$ million) Analysis 2018 to 2022 and Forecast 2023 to 2033, By Country

Table 18: Latin America Market Size (US$ million) Analysis 2018 to 2022 and Forecast 2023 to 2033, By Product

Table 19: Latin America Market Size (US$ million) Analysis 2018 to 2022 and Forecast 2023 to 2033, By Product

Table 20: Latin America Market Size (US$ million) Analysis 2018 to 2022 and Forecast 2023 to 2033, By Product

Table 21: Latin America Market Size (US$ million) Analysis 2018 to 2022 and Forecast 2023 to 2033, By Product

Table 22: Latin America Market Volume ('000 Units) Analysis 2018 to 2022 and Forecast 2023 to 2033, By Product

Table 23: Latin America Market Volume ('000 Units) Analysis 2018 to 2022 and Forecast 2023 to 2033, By Product

Table 24: Latin America Market Volume ('000 Units) Analysis 2018 to 2022 and Forecast 2023 to 2033, By Product

Table 25: Latin America Market Size (US$ million) Analysis 2018 to 2022 and Forecast 2023 to 2033, By Wound Type

Table 26: Latin America Market Size (US$ million) Analysis 2018 to 2022 and Forecast 2023 to 2033, By Distribution Channel

Table 27: Latin America Market Size (US$ million) Analysis 2018 to 2022 and Forecast 2023 to 2033, By Country

Table 28: East Asia Market Size (US$ million) Analysis 2018 to 2022 and Forecast 2023 to 2033, By Product

Table 29: East Asia Market Size (US$ million) Analysis 2018 to 2022 and Forecast 2023 to 2033, By Product

Table 30: East Asia Market Size (US$ million) Analysis 2018 to 2022 and Forecast 2023 to 2033, By Product

Table 31: East Asia Market Size (US$ million) Analysis 2018 to 2022 and Forecast 2023 to 2033, By Product

Table 32: East Asia Market Volume ('000 Units) Analysis 2018 to 2022 and Forecast 2023 to 2033, By Product

Table 33: East Asia Market Volume ('000 Units) Analysis 2018 to 2022 and Forecast 2023 to 2033, By Product

Table 34: East Asia Market Volume ('000 Units) Analysis 2018 to 2022 and Forecast 2023 to 2033, By Product

Table 35: East Asia Market Size (US$ million) Analysis 2018 to 2022 and Forecast 2023 to 2033, By Wound Type

Table 36: East Asia Market Size (US$ million) Analysis 2018 to 2022 and Forecast 2023 to 2033, By Distribution Channel

Table 37: East Asia Market Size (US$ million) Analysis 2018 to 2022 and Forecast 2023 to 2033, By Country

Table 38: South Asia and Pacific Market Size (US$ million) Analysis 2018 to 2022 and Forecast 2023 to 2033, By Product

Table 39: South Asia and Pacific Market Size (US$ million) Analysis 2018 to 2022 and Forecast 2023 to 2033, By Product

Table 40: South Asia and Pacific Market Size (US$ million) Analysis 2018 to 2022 and Forecast 2023 to 2033, By Product

Table 41: South Asia and Pacific Market Size (US$ million) Analysis 2018 to 2022 and Forecast 2023 to 2033, By Product

Table 42: South Asia and Pacific Market Size (US$ million) Analysis 2018 to 2022 and Forecast 2023 to 2033, By Product

Table 43: South Asia and Pacific Market Size (US$ million) Analysis 2018 to 2022 and Forecast 2023 to 2033, By Product

Table 44: South Asia and Pacific Market Size (US$ million) Analysis 2018 to 2022 and Forecast 2023 to 2033, By Product

Table 45: South Asia and Pacific Market Size (US$ million) Analysis 2018 to 2022 and Forecast 2023 to 2033, By Wound Type

Table 46: South Asia and Pacific Market Size (US$ million) Analysis 2018 to 2022 and Forecast 2023 to 2033, By Distribution Channel

Table 47: South Asia and Pacific Market Size (US$ million) Analysis 2018 to 2022 and Forecast 2023 to 2033, By Country

Table 48: Western Europe Market Size (US$ million) Analysis 2018 to 2022 and Forecast 2023 to 2033, By Product

Table 49: Western Europe Market Size (US$ million) Analysis 2018 to 2022 and Forecast 2023 to 2033, By Product

Table 50: Western Europe Market Size (US$ million) Analysis 2018 to 2022 and Forecast 2023 to 2033, By Product

Table 51: Western Europe Market Size (US$ million) Analysis 2018 to 2022 and Forecast 2023 to 2033, By Product

Table 52: Western Europe Market Volume ('000 Units) Analysis 2018 to 2022 and Forecast 2023 to 2033, By Product

Table 53: Western Europe Market Volume ('000 Units) Analysis 2018 to 2022 and Forecast 2023 to 2033, By Product

Table 54: Western Europe Market Volume ('000 Units) Analysis 2018 to 2022 and Forecast 2023 to 2033, By Product

Table 55: Western Europe Market Size (US$ million) Analysis 2018 to 2022 and Forecast 2023 to 2033, By Wound Type

Table 56: Western Europe Market Size (US$ million) Analysis 2018 to 2022 and Forecast 2023 to 2033, By Distribution Channel

Table 57: Western Europe Market Size (US$ million) Analysis 2018 to 2022 and Forecast 2023 to 2033, By Country

Table 58: Eastern Europe Market Size (US$ million) Analysis 2018 to 2022 and Forecast 2023 to 2033, By Product

Table 59: Eastern Europe Market Size (US$ million) Analysis 2018 to 2022 and Forecast 2023 to 2033, By Product

Table 60: Eastern Europe Market Size (US$ million) Analysis 2018 to 2022 and Forecast 2023 to 2033, By Product

Table 61: Eastern Europe Market Size (US$ million) Analysis 2018 to 2022 and Forecast 2023 to 2033, By Product

Table 62: Eastern Europe Market Volume ('000 Units) Analysis 2018 to 2022 and Forecast 2023 to 2033, By Product

Table 63: Eastern Europe Market Volume ('000 Units) Analysis 2018 to 2022 and Forecast 2023 to 2033, By Product

Table 64: Eastern Europe Market Volume ('000 Units) Analysis 2018 to 2022 and Forecast 2023 to 2033, By Product

Table 65: Eastern Europe Market Size (US$ million) Analysis 2018 to 2022 and Forecast 2023 to 2033, By Wound Type

Table 66: Eastern Europe Market Size (US$ million) Analysis 2018 to 2022 and Forecast 2023 to 2033, By Distribution Channel

Table 67: Eastern Europe Market Size (US$ million) Analysis 2018 to 2022 and Forecast 2023 to 2033, By Country

Table 68: Central Asia Market Size (US$ million) Analysis 2018 to 2022 and Forecast 2023 to 2033, By Product

Table 69: Central Asia Market Size (US$ million) Analysis 2018 to 2022 and Forecast 2023 to 2033, By Product

Table 70: Central Asia Market Size (US$ million) Analysis 2018 to 2022 and Forecast 2023 to 2033, By Product

Table 71: Central Asia Market Size (US$ million) Analysis 2018 to 2022 and Forecast 2023 to 2033, By Product

Table 72: Central Asia Market Size (US$ million) Analysis 2018 to 2022 and Forecast 2023 to 2033, By Product

Table 73: Central Asia Market Size (US$ million) Analysis 2018 to 2022 and Forecast 2023 to 2033, By Product

Table 74: Central Asia Market Size (US$ million) Analysis 2018 to 2022 and Forecast 2023 to 2033, By Product

Table 75: Central Asia Market Size (US$ million) Analysis 2018 to 2022 and Forecast 2023 to 2033, By Wound Type

Table 76: Central Asia Market Size (US$ million) Analysis 2018 to 2022 and Forecast 2023 to 2033, By Distribution Channel

Table 77: Russia and Belarus Market Size (US$ million) Analysis 2018 to 2022 and Forecast 2023 to 2033, By Product

Table 78: Russia and Belarus Market Size (US$ million) Analysis 2018 to 2022 and Forecast 2023 to 2033, By Product

Table 79: Russia and Belarus Market Size (US$ million) Analysis 2018 to 2022 and Forecast 2023 to 2033, By Product

Table 80: Russia and Belarus Market Size (US$ million) Analysis 2018 to 2022 and Forecast 2023 to 2033, By Product

Table 81: Russia and Belarus Market Volume ('000 Units) Analysis 2018 to 2022 and Forecast 2023 to 2033, By Product

Table 82: Russia and Belarus Market Volume ('000 Units) Analysis 2018 to 2022 and Forecast 2023 to 2033, By Product

Table 83: Russia and Belarus Market Volume ('000 Units) Analysis 2018 to 2022 and Forecast 2023 to 2033, By Product

Table 84: Russia and Belarus Market Size (US$ million) Analysis 2018 to 2022 and Forecast 2023 to 2033, By Wound Type

Table 85: Russia and Belarus Market Size (US$ million) Analysis 2018 to 2022 and Forecast 2023 to 2033, By Distribution Channel

Table 86: Balkan and Baltic Countries Market Size (US$ million) Analysis 2018 to 2022 and Forecast 2023 to 2033, By Product

Table 87: Balkan and Baltic Countries Market Size (US$ million) Analysis 2018 to 2022 and Forecast 2023 to 2033, By Product

Table 88: Balkan and Baltic Countries Market Size (US$ million) Analysis 2018 to 2022 and Forecast 2023 to 2033, By Product

Table 89: Balkan and Baltic Countries Market Size (US$ million) Analysis 2018 to 2022 and Forecast 2023 to 2033, By Product

Table 90: Balkan and Baltic Countries Market Volume ('000 Units) Analysis 2018 to 2022 and Forecast 2023 to 2033, By Product

Table 91: Balkan and Baltic Countries Market Volume ('000 Units) Analysis 2018 to 2022 and Forecast 2023 to 2033, By Product

Table 92: Balkan and Baltic Countries Market Volume ('000 Units) Analysis 2018 to 2022 and Forecast 2023 to 2033, By Product

Table 93: Balkan and Baltic Countries Market Size (US$ million) Analysis 2018 to 2022 and Forecast 2023 to 2033, By Wound Type

Table 94: Balkan and Baltic Countries Market Size (US$ million) Analysis 2018 to 2022 and Forecast 2023 to 2033, By Distribution Channel

Table 95: Middle East and Africa Market Size (US$ million) Analysis 2018 to 2022 and Forecast 2023 to 2033, By Product

Table 96: Middle East and Africa Market Size (US$ million) Analysis 2018 to 2022 and Forecast 2023 to 2033, By Product

Table 97: Middle East and Africa Market Size (US$ million) Analysis 2018 to 2022 and Forecast 2023 to 2033, By Product

Table 98: Middle East and Africa Market Size (US$ million) Analysis 2018 to 2022 and Forecast 2023 to 2033, By Product

Table 99: Middle East and Africa Market Volume ('000 Units) Analysis 2018 to 2022 and Forecast 2023 to 2033, By Product

Table 100: Middle East and Africa Market Volume ('000 Units) Analysis 2018 to 2022 and Forecast 2023 to 2033, By Product

Table 101: Middle East and Africa Market Volume ('000 Units) Analysis 2018 to 2022 and Forecast 2023 to 2033, By Product

Table 102: Middle East and Africa Market Size (US$ million) Analysis 2018 to 2022 and Forecast 2023 to 2033, By Wound Type

Table 103: Middle East and Africa Market Size (US$ million) Analysis 2018 to 2022 and Forecast 2023 to 2033, By Distribution Channel

Table 104: Middle East and Africa Market Size (US$ million) Analysis 2018 to 2022 and Forecast 2023 to 2033, By Country
Sabyasachi Ghosh
Sabyasachi Ghosh

Principal Consultant

Talk to Analyst

Find your sweet spots for generating winning opportunities in this market.

List of Charts

Figure 01: Global Market Volume ('000 Units) Analysis, 2018 to 2022

Figure 02: Global Market Volume ('000 Units) & Y-o-Y Growth (%) Analysis, 2023 to 2033

Figure 03: Global Average Pricing Analysis Benchmark US$ (Unit) (2022), Negative Pressure Wound Therapy (NPWT) Devices

Figure 04: Global Average Pricing Analysis Benchmark US$ (Unit) (2022), Others

Figure 05: Global Average Pricing Analysis Benchmark US$ (Unit) (2022), Antimicrobial Dressings

Figure 06: Global Average Pricing Analysis Benchmark US$ (Unit) (2022), Foam Dressings

Figure 07: Global Market Value (US$ million) Analysis 2018 to 2022 and Forecast 2023 to 2033

Figure 08: Global Market Absolute $ Opportunity, 2023 to 2033

Figure 09: Global Market Share, By Product, 2023 and 2033

Figure 10: Global Market Y-o-Y Growth Projections by Product, 2023 to 2033

Figure 11: Global Market Attractiveness Analysis by Product, 2023 to 2033

Figure 12: Global Market Share, By Wound Type, 2023 and 2033

Figure 13: Global Market Y-o-Y Growth Projections by Wound Type, 2023 to 2033

Figure 14: Global Market Attractiveness Analysis by Wound Type, 2023 to 2033

Figure 15: Global Market Share, By Distribution Channel, 2023 and 2033

Figure 16: Global Market Y-o-Y Growth Projections by Distribution Channel, 2023 to 2033

Figure 17: Global Market Attractiveness Analysis by Distribution Channel, 2023 to 2033

Figure 18: Global Market Share, By Region,

Figure 19: Global Market Attractiveness Analysis by Region, 2023 to 2033

Figure 20: Global Market Attractiveness Analysis by Region, 2023 to 2033

Figure 21: North America Market Share, By Product, 2023 (E)

Figure 22: North America Market Share, By Wound Type, 2023 (E)

Figure 23: North America Market Share, By Wound Type, 2023 (E)

Figure 24: North America Market Value Share by Country (2023)

Figure 25: North America Market Value (US$ million) Analysis 2018 to 2022 and Forecast 2023 to 2033

Figure 26: North America Market Attractiveness Analysis by Product, 2023 to 2033

Figure 27: North America Market Attractiveness Analysis by Wound Type, 2023 to 2033

Figure 28: North America Market Attractiveness Analysis by Country, 2023 to 2033

Figure 29: North America Market Attractiveness Analysis by Distribution Channel, 2023 to 2033

Figure 30: United States Market Share Analysis (%) by Product Type, 2022 and 2033

Figure 31: United States Market Share Analysis (%) by Wound Type, 2022 and 2033

Figure 32: United States Market Share Analysis (%) by Distribution Channel, 2022 and 2033

Figure 33: Canada Market Share Analysis (%) by Product Type, 2022 and 2033

Figure 34: Canada Market Share Analysis (%) by Wound Type, 2022 and 2033

Figure 35: Canada Market Share Analysis (%) by Distribution Channel, 2022 and 2033

Figure 36: Latin America Market Share, By Product, 2023 (E)

Figure 37: Latin America Market Share, By Distribution Channel, 2023 (E)

Figure 38: Latin America Market Share, By Wound Type, 2023 (E)

Figure 39: Latin America Market Value Share by Country (2023)

Figure 40: Latin America Market Value (US$ million) Analysis 2018 to 2022 and Forecast 2023 to 2033

Figure 41: Latin America Market Attractiveness Analysis by Product, 2023 to 2033

Figure 42: Latin America Market Attractiveness Analysis by Wound Type, 2023 to 2033

Figure 43: Latin America Market Attractiveness Analysis by Country, 2023 to 2033

Figure 44: Latin America Market Attractiveness Analysis by Distribution Channel, 2023 to 2033

Figure 45: Brazil Market Share Analysis (%) by Product Type, 2022 and 2033

Figure 46: Brazil Market Share Analysis (%) by Wound Type, 2022 and 2033

Figure 47: Brazil Market Share Analysis (%) by Distribution Channel, 2022 and 2033

Figure 48: Mexico Market Share Analysis (%) by Product Type, 2022 and 2033

Figure 49: Mexico Market Share Analysis (%) by Wound Type, 2022 and 2033

Figure 50: Mexico Market Share Analysis (%) by Distribution Channel, 2022 and 2033

Figure 51: Argentina Market Share Analysis (%) by Product Type, 2022 and 2033

Figure 52: Argentina Market Share Analysis (%) by Wound Type, 2022 and 2033

Figure 53: Argentina Market Share Analysis (%) by Distribution Channel, 2022 and 2033

Figure 54: Chile Market Share Analysis (%) by Product Type, 2022 and 2033

Figure 55: Chile Market Share Analysis (%) by Wound Type, 2022 and 2033

Figure 56: Chile Market Share Analysis (%) by Distribution Channel, 2022 and 2033

Figure 57: Peru Market Share Analysis (%) by Product Type, 2022 and 2033

Figure 58: Peru Market Share Analysis (%) by Wound Type, 2022 and 2033

Figure 59: Peru Market Share Analysis (%) by Distribution Channel, 2022 and 2033

Figure 60: Columbia Market Share Analysis (%) by Product Type, 2022 and 2033

Figure 61: Columbia Market Share Analysis (%) by Wound Type, 2022 and 2033

Figure 62: Columbia Market Share Analysis (%) by Distribution Channel, 2022 and 2033

Figure 63: East Asia Market Share, By Product, 2023 (E)

Figure 64: East Asia Market Share, By Distribution Channel, 2023 (E)

Figure 65: East Asia Market Share, By Wound Type, 2023 (E)

Figure 66: East Asia Market Value Share by Country (2023)

Figure 67: East Asia Market Value (US$ million) Analysis 2018 to 2022 and Forecast 2023 to 2033

Figure 68: East Asia Market Attractiveness Analysis by Product, 2023 to 2033

Figure 69: East Asia Market Attractiveness Analysis by Wound Type, 2023 to 2033

Figure 70: East Asia Market Attractiveness Analysis by Country, 2023 to 2033

Figure 71: East Asia Market Attractiveness Analysis by Distribution Channel, 2023 to 2033

Figure 72: China Market Share Analysis (%) by Product Type, 2022 and 2033

Figure 73: China Market Share Analysis (%) by Wound Type, 2022 and 2033

Figure 74: China Market Share Analysis (%) by Distribution Channel, 2022 and 2033

Figure 75: Japan Market Share Analysis (%) by Product Type, 2022 and 2033

Figure 76: Japan Market Share Analysis (%) by Wound Type, 2022 and 2033

Figure 77: Japan Market Share Analysis (%) by Distribution Channel, 2022 and 2033

Figure 78: South Korea Market Share Analysis (%) by Product Type, 2022 and 2033

Figure 79: South Korea Market Share Analysis (%) by Wound Type, 2022 and 2033

Figure 80: South Korea Market Share Analysis (%) by Distribution Channel, 2022 and 2033

Figure 81: South Asia and Pacific Market Share, By Product, 2023 (E)

Figure 82: South Asia and Pacific Market Share, By Distribution Channel, 2023 (E)

Figure 83: South Asia and Pacific Market Share, By Wound Type, 2023 (E)

Figure 84: South Asia and Pacific Market Value Share by Country (2023)

Figure 85: South Asia and Pacific Market Value (US$ million) Analysis 2018 to 2022 and Forecast 2023 to 2033

Figure 86: South Asia and Pacific Market Attractiveness Analysis by Product, 2023 to 2033

Figure 87: South Asia and Pacific Market Attractiveness Analysis by Wound Type, 2023 to 2033

Figure 88: South Asia and Pacific Market Attractiveness Analysis by Country, 2023 to 2033

Figure 89: South Asia and Pacific Market Attractiveness Analysis by Distribution Channel, 2023 to 2033

Figure 90: India Market Share Analysis (%) by Product Type, 2022 and 2033

Figure 91: India Market Share Analysis (%) by Wound Type, 2022 and 2033

Figure 92: India Market Share Analysis (%) by Distribution Channel, 2022 and 2033

Figure 93: Indonesia Market Share Analysis (%) by Product Type, 2022 and 2033

Figure 94: Indonesia Market Share Analysis (%) by Wound Type, 2022 and 2033

Figure 95: Indonesia Market Share Analysis (%) by Distribution Channel, 2022 and 2033

Figure 96: Thailand Market Share Analysis (%) by Product Type, 2022 and 2033

Figure 97: Thailand Market Share Analysis (%) by Wound Type, 2022 and 2033

Figure 98: Thailand Market Share Analysis (%) by Distribution Channel, 2022 and 2033

Figure 99: Philippines Market Share Analysis (%) by Product Type, 2022 and 2033

Figure 100: Philippines Market Share Analysis (%) by Wound Type, 2022 and 2033

Figure 101: Philippines Market Share Analysis (%) by Distribution Channel, 2022 and 2033

Figure 102: Malaysia Market Share Analysis (%) by Product Type, 2022 and 2033

Figure 103: Malaysia Market Share Analysis (%) by Wound Type, 2022 and 2033

Figure 104: Malaysia Market Share Analysis (%) by Distribution Channel, 2022 and 2033

Figure 105: Vietnam Market Share Analysis (%) by Product Type, 2022 and 2033

Figure 106: Vietnam Market Share Analysis (%) by Wound Type, 2022 and 2033

Figure 107: Vietnam Market Share Analysis (%) by Distribution Channel, 2022 and 2033

Figure 108: Singapore Market Share Analysis (%) by Product Type, 2022 and 2033

Figure 109: Singapore Market Share Analysis (%) by Wound Type, 2022 and 2033

Figure 110: Singapore Market Share Analysis (%) by Distribution Channel, 2022 and 2033

Figure 111: Australia and New Zealand Market Share Analysis (%) by Product Type, 2022 and 2033

Figure 112: Australia and New Zealand Market Share Analysis (%) by Wound Type, 2022 and 2033

Figure 113: Australia and New Zealand Market Share Analysis (%) by Distribution Channel, 2022 and 2033

Figure 114: Western Europe Market Share, By Product, 2023 (E)

Figure 115: Western Europe Market Share, By Distribution Channel, 2023 (E)

Figure 116: Western Europe Market Share, By Wound Type, 2023 (E)

Figure 117: Western Europe Market Value Share by Country (2023)

Figure 118: Western Europe Market Value (US$ million) Analysis 2018 to 2022 and Forecast 2023 to 2033

Figure 119: Western Europe Market Attractiveness Analysis by Product, 2023 to 2033

Figure 120: Western Europe Market Attractiveness Analysis by Wound Type, 2023 to 2033

Figure 121: Western Europe Market Attractiveness Analysis by Country, 2023 to 2033

Figure 122: Western Europe Market Attractiveness Analysis by Distribution Channel, 2023 to 2033

Figure 123: United Kingdom Market Share Analysis (%) by Product Type, 2022 and 2033

Figure 124: United Kingdom Market Share Analysis (%) by Wound Type, 2022 and 2033

Figure 125: United Kingdom Market Share Analysis (%) by Distribution Channel, 2022 and 2033

Figure 126: Germany Market Share Analysis (%) by Product Type, 2022 and 2033

Figure 127: Germany Market Share Analysis (%) by Wound Type, 2022 and 2033

Figure 128: Germany Market Share Analysis (%) by Distribution Channel, 2022 and 2033

Figure 129: France Market Share Analysis (%) by Product Type, 2022 and 2033

Figure 130: France Market Share Analysis (%) by Wound Type, 2022 and 2033

Figure 131: France Market Share Analysis (%) by Distribution Channel, 2022 and 2033

Figure 132: Italy Market Share Analysis (%) by Product Type, 2022 and 2033

Figure 133: Italy Market Share Analysis (%) by Wound Type, 2022 and 2033

Figure 134: Italy Market Share Analysis (%) by Distribution Channel, 2022 and 2033

Figure 135: Spain Market Share Analysis (%) by Product Type, 2022 and 2033

Figure 136: Spain Market Share Analysis (%) by Wound Type, 2022 and 2033

Figure 137: Spain Market Share Analysis (%) by Distribution Channel, 2022 and 2033

Figure 138: BENELUX Market Share Analysis (%) by Product Type, 2022 and 2033

Figure 139: BENELUX Market Share Analysis (%) by Wound Type, 2022 and 2033

Figure 140: BENELUX Market Share Analysis (%) by Distribution Channel, 2022 and 2033

Figure 141: Nordic Countries Market Share Analysis (%) by Product Type, 2022 and 2033

Figure 142: Nordic Countries Market Share Analysis (%) by Wound Type, 2022 and 2033

Figure 143: Nordic Countries Market Share Analysis (%) by Distribution Channel, 2022 and 2033

Figure 144: Eastern Europe Market Share, By Product, 2023 (E)

Figure 145: Eastern Europe Market Share, By Distribution Channel, 2023 (E)

Figure 146: Eastern Europe Market Share, By Wound Type, 2023 (E)

Figure 147: Eastern Europe Market Value Share by Country (2023)

Figure 148: Eastern Europe Market Value (US$ million) Analysis 2018 to 2022 and Forecast 2023 to 2033

Figure 149: Eastern Europe Market Attractiveness Analysis by Product, 2023 to 2033

Figure 150: Eastern Europe Market Attractiveness Analysis by Wound Type, 2023 to 2033

Figure 151: Eastern Europe Market Attractiveness Analysis by Country, 2023 to 2033

Figure 152: Eastern Europe Market Attractiveness Analysis by Distribution Channel, 2023 to 2033

Figure 153: Poland Market Share Analysis (%) by Product Type, 2022 and 2033

Figure 154: Poland Market Share Analysis (%) by Wound Type, 2022 and 2033

Figure 155: Poland Market Share Analysis (%) by Distribution Channel, 2022 and 2033

Figure 156: Romania Market Share Analysis (%) by Product Type, 2022 and 2033

Figure 157: Romania Market Share Analysis (%) by Wound Type, 2022 and 2033

Figure 158: Romania Market Share Analysis (%) by Distribution Channel, 2022 and 2033

Figure 159: Hungary Market Share Analysis (%) by Product Type, 2022 and 2033

Figure 160: Hungary Market Share Analysis (%) by Wound Type, 2022 and 2033

Figure 161: Hungary Market Share Analysis (%) by Distribution Channel, 2022 and 2033

Figure 162: Czech Republic Market Share Analysis (%) by Product Type, 2022 and 2033

Figure 163: Czech Republic Market Share Analysis (%) by Wound Type, 2022 and 2033

Figure 164: Czech Republic Market Share Analysis (%) by Distribution Channel, 2022 and 2033

Figure 165: Central Asia Market Share, By Product, 2023 (E)

Figure 166: Central Asia Market Share, By Distribution Channel, 2023 (E)

Figure 167: Central Asia Market Share, By Wound Type, 2023 (E)

Figure 168: Central Asia Market Value (US$ million) Analysis 2018 to 2022 and Forecast 2023 to 2033

Figure 169: Central Asia Market Attractiveness Analysis by Product, 2023 to 2033

Figure 170: Central Asia Market Attractiveness Analysis by Wound Type, 2023 to 2033

Figure 171: Central Asia Market Attractiveness Analysis by Distribution Channel, 2023 to 2033

Figure 172: Russia and Belarus Market Share, By Product, 2023 (E)

Figure 173: Russia and Belarus Market Share, By Distribution Channel, 2023 (E)

Figure 174: Russia and Belarus Market Share, By Wound Type, 2023 (E)

Figure 175: Russia and Belarus Market Value (US$ million) Analysis 2018 to 2022 and Forecast 2023 to 2033

Figure 176: Russia and Belarus Market Attractiveness Analysis by Product, 2023 to 2033

Figure 177: Russia and Belarus Market Attractiveness Analysis by Wound Type, 2023 to 2033

Figure 178: Russia and Belarus Market Attractiveness Analysis by Distribution Channel, 2023 to 2033

Figure 179: Balkan and Baltic Countries Market Share, By Product, 2023 (E)

Figure 180: Balkan and Baltic Countries Market Share, By Distribution Channel, 2023 (E)

Figure 181: Balkan and Baltic Countries Market Share, By Wound Type, 2023 (E)

Figure 182: Balkan and Baltic Countries Market Value (US$ million) Analysis 2018 to 2022 and Forecast 2023 to 2033

Figure 183: Balkan and Baltic Countries Market Attractiveness Analysis by Product, 2023 to 2033

Figure 184: Balkan and Baltic Countries Market Attractiveness Analysis by Wound Type, 2023 to 2033

Figure 185: Balkan and Baltic Countries Market Attractiveness Analysis by Distribution Channel, 2023 to 2033

Figure 186: Middle East and Africa Market Share, By Product, 2023 (E)

Figure 187: Middle East and Africa Market Share, By Distribution Channel, 2023 (E)

Figure 188: Middle East and Africa Market Share, By Wound Type, 2023 (E)

Figure 189: Middle East and Africa Market Value Share by Country (2023)

Figure 190: Middle East and Africa Market Value (US$ million) Analysis 2018 to 2022 and Forecast 2023 to 2033

Figure 191: Middle East and Africa Market Attractiveness Analysis by Product, 2023 to 2033

Figure 192: Middle East and Africa Market Attractiveness Analysis by Wound Type, 2023 to 2033

Figure 193: Middle East and Africa Market Attractiveness Analysis by Country, 2023 to 2033

Figure 194: Middle East and Africa Market Attractiveness Analysis by Distribution Channel, 2023 to 2033

Figure 195: GCC Countries Market Share Analysis (%) by Product Type, 2022 and 2033

Figure 196: GCC Countries Market Share Analysis (%) by Wound Type, 2022 and 2033

Figure 197: GCC Countries Market Share Analysis (%) by Distribution Channel, 2022 and 2033

Figure 198: Israel Market Share Analysis (%) by Product Type, 2022 and 2033

Figure 199: Israel Market Share Analysis (%) by Wound Type, 2022 and 2033

Figure 200: Israel Market Share Analysis (%) by Distribution Channel, 2022 and 2033

Figure 201: Türkiye Market Share Analysis (%) by Product Type, 2022 and 2033

Figure 202: Türkiye Market Share Analysis (%) by Wound Type, 2022 and 2033

Figure 203: Türkiye Market Share Analysis (%) by Distribution Channel, 2022 and 2033

Figure 204: South Africa Market Share Analysis (%) by Product Type, 2022 and 2033

Figure 205: South Africa Market Share Analysis (%) by Wound Type, 2022 and 2033

Figure 206: South Africa Market Share Analysis (%) by Distribution Channel, 2022 and 2033

Figure 207: North Africa Market Share Analysis (%) by Product Type, 2022 and 2033

Figure 208: North Africa Market Share Analysis (%) by Wound Type, 2022 and 2033

Figure 209: North Africa Market Share Analysis (%) by Distribution Channel, 2022 and 2033

Recommendations

Healthcare

Chronic Pulmonary Hypertension Treatment Market

Published : March 2023

Healthcare

Chronic Hepatitis B Virus Testing Market

Published : March 2023

Healthcare

Swine Respiratory Diseases Treatment Market

Published : October 2022

Explore Healthcare Insights

View Reports

Chronic Wound Care Market