Chronic Skin Redness Care Market Size and Share Forecast Outlook 2025 to 2035

The global chronic skin redness care market has been valued at USD 3,205.20 Million in 2025, and it is projected that the industry will attain a level of USD 7,401.80 Million by 2035.This translates into an absolute increase of USD 4,196.60 Million, reflecting a market expansion of more than 2.3X over the decade.Throughout the forecast window, an annualized growth rate of 8.70% has been projected, pointing toward a durable and structurally sound demand trajectory.
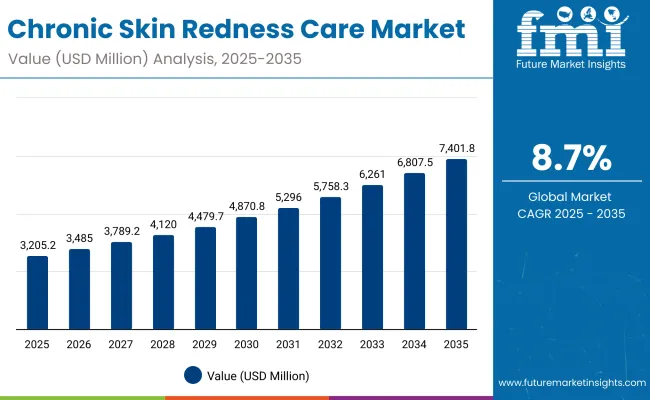
Chronic Skin Redness Care Market

Quick Stats for Chronic Skin Redness Care Market

  • Chronic Skin Redness Care Market Value (2025): USD 3,205.20 Million
  • Chronic Skin Redness Care Market Forecast Value (2035): USD 7,401.80 Million
  • Chronic Skin Redness Care Market Forecast CAGR (2025 to 2035): 8.70%
  • Leading Segment in Chronic Skin Redness Care Market in 2025: Dermatologist-tested (51.50%)
  • Key Growth Regions in Chronic Skin Redness Care Market: Asia-Pacific (China, India, Japan), North America, Europe
  • Top Key Players in Chronic Skin Redness Care Market: Eucerin, La Roche-Posay, Avene, Clinique, Bioderma, Paula’s Choice, CeraVe, Vanicream, Dermalogica, Murad

Chronic Skin Redness Care Market Key Takeaways

Metric Value
Chronic Skin Redness Care Market Estimated Value in (2025E) USD 3,205.20 Million
Chronic Skin Redness Care Market Forecast Value in (2035F) USD 7,401.80 Million
Forecast CAGR (2025 to 2035) 8.70%

From 2025 to 2030, market revenues are anticipated to progress from USD 3,205.20 Million to USD 4,870.80 Million, which equals a gain of USD 1,665.60 Million and accounts for nearly 40% of the overall ten-year expansion.During this phase, adoption will be reinforced by heightened consumer reliance on dermatologist-tested and fragrance-free formulations, as well as broader distribution through pharmacy-driven retail ecosystems.Pharmacies/drugstores have been estimated to account for 48.50% of 2025 sales, highlighting their role as the category’s strongest trust anchor.

The subsequent phase from 2030 to 2035 is expected to deliver incremental growth of USD 2,531.00 Million, pushing market revenues from USD 4,870.80 Million to USD 7,401.80 Million.This second half of the decade will likely witness acceleration from Asia-Pacific, especially China and India, where CAGRs of 17.60% and 20.40%, respectively, have been indicated.Dermatologist-tested claims will remain dominant, with a 51.50% global share in 2025 (USD 1,648.50 Million), consolidating their leadership as regulatory rigor and consumer sensitivity concerns continue to intensify.

From 2020 to 2024, steady growth was recorded as consumer awareness around redness-prone skin intensified and dermatologist-approved formulations gained traction. By 2025, the market reached USD 3,205.20 Million, and it is forecast that by 2035 revenues will achieve USD 7,401.80 Million. The momentum will be anchored by Asia-Pacific, particularly China and India, where double-digit growth has been projected. Competitive positioning is expected to favor brands with robust clinical validation, pharmacist-driven education, and oMillionichannel reach. The decade ahead will likely be defined by evidence-backed claims and barrier-repair innovation, ensuring stronger consumer trust and sustained adoption.

Why the Chronic Skin Redness Care Market is growing?

Growth in the chronic skin redness care market is being driven by a combination of rising consumer awareness, clinical validation, and expanding access to advanced dermatological solutions. Increasing diagnosis of conditions such as rosacea and post-inflammatory redness has been paired with growing demand for dermatologist-tested and hypoallergenic formulations.

Confidence in scientifically backed claims is expected to remain a decisive purchase driver, with consumers favoring products that demonstrate measurable outcomes in redness reduction and barrier repair. Expansion of distribution through pharmacies and e-commerce platforms has been accelerating accessibility, while digital health consultations and teledermatology are anticipated to reinforce adoption across both developed and emerging regions.

Strong double-digit growth in Asia-Pacific markets such as China and India is projected to act as a catalyst, supported by rising incomes and shifting skincare priorities. With innovation focused on barrier-strengthening actives and irritation-free formulations, the market is forecast to achieve sustained momentum through 2035.

Segmental Analysis

The market is segmented by claim, channel, and product type, highlighting the primary factors shaping consumer adoption and purchasing behavior. Claims include dermatologist-tested and other specialized assurances that address sensitive-skin needs. Channel classification covers pharmacies/drugstores and other outlets such as e-commerce and specialty retail, emphasizing accessibility and trust.

Based on product type, segmentation includes creams and other formats like gels, serums, and lotions, reflecting evolving consumer preferences. This structure provides clarity on how consumer trust, distribution reach, and formulation preferences are influencing the growth trajectory of the chronic skin redness care market.
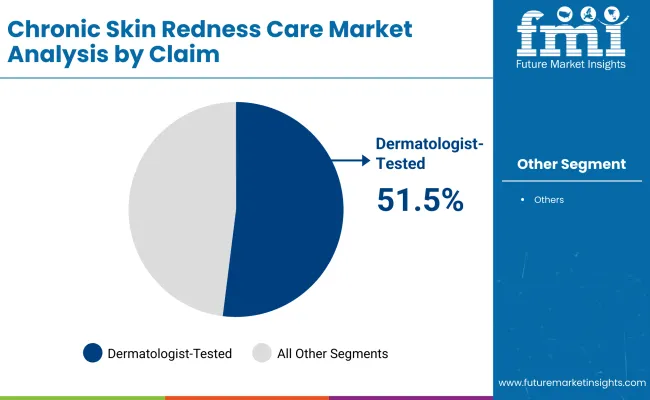
Insights into the Claim Segment with Dermatologist-tested Leading in Market Share

Chronic Skin Redness Care Market By Claim

Claim Market Value Share, 2025
Dermatologist-tested 51.5%
Others 48.5%

Dermatologist-tested products accounted for 51.5% of the global value in 2025, equal to USD 1,648.5 million, while other claims represented 48.5% at USD 1,554.04 million. The claim-based segmentation highlights dermatologist-tested products as the most influential in shaping consumer preferences. This dominance reflects rising consumer trust in clinically validated formulations that reduce irritation risks and provide proven skin benefits.

The growing prevalence of sensitive-skin conditions and the increasing role of dermatologist recommendations are expected to reinforce this segment’s leadership throughout the forecast horizon. Other claims are projected to gain relevance as innovation continues around barrier-repair and hypoallergenic benefits. Enhanced claim substantiation and evolving regulatory scrutiny are anticipated to elevate the entire segment, with dermatologist-tested offerings remaining the benchmark for reliability and effectiveness.
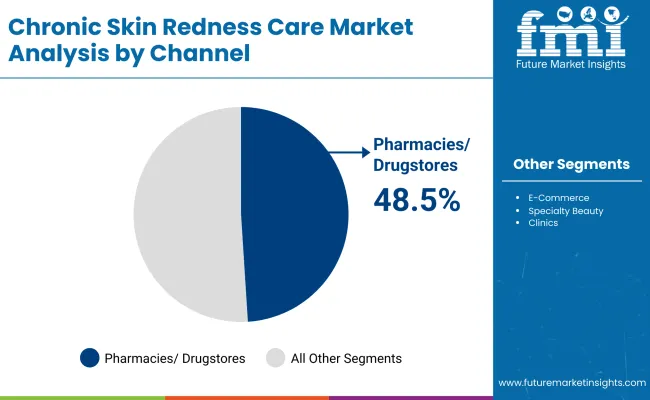
Insights into the Channel Segment with Pharmacies/Drugstores Driving Growth

Chronic Skin Redness Care Market By Channel

Channel Market Value Share, 2025
Pharmacies/drugstores 48.5%
Others 51.5%

Pharmacies/drugstores captured 48.5% of market value in 2025, equal to USD 1,551.5 million, while other channels accounted for 51.5% at USD 1,651.16 million. Distribution channel segmentation emphasizes the critical role of pharmacies and drugstores as trusted retail points. Their importance is attributed to professional guidance, pharmacist influence, and consumer confidence in medically oriented settings.

The remaining share is driven by e-commerce and specialty retail, which are expected to expand rapidly due to digital adoption and the convenience of online consultations. Over the next decade, the balance between pharmacy-led trust and digital-first accessibility is expected to define channel evolution. Pharmacies will remain vital in regions with strong professional engagement, while e-commerce is forecast to capture a growing proportion of younger, digitally native consumers.
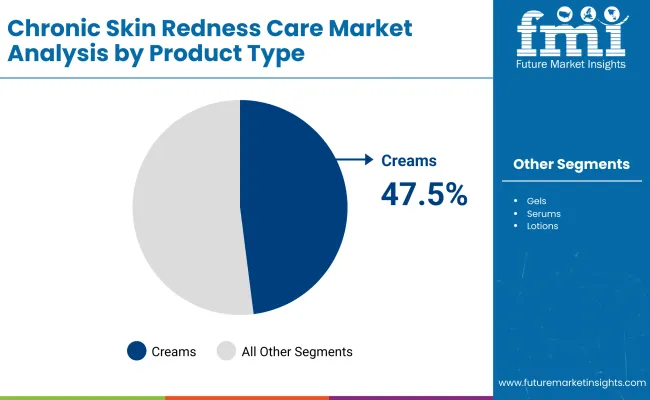
Insights into the Product Type Segment with Others Leading in Market Share

Chronic Skin Redness Care Market By Product Type

Product Type Market Value Share, 2025
Creams 47.5%
Others 52.5%

Other product types, including gels, serums, and lotions, held 52.5% of the market in 2025, equal to USD 1,683.54 million, while creams accounted for 47.5% at USD 1,519.2 million. Product type segmentation reflects diverse consumer preferences for formulations addressing redness-prone skin. The larger share of alternatives underscores the shift toward multifunctional and lightweight formats.

Creams, however, retain strong traction for their barrier-protective and emollient-rich properties. Innovation in sensorially elegant textures, fast absorption, and irritation-free actives is anticipated to fuel the expansion of emerging formats.

The next decade is forecast to witness stronger demand for lightweight alternatives, particularly among younger consumers seeking convenience and versatility. While creams will maintain importance as foundational care solutions, alternative product types are expected to set the pace for future growth, shaping the evolving preferences of the redness care consumer base.

What are the Drivers, Restraints, and Key Trends of the Chronic Skin Redness Care Market?

The chronic skin redness care market is being reshaped by clinical rigor, shifting patient-centric expectations, and regulatory tightening, while uneven affordability and infrastructure constraints continue to challenge uniform adoption across global regions, shaping both near-term access and long-term strategic positioning.

Integration of Dermatology with Digital Health Platforms

Market expansion has been reinforced by the integration of digital health technologies into dermatology workflows. Teledermatology consultations, AI-enabled skin imaging, and mobile applications for redness tracking are enabling earlier interventions and more personalized treatment pathways. These digital bridges are expected to enhance consumer trust, while also broadening access in underserved regions where specialist dermatologists remain scarce.

Importantly, integration with electronic health records is anticipated to create longitudinal data sets that validate product efficacy, accelerating regulatory approval and positioning validated regimens for sustained adoption. This digital-health convergence is shaping a future where product recommendations are embedded in remote care journeys, making the segment more resilient against geographic barriers.

Regulatory Fragmentation Across Jurisdictions

Global expansion has been constrained by fragmented regulatory environments governing cosmetic-therapeutic boundaries. Markets differ in how redness care is classified-ranging from cosmetic to quasi-drug status-leading to variations in permissible claims, testing requirements, and distribution rights.

This inconsistency increases compliance costs, delays product launches, and complicates cross-border marketing strategies. Smaller companies are disproportionately affected, as they often lack the resources to navigate diverse regulatory frameworks. As governments intensify scrutiny around “clinically tested” or “dermatologist approved” labels, inconsistencies are likely to persist, slowing harmonization. Unless regional alignment improves, innovation speed and global scaling may be dampened, forcing companies to adopt localized, fragmented go-to-market strategies.
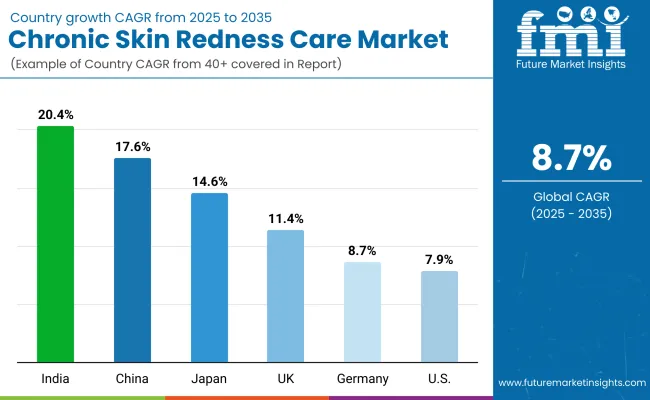
Analysis of Chronic Skin Redness Care Market By Key Countries

Chronic Skin Redness Care Market Country Wise Analysis

Country CAGR
China 17.6%
USA 7.9%
India 20.4%
UK 11.4%
Germany 8.7%
Japan 14.6%

The chronic skin redness care market demonstrates varied country-level growth trajectories, reflecting differences in healthcare access, dermatology density, consumer awareness, and regulatory frameworks. Asia-Pacific is emerging as the fastest-growing region, anchored by India at a projected CAGR of 20.4% and China at 17.6%. India’s trajectory is being shaped by greater consumer education on skin sensitivity, expanding dermatology clinics, and affordability-driven adoption of pharmacist-recommended products.

In China, double-digit growth is being reinforced by the rapid rise of dermocosmetics, Million channel retail strength, and integration of teledermatology into mainstream care. Japan is forecast to expand at 14.6%, where aging populations and high skincare awareness are expected to sustain demand for advanced formulations with clinical substantiation.

Europe shows steady momentum, with Germany at 8.7%, the UK at 11.4%, and the region overall at 8.2%. Growth here is being supported by heightened regulatory requirements for product claims, dermatologist endorsements, and consumer preference for evidence-based solutions. North America remains a mature yet expanding market, with the USA projected at 7.9% CAGR, reflecting entrenched consumer trust in dermatologist-tested brands and ongoing premiumization of skincare portfolios. These dynamics illustrate that while Asia is driving scale through rapid adoption, Europe and North America continue to provide stability through regulatory rigor and established clinical frameworks.
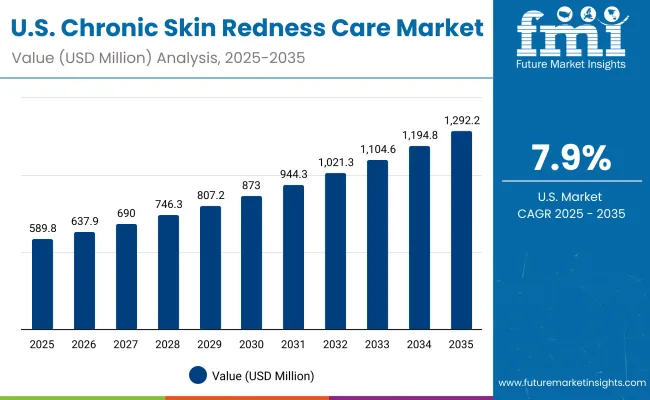
Sales Outlook for Chronic Skin Redness Care in the United States

Usa Chronic Skin Redness Care Market

Year USA Chronic Skin Redness Care Market (USD Million)
2025 589.85
2026 637.97
2027 690.03
2028 746.32
2029 807.22
2030 873.07
2031 944.31
2032 1,021.35
2033 1,104.68
2034 1,194.81
2035 1,292.29

The chronic skin redness care market in the United States is projected to expand at a CAGR of 8.16% from 2025 to 2035. This reflects steady growth supported by heightened awareness of skin sensitivity, reinforced clinical validation, and the trusted role of pharmacies and drugstores as primary distribution channels. Dermatologist endorsements are expected to strengthen consumer confidence, while e-commerce expansion will enhance accessibility for younger, digitally native consumers.

Innovation in barrier-repair actives, fragrance-free solutions, and hypoallergenic formulations is anticipated to sustain long-term category resilience. Regulatory scrutiny around clinical claims will elevate competitive standards, favoring brands with robust scientific validation. The decade ahead is forecast to see sustained momentum, with the USA market reaching a value of USD 1,292.29 million by 2035.

Dermatologist-tested formulations will remain the leading claim driving consumer adoption. Pharmacies and drugstores are projected to anchor credibility and consumer trust. Digital platforms will accelerate uptake among younger demographics seeking accessible redness care solutions.

Growth and Expansion Outlook for Chronic Skin Redness Care Market in the United Kingdom

A CAGR of 11.4% has been projected for the UK chronic skin redness care market through 2035. Expansion is expected to be supported by strong pharmacist engagement, high dermatology access, and widening insurance coverage for specialist consultations. Premium dermocosmetics are anticipated to benefit from rigorous claim scrutiny, with dermatologist-tested propositions likely to command shelf leadership.

OMillioni-channel alignment-linking pharmacy credibility with digital advice journeys-is forecast to compress trial friction and raise regimen adherence. Ingredient transparency and low-irritancy profiles are expected to be emphasized as regulatory guidance tightens around sensitivity and fragrance disclosures.

  • Dermatologist-tested portfolios are projected to anchor trade-up in pharmacies.
  • Retail media within pharmacy groups is expected to raise conversion.
  • Claim substantiation requirements are anticipated to favor evidence-rich incumbents.
  • Sensitive-skin education campaigns are forecast to elevate regimen length and spend.

Growth and Expansion Outlook for Chronic Skin Redness Care Market in India

A CAGR of 20.4% has been forecast for India, indicating the fastest trajectory among key markets. Scale is expected to come from urban pharmacy expansion, rapid dermatologist density growth, and affordability-focused pack-price architectures. Digital dermatology and vernacular education are anticipated to widen access beyond metros, guiding consumers toward clinically validated, low-irritancy regimens.

Local manufacturing and agile formulation for humid climates are expected to accelerate adoption while preserving price competitiveness. Partnerships between pharma distributors and beauty retailers are projected to increase reach into Tier-2/3 cities.

  • Pharmacy-led trust is expected to remain the primary conversion lever.
  • Teledermatology is anticipated to reduce time-to-diagnosis and repeat visits.
  • Tiered pricing and localized production are projected to broaden penetration.
  • Fragrance-free and barrier-repair claims are expected to lead premiumization.

Sales Outlook for Chronic Skin Redness Care in China

A CAGR of 17.6% has been anticipated for China through 2035. Growth is expected to be propelled by dermocosmetics mainstreaming, KOL-driven clinical education, and advanced O2O models that fuse e-commerce with pharmacist consultation. Category development is projected to benefit from stricter platform policing of efficacy claims, pushing brands toward quantifiable redness-reduction outcomes.

Channel balance between pharmacies/drugstores and online marketplaces is expected to remain tight, with subscriptions and replenishment programs improving lifetime value. Cross-border compliance and local filing acceleration are anticipated to speed innovation cycles.
  • Evidence-backed claims are expected to dominate live-commerce narratives.
  • Replenishment subscriptions are projected to lift retention and ASPs.
  • Local clinical data generation is anticipated to ease regulatory approvals.
  • Co-created SKUs with pharmacies are expected to win trust-sensitive cohorts.

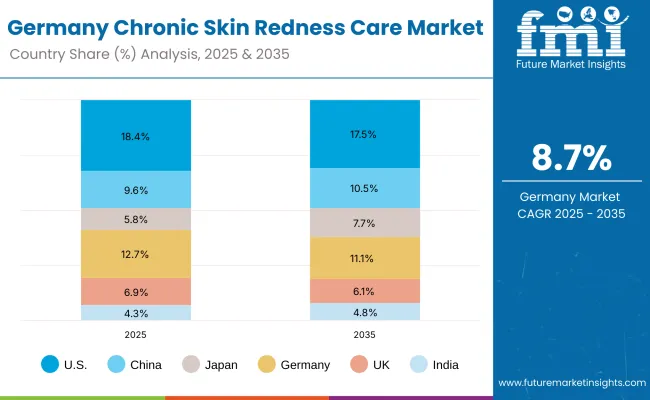
In-depth Analysis of Chronic Skin Redness Care in Germany

Germany Chronic Skin Redness Care Market

Country 2025
USA 18.4%
China 9.6%
Japan 5.8%
Germany 12.7%
UK 6.9%
India 4.3%
Country 2035
USA 17.5%
China 10.5%
Japan 7.7%
Germany 11.1%
UK 6.1%
India 4.8%

A CAGR of 8.7% has been projected for Germany, reflecting steady, compliance-led expansion. Pharmacy dominance is expected to persist as dermatologist referrals and pharmacist counseling guide product choices for sensitive-skin cohorts. Regulatory rigor around hypoallergenic and fragrance disclosures is anticipated to reinforce demand for dermatologist-tested, barrier-supportive formulations.

Incremental growth is expected from aging demographics and higher willingness to pay for clinically proven redness attenuation. Digitally enabled adherence programs and insurer partnerships are projected to support continuity of care.
  • Apotheke (pharmacy) ecosystems are expected to remain the growth spine.
  • Clinical documentation standards are anticipated to favor established dermocosmetics.
  • Aging populations are projected to sustain premium, low-irritancy regimens.
  • Digital refill and adherence tools are expected to raise repeat purchase rates.

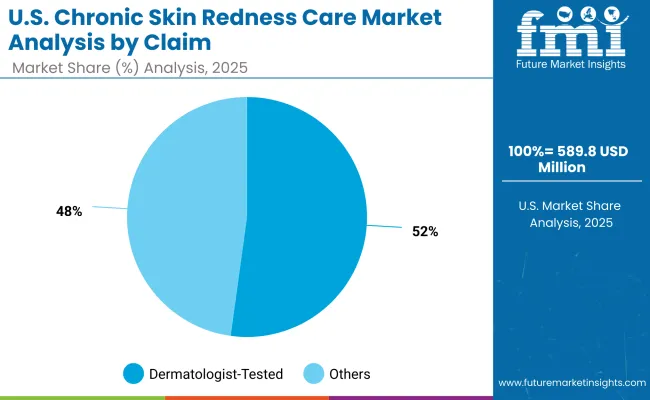
Growth Outlook for Chronic Skin Redness Care Market in USA

Usa Chronic Skin Redness Care Market By Claim

USA by Claim Market Value Share, 2025
Dermatologist-tested 52.2%
Others 47.8%

The chronic skin redness care market in the USA is projected at USD 589.85 million in 2025. Dermatologist-tested formulations contribute 52.2% of this value, equal to USD 308.0 million, while other claims account for 47.8%, or USD 281.82 million. This slight dominance of dermatologist-tested products underscores the importance of professional validation and clinical credibility in consumer purchase decisions. Growing reliance on dermatologist guidance, both through in-person consultations and teledermatology platforms, is expected to amplify the influence of evidence-backed claims.

Other claims, while slightly smaller, are anticipated to expand as innovation accelerates in fragrance-free, hypoallergenic, and barrier-repair categories. With consumer sensitivity concerns rising, brands leveraging transparent ingredient disclosure and proof of tolerability are expected to compete effectively.
  • USA chronic skin redness care market projected at USD 589.85 million in 2025
  • Dermatologist-tested claims lead at 52.2% versus 47.8% for others
  • Growth reinforced by teledermatology adoption and clinical substantiation trends
  • Rising demand for hypoallergenic and barrier-supportive claims to strengthen “other” segment

Opportunity Analysis of China Chronic Skin Redness Care Market

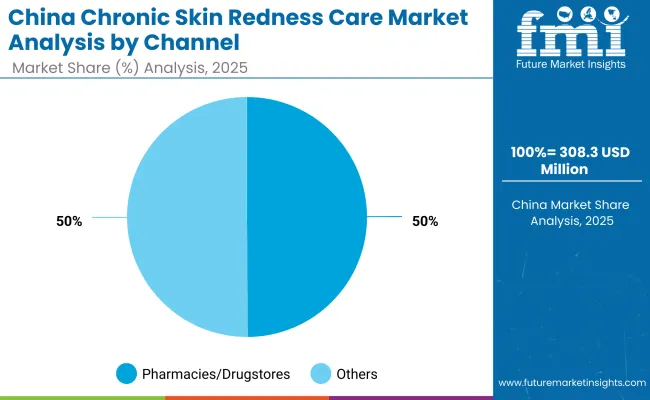
China Chronic Skin Redness Care Market By Channel

China by Channel Market Value Share, 2025
Pharmacies/drugstores 49.9%
Others 50.1%

The chronic skin redness care market in China is projected at USD 308.39 million in 2025. Pharmacies and drugstores contribute 49.9% of this value, equal to USD 153.8 million, while other channels, including e-commerce and specialty retail, hold a slightly higher share of 50.1%, equal to USD 154.57 million.

This near-equal distribution highlights China’s unique dual-channel strength, where offline credibility and online convenience operate in parallel. Pharmacies are expected to remain central in consumer trust-building through professional pharmacist counseling, particularly for first-time users of dermocosmetics.

At the same time, online platforms are anticipated to strengthen their lead through live-commerce, subscription models, and AI-driven skin diagnostics that increase consumer engagement. The close channel balance suggests future market competition will hinge on oMillioni-channel integration, where seamless movement between online discovery and offline validation will define leadership.
  • China’s chronic skin redness care market projected at USD 308.39 million in 2025
  • Pharmacies/drugstores contribute 49.9%, valued at USD 153.8 million
  • Other channels lead narrowly at 50.1%, equal to USD 154.57 million
  • Growth anchored in oMillioni-channel integration, with live-commerce and pharmacist trust shaping adoption

Competitive Landscape of Chronic Skin Redness Care Market

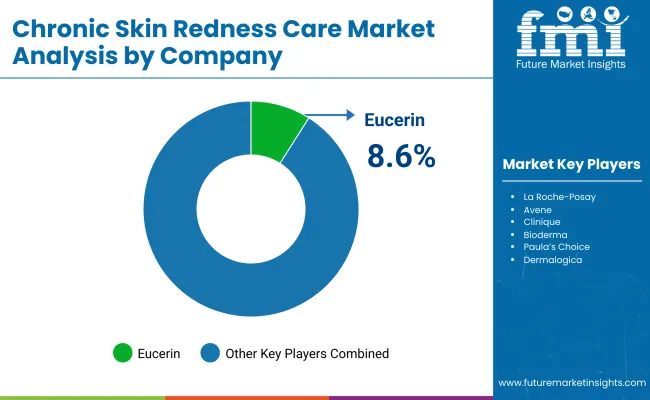
Chronic Skin Redness Care Market By Company

Company Global Value Share 2025
Eucerin 8.6%
Others 91.4%

The chronic skin redness care market is moderately fragmented, with multinational dermocosmetic leaders, established skincare specialists, and regionally focused brands competing for share. Eucerin has emerged as the leading player globally, holding 8.6% of value share in 2025, while the remainder of the market is distributed among multiple international and local brands, collectively representing 91.4%. Strategic differentiation has been increasingly anchored in dermatologist-tested claims, barrier-repair innovation, and transparent ingredient disclosure.

Eucerin’s leadership has been reinforced by its dermatologist-backed positioning and consistent clinical validation, which continue to appeal to redness-prone and sensitive-skin consumers worldwide. Other global brands such as La Roche-Posay, Avene, Clinique, and Bioderma have been advancing through pharmacy-driven trust and oMillioni-channel distribution strategies, while emerging players like Paula’s Choice and CeraVe are gaining relevance through digital-first campaigns and affordable dermatologist-tested offerings.

Competitive dynamics are expected to shift further as regulatory scrutiny intensifies, pushing brands to invest in clinical trials, measurable redness reduction outcomes, and digital dermatologist engagement. Long-term advantage will be defined less by broad product portfolios and more by evidence-backed differentiation, adherence to claim substantiation standards, and consumer-centric ecosystem strategies that blend offline credibility with online accessibility.

Key Developments in Chronic Skin Redness Care Market

  • On February 11, 2025, No7 (UK brand) launched Derm Solutions in the USA, introducing seven dermatologist-approved cleansers and moisturizers targeting signs including redness. Product formulations featuring ceramides, niacinamide, and adaptogens were emphasized for balancing, soothing, and supporting sensitive skin.
  • In April 2025, Codex Labs’ Bia Eczema Relief Lotion was awarded both MyMicrobiome Standard’s Microbiome-Friendly Certification and the National Eczema Association Seal of Acceptance, acknowledging its barrier-repair strength and low-irritancy profile, particularly in redness-prone users.

Scope of the Report

Item Value
Quantitative Units USD Million (nominal)
Market Value USD 3,205.20 Million (2025); USD 7,401.80 Million (2035)
Growth Rate 8.70% CAGR (2025 to 2035)
Time Horizon 2025 to 2035 (annual forecasts)
Component/Claims Dermatologist-tested, Others
Product Type Creams, Others (e.g., gels, serums, lotions)
Channel Pharmacies/drugstores, Others (e.g., e-commerce, specialty beauty, clinics)
Leading Segments (2025) Dermatologist-tested 51.50% (USD 1,648.50 Million ); Pharmacies/drugstores 48.50% (USD 1,551.50 Million ); Creams 47.50% (USD 1,519.20 Million )
Regions Covered North America, Europe, Asia-Pacific, Latin America, Middle East & Africa
Countries Covered (spotlight) United States, China, India, Japan, Germany, United Kingdom
Country Growth Indicators (CAGR 2025 to 2035) India 20.40%; China 17.60%; Japan 14.60%; UK 11.40%; Germany 8.70%; USA 7.90%
Key Companies Profiled Eucerin, La Roche-Posay, Avene, Clinique, Bioderma, Paula’s Choice, CeraVe, Vanicream, Dermalogica, Murad
Competitive Concentration Eucerin 8.60% global value share (2025); Others 91.40%
USA Snapshot (2025) USD 589.85 Million ; Claims split-Dermatologist-tested 52.20% (USD 308.00 Million ), Others 47.80% (USD 281.82 Million )
China Channel Snapshot (2025) Pharmacies/drugstores 49.90% (USD 153.80 Million ); Others 50.10% (USD 154.57 Million )
Additional Attributes Dollar sales by claim/channel/product type; regulatory tightening on claim substantiation; teledermatology-enabled guidance; barrier-repair and low-irritancy innovation; o Million i-channel integration (pharmacy + e-commerce); subscription/replenishment programs; pharmacist advocacy; ingredient transparency and microbiome-friendly positioning

Key Segments

By Concern:

  • Rosacea
  • Post-inflammatory redness
  • Sensitive skin redness
  • Environmental redness

By Active Ingredient:

  • Niacinamide
  • Centella asiatica
  • Green tea extract
  • Azelaic acid
  • Allantoin

By Product Type:

  • Creams
  • Serums
  • Gels
  • Lotions

By Channel:

  • Pharmacies/drugstores
  • E-commerce
  • Specialty beauty retail
  • Dermatology clinics

By Claim:

  • Fragrance-free
  • Dermatologist-tested
  • Hypoallergenic
  • Vegan

By End User:

  • Adults
  • Women
  • Men
  • Sensitive-skin prone

By Region:

  • North America
  • Latin America
  • Europe
  • East Asia
  • South Asia & Pacific
  • Middle East and Africa

Table of Content

  1. Executive Summary
    • Global Market Outlook
    • Demand-side Trends
    • Supply-side Trends
    • Technology Roadmap Analysis
    • Analysis and Recommendations
  2. Market Overview
    • Market Coverage / Taxonomy
    • Market Definition / Scope / Limitations
  3. Market Background
    • Market Dynamics
      • Drivers
      • Restraints
      • Opportunity
      • Trends
    • Scenario Forecast
      • Demand in Optimistic Scenario
      • Demand in Likely Scenario
      • Demand in Conservative Scenario
    • Opportunity Map Analysis
    • Product Life Cycle Analysis
    • Supply Chain Analysis
      • Supply Side Participants and their Roles
        • Producers
        • Mid-Level Participants (Traders/ Agents/ Brokers)
        • Wholesalers and Distributors
      • Value Added and Value Created at Node in the Supply Chain
      • List of Raw Material Suppliers
      • List of Existing and Potential Buyer’s
    • Investment Feasibility Matrix
    • Value Chain Analysis
      • Profit Margin Analysis
      • Wholesalers and Distributors
      • Retailers
    • PESTLE and Porter’s Analysis
    • Regulatory Landscape
      • By Key Regions
      • By Key Countries
    • Regional Parent Market Outlook
    • Production and Consumption Statistics
    • Import and Export Statistics
  4. Global Market Analysis 2020 to 2024 and Forecast, 2025 to 2035
    • Historical Market Size Value (USD Million) & Volume (Units) Analysis, 2020 to 2024
    • Current and Future Market Size Value (USD Million) & Volume (Units) Projections, 2025 to 2035
      • Y-o-Y Growth Trend Analysis
      • Absolute $ Opportunity Analysis
  5. Global Market Analysis 2020 to 2024 and Forecast 2025 to 2035, By Concern
    • Introduction / Key Findings
    • Historical Market Size Value (USD Million) & Volume (Units) Analysis By Concern, 2020 to 2024
    • Current and Future Market Size Value (USD Million) & Volume (Units) Analysis and Forecast By Concern, 2025 to 2035
      • Rosacea
      • Post-inflammatory redness
      • Sensitive skin redness
      • Environmental redness
    • Y-o-Y Growth Trend Analysis By Concern, 2020 to 2024
    • Absolute $ Opportunity Analysis By Concern, 2025 to 2035
  6. Global Market Analysis 2020 to 2024 and Forecast 2025 to 2035, By Active Ingredient
    • Introduction / Key Findings
    • Historical Market Size Value (USD Million) & Volume (Units) Analysis By Active Ingredient, 2020 to 2024
    • Current and Future Market Size Value (USD Million) & Volume (Units) Analysis and Forecast By Active Ingredient, 2025 to 2035
      • Niacinamide
      • Centella asiatica
      • Green tea extract
      • Azelaic acid
      • Allantoin
    • Y-o-Y Growth Trend Analysis By Active Ingredient, 2020 to 2024
    • Absolute $ Opportunity Analysis By Active Ingredient, 2025 to 2035
  7. Global Market Analysis 2020 to 2024 and Forecast 2025 to 2035, By Product Type
    • Introduction / Key Findings
    • Historical Market Size Value (USD Million) & Volume (Units) Analysis By Product Type, 2020 to 2024
    • Current and Future Market Size Value (USD Million) & Volume (Units) Analysis and Forecast By Product Type, 2025 to 2035
      • Creams
      • Serums
      • Gels
      • Lotions
    • Y-o-Y Growth Trend Analysis By Product Type, 2020 to 2024
    • Absolute $ Opportunity Analysis By Product Type, 2025 to 2035
  8. Global Market Analysis 2020 to 2024 and Forecast 2025 to 2035, By Channel
    • Introduction / Key Findings
    • Historical Market Size Value (USD Million) & Volume (Units) Analysis By Channel, 2020 to 2024
    • Current and Future Market Size Value (USD Million) & Volume (Units) Analysis and Forecast By Channel, 2025 to 2035
      • Pharmacies/drugstores
      • E-commerce
      • Specialty beauty retail
      • Dermatology clinics
    • Y-o-Y Growth Trend Analysis By Channel, 2020 to 2024
    • Absolute $ Opportunity Analysis By Channel, 2025 to 2035
  9. Global Market Analysis 2020 to 2024 and Forecast 2025 to 2035, By Claim
    • Introduction / Key Findings
    • Historical Market Size Value (USD Million) & Volume (Units) Analysis By Claim, 2020 to 2024
    • Current and Future Market Size Value (USD Million) & Volume (Units) Analysis and Forecast By Claim, 2025 to 2035
      • Fragrance-free
      • Dermatologist-tested
      • Hypoallergenic
      • Vegan
    • Y-o-Y Growth Trend Analysis By Claim, 2020 to 2024
    • Absolute $ Opportunity Analysis By Claim, 2025 to 2035
  10. Global Market Analysis 2020 to 2024 and Forecast 2025 to 2035, By End User
    • Introduction / Key Findings
    • Historical Market Size Value (USD Million) & Volume (Units) Analysis By End User, 2020 to 2024
    • Current and Future Market Size Value (USD Million) & Volume (Units) Analysis and Forecast By End User, 2025 to 2035
      • Adults
      • Women
      • Men
      • Sensitive-skin prone
    • Y-o-Y Growth Trend Analysis By End User, 2020 to 2024
    • Absolute $ Opportunity Analysis By End User, 2025 to 2035
  11. Global Market Analysis 2020 to 2024 and Forecast 2025 to 2035, By Region
    • Introduction
    • Historical Market Size Value (USD Million) & Volume (Units) Analysis By Region, 2020 to 2024
    • Current Market Size Value (USD Million) & Volume (Units) Analysis and Forecast By Region, 2025 to 2035
      • North America
      • Latin America
      • Europe
      • East Asia
      • South Asia & Pacific
      • Middle East and Africa
    • Market Attractiveness Analysis By Region
  12. North America Market Analysis 2020 to 2024 and Forecast 2025 to 2035, By Country
    • Historical Market Size Value (USD Million) & Volume (Units) Trend Analysis By Market Taxonomy, 2020 to 2024
    • Market Size Value (USD Million) & Volume (Units) Forecast By Market Taxonomy, 2025 to 2035
      • By Country
        • USA
        • Canada
      • By Concern
      • By Active Ingredient
      • By Product Type
      • By Channel
      • By Claim
      • By End User
    • Market Attractiveness Analysis
      • By Country
      • By Concern
      • By Active Ingredient
      • By Product Type
      • By Channel
      • By Claim
      • By End User
    • Key Takeaways
  13. Latin America Market Analysis 2020 to 2024 and Forecast 2025 to 2035, By Country
    • Historical Market Size Value (USD Million) & Volume (Units) Trend Analysis By Market Taxonomy, 2020 to 2024
    • Market Size Value (USD Million) & Volume (Units) Forecast By Market Taxonomy, 2025 to 2035
      • By Country
        • Brazil
        • Mexico
        • Colombia
        • Rest of Latin America
      • By Concern
      • By Active Ingredient
      • By Product Type
      • By Channel
      • By Claim
      • By End User
    • Market Attractiveness Analysis
      • By Country
      • By Concern
      • By Active Ingredient
      • By Product Type
      • By Channel
      • By Claim
      • By End User
    • Key Takeaways
  14. Europe Market Analysis 2020 to 2024 and Forecast 2025 to 2035, By Country
    • Historical Market Size Value (USD Million) & Volume (Units) Trend Analysis By Market Taxonomy, 2020 to 2024
    • Market Size Value (USD Million) & Volume (Units) Forecast By Market Taxonomy, 2025 to 2035
      • By Country
        • Germany
        • UK
        • France
        • Italy
        • Spain
        • Belgium
        • Netherlands
        • Nordic
        • Switzerland
        • Russia
        • Poland
        • Rest of Europe
      • By Concern
      • By Active Ingredient
      • By Product Type
      • By Channel
      • By Claim
      • By End User
    • Market Attractiveness Analysis
      • By Country
      • By Concern
      • By Active Ingredient
      • By Product Type
      • By Channel
      • By Claim
      • By End User
    • Key Takeaways
  15. East Asia Market Analysis 2020 to 2024 and Forecast 2025 to 2035, By Country
    • Historical Market Size Value (USD Million) & Volume (Units) Trend Analysis By Market Taxonomy, 2020 to 2024
    • Market Size Value (USD Million) & Volume (Units) Forecast By Market Taxonomy, 2025 to 2035
      • By Country
        • China
        • Japan
        • South Korea
      • By Concern
      • By Active Ingredient
      • By Product Type
      • By Channel
      • By Claim
      • By End User
    • Market Attractiveness Analysis
      • By Country
      • By Concern
      • By Active Ingredient
      • By Product Type
      • By Channel
      • By Claim
      • By End User
    • Key Takeaways
  16. South Asia & Pacific Market Analysis 2020 to 2024 and Forecast 2025 to 2035, By Country
    • Historical Market Size Value (USD Million) & Volume (Units) Trend Analysis By Market Taxonomy, 2020 to 2024
    • Market Size Value (USD Million) & Volume (Units) Forecast By Market Taxonomy, 2025 to 2035
      • By Country
        • India
        • Thailand
        • Malaysia
        • Indonesia
        • Singapore
        • Vietnam
        • Australia
        • New Zealand
        • Rest of South Asia
      • By Concern
      • By Active Ingredient
      • By Product Type
      • By Channel
      • By Claim
      • By End User
    • Market Attractiveness Analysis
      • By Country
      • By Concern
      • By Active Ingredient
      • By Product Type
      • By Channel
      • By Claim
      • By End User
    • Key Takeaways
  17. Middle East and Africa Market Analysis 2020 to 2024 and Forecast 2025 to 2035, By Country
    • Historical Market Size Value (USD Million) & Volume (Units) Trend Analysis By Market Taxonomy, 2020 to 2024
    • Market Size Value (USD Million) & Volume (Units) Forecast By Market Taxonomy, 2025 to 2035
      • By Country
        • Turkey
        • UAE
        • Saudi Arabia
        • Israel
        • Other GCC Countries
        • North Africa
        • South Africa
      • By Concern
      • By Active Ingredient
      • By Product Type
      • By Channel
      • By Claim
      • By End User
    • Market Attractiveness Analysis
      • By Country
      • By Concern
      • By Active Ingredient
      • By Product Type
      • By Channel
      • By Claim
      • By End User
    • Key Takeaways
  18. Key Countries Market Analysis
    • USA
      • Pricing Analysis
      • Market Share Analysis, 2024
        • By Concern
        • By Active Ingredient
        • By Product Type
        • By Channel
        • By Claim
        • By End User
    • Canada
      • Pricing Analysis
      • Market Share Analysis, 2024
        • By Concern
        • By Active Ingredient
        • By Product Type
        • By Channel
        • By Claim
        • By End User
    • Brazil
      • Pricing Analysis
      • Market Share Analysis, 2024
        • By Concern
        • By Active Ingredient
        • By Product Type
        • By Channel
        • By Claim
        • By End User
    • Mexico
      • Pricing Analysis
      • Market Share Analysis, 2024
        • By Concern
        • By Active Ingredient
        • By Product Type
        • By Channel
        • By Claim
        • By End User
    • Colombia
      • Pricing Analysis
      • Market Share Analysis, 2024
        • By Concern
        • By Active Ingredient
        • By Product Type
        • By Channel
        • By Claim
        • By End User
    • Germany
      • Pricing Analysis
      • Market Share Analysis, 2024
        • By Concern
        • By Active Ingredient
        • By Product Type
        • By Channel
        • By Claim
        • By End User
    • UK
      • Pricing Analysis
      • Market Share Analysis, 2024
        • By Concern
        • By Active Ingredient
        • By Product Type
        • By Channel
        • By Claim
        • By End User
    • France
      • Pricing Analysis
      • Market Share Analysis, 2024
        • By Concern
        • By Active Ingredient
        • By Product Type
        • By Channel
        • By Claim
        • By End User
    • Italy
      • Pricing Analysis
      • Market Share Analysis, 2024
        • By Concern
        • By Active Ingredient
        • By Product Type
        • By Channel
        • By Claim
        • By End User
    • Spain
      • Pricing Analysis
      • Market Share Analysis, 2024
        • By Concern
        • By Active Ingredient
        • By Product Type
        • By Channel
        • By Claim
        • By End User
    • Belgium
      • Pricing Analysis
      • Market Share Analysis, 2024
        • By Concern
        • By Active Ingredient
        • By Product Type
        • By Channel
        • By Claim
        • By End User
    • Netherlands
      • Pricing Analysis
      • Market Share Analysis, 2024
        • By Concern
        • By Active Ingredient
        • By Product Type
        • By Channel
        • By Claim
        • By End User
    • Nordic
      • Pricing Analysis
      • Market Share Analysis, 2024
        • By Concern
        • By Active Ingredient
        • By Product Type
        • By Channel
        • By Claim
        • By End User
    • Switzerland
      • Pricing Analysis
      • Market Share Analysis, 2024
        • By Concern
        • By Active Ingredient
        • By Product Type
        • By Channel
        • By Claim
        • By End User
    • Russia
      • Pricing Analysis
      • Market Share Analysis, 2024
        • By Concern
        • By Active Ingredient
        • By Product Type
        • By Channel
        • By Claim
        • By End User
    • Poland
      • Pricing Analysis
      • Market Share Analysis, 2024
        • By Concern
        • By Active Ingredient
        • By Product Type
        • By Channel
        • By Claim
        • By End User
    • China
      • Pricing Analysis
      • Market Share Analysis, 2024
        • By Concern
        • By Active Ingredient
        • By Product Type
        • By Channel
        • By Claim
        • By End User
    • Japan
      • Pricing Analysis
      • Market Share Analysis, 2024
        • By Concern
        • By Active Ingredient
        • By Product Type
        • By Channel
        • By Claim
        • By End User
    • South Korea
      • Pricing Analysis
      • Market Share Analysis, 2024
        • By Concern
        • By Active Ingredient
        • By Product Type
        • By Channel
        • By Claim
        • By End User
    • India
      • Pricing Analysis
      • Market Share Analysis, 2024
        • By Concern
        • By Active Ingredient
        • By Product Type
        • By Channel
        • By Claim
        • By End User
    • Thailand
      • Pricing Analysis
      • Market Share Analysis, 2024
        • By Concern
        • By Active Ingredient
        • By Product Type
        • By Channel
        • By Claim
        • By End User
    • Indonesia
      • Pricing Analysis
      • Market Share Analysis, 2024
        • By Concern
        • By Active Ingredient
        • By Product Type
        • By Channel
        • By Claim
        • By End User
    • Australia
      • Pricing Analysis
      • Market Share Analysis, 2024
        • By Concern
        • By Active Ingredient
        • By Product Type
        • By Channel
        • By Claim
        • By End User
    • New Zealand
      • Pricing Analysis
      • Market Share Analysis, 2024
        • By Concern
        • By Active Ingredient
        • By Product Type
        • By Channel
        • By Claim
        • By End User
    • Turkey
      • Pricing Analysis
      • Market Share Analysis, 2024
        • By Concern
        • By Active Ingredient
        • By Product Type
        • By Channel
        • By Claim
        • By End User
    • UAE
      • Pricing Analysis
      • Market Share Analysis, 2024
        • By Concern
        • By Active Ingredient
        • By Product Type
        • By Channel
        • By Claim
        • By End User
    • Saudi Arabia
      • Pricing Analysis
      • Market Share Analysis, 2024
        • By Concern
        • By Active Ingredient
        • By Product Type
        • By Channel
        • By Claim
        • By End User
    • Israel
      • Pricing Analysis
      • Market Share Analysis, 2024
        • By Concern
        • By Active Ingredient
        • By Product Type
        • By Channel
        • By Claim
        • By End User
    • North Africa
      • Pricing Analysis
      • Market Share Analysis, 2024
        • By Concern
        • By Active Ingredient
        • By Product Type
        • By Channel
        • By Claim
        • By End User
    • South Africa
      • Pricing Analysis
      • Market Share Analysis, 2024
        • By Concern
        • By Active Ingredient
        • By Product Type
        • By Channel
        • By Claim
        • By End User
  19. Market Structure Analysis
    • Competition Dashboard
    • Competition Benchmarking
    • Market Share Analysis of Top Players
      • By Regional
      • By Concern
      • By Active Ingredient
      • By Product Type
      • By Channel
      • By Claim
      • By End User
  20. Competition Analysis
    • Competition Deep Dive
      • Eucerin
        • Overview
        • Product Portfolio
        • Profitability by Market Segments (Product/Age /Sales Channel/Region)
        • Sales Footprint
        • Strategy Overview
          • Marketing Strategy
          • Product Strategy
          • Channel Strategy
      • La Roche-Posay
        • Overview
        • Product Portfolio
        • Profitability by Market Segments (Product/Age /Sales Channel/Region)
        • Sales Footprint
        • Strategy Overview
          • Marketing Strategy
          • Product Strategy
          • Channel Strategy
      • Avene
        • Overview
        • Product Portfolio
        • Profitability by Market Segments (Product/Age /Sales Channel/Region)
        • Sales Footprint
        • Strategy Overview
          • Marketing Strategy
          • Product Strategy
          • Channel Strategy
      • Clinique
        • Overview
        • Product Portfolio
        • Profitability by Market Segments (Product/Age /Sales Channel/Region)
        • Sales Footprint
        • Strategy Overview
          • Marketing Strategy
          • Product Strategy
          • Channel Strategy
      • Bioderma
        • Overview
        • Product Portfolio
        • Profitability by Market Segments (Product/Age /Sales Channel/Region)
        • Sales Footprint
        • Strategy Overview
          • Marketing Strategy
          • Product Strategy
          • Channel Strategy
      • Paula’s Choice
        • Overview
        • Product Portfolio
        • Profitability by Market Segments (Product/Age /Sales Channel/Region)
        • Sales Footprint
        • Strategy Overview
          • Marketing Strategy
          • Product Strategy
          • Channel Strategy
      • CeraVe
        • Overview
        • Product Portfolio
        • Profitability by Market Segments (Product/Age /Sales Channel/Region)
        • Sales Footprint
        • Strategy Overview
          • Marketing Strategy
          • Product Strategy
          • Channel Strategy
      • Vanicream
        • Overview
        • Product Portfolio
        • Profitability by Market Segments (Product/Age /Sales Channel/Region)
        • Sales Footprint
        • Strategy Overview
          • Marketing Strategy
          • Product Strategy
          • Channel Strategy
      • Dermalogica
        • Overview
        • Product Portfolio
        • Profitability by Market Segments (Product/Age /Sales Channel/Region)
        • Sales Footprint
        • Strategy Overview
          • Marketing Strategy
          • Product Strategy
          • Channel Strategy
      • Murad
        • Overview
        • Product Portfolio
        • Profitability by Market Segments (Product/Age /Sales Channel/Region)
        • Sales Footprint
        • Strategy Overview
          • Marketing Strategy
          • Product Strategy
          • Channel Strategy
      • Others
        • Overview
        • Product Portfolio
        • Profitability by Market Segments (Product/Age /Sales Channel/Region)
        • Sales Footprint
        • Strategy Overview
          • Marketing Strategy
          • Product Strategy
          • Channel Strategy
  21. Assumptions & Acronyms Used
  22. Research Methodology

List of Tables

  • Table 1: Global Market Value (USD Million) Forecast by Region, 2020-2035
  • Table 2: Global Market Volume (Units) Forecast by Region, 2020-2035
  • Table 3: Global Market Value (USD Million) Forecast by Concern, 2020-2035
  • Table 4: Global Market Volume (Units) Forecast by Concern, 2020-2035
  • Table 5: Global Market Value (USD Million) Forecast by Active Ingredient, 2020-2035
  • Table 6: Global Market Volume (Units) Forecast by Active Ingredient, 2020-2035
  • Table 7: Global Market Value (USD Million) Forecast by Product Type, 2020-2035
  • Table 8: Global Market Volume (Units) Forecast by Product Type, 2020-2035
  • Table 9: Global Market Value (USD Million) Forecast by Channel, 2020-2035
  • Table 10: Global Market Volume (Units) Forecast by Channel, 2020-2035
  • Table 11: Global Market Value (USD Million) Forecast by Claim, 2020-2035
  • Table 12: Global Market Volume (Units) Forecast by Claim, 2020-2035
  • Table 13: Global Market Value (USD Million) Forecast by End User, 2020-2035
  • Table 14: Global Market Volume (Units) Forecast by End User, 2020-2035
  • Table 15: North America Market Value (USD Million) Forecast by Country, 2020-2035
  • Table 16: North America Market Volume (Units) Forecast by Country, 2020-2035
  • Table 17: North America Market Value (USD Million) Forecast by Concern, 2020-2035
  • Table 18: North America Market Volume (Units) Forecast by Concern, 2020-2035
  • Table 19: North America Market Value (USD Million) Forecast by Active Ingredient, 2020-2035
  • Table 20: North America Market Volume (Units) Forecast by Active Ingredient, 2020-2035
  • Table 21: North America Market Value (USD Million) Forecast by Product Type, 2020-2035
  • Table 22: North America Market Volume (Units) Forecast by Product Type, 2020-2035
  • Table 23: North America Market Value (USD Million) Forecast by Channel, 2020-2035
  • Table 24: North America Market Volume (Units) Forecast by Channel, 2020-2035
  • Table 25: North America Market Value (USD Million) Forecast by Claim, 2020-2035
  • Table 26: North America Market Volume (Units) Forecast by Claim, 2020-2035
  • Table 27: North America Market Value (USD Million) Forecast by End User, 2020-2035
  • Table 28: North America Market Volume (Units) Forecast by End User, 2020-2035
  • Table 29: Latin America Market Value (USD Million) Forecast by Country, 2020-2035
  • Table 30: Latin America Market Volume (Units) Forecast by Country, 2020-2035
  • Table 31: Latin America Market Value (USD Million) Forecast by Concern, 2020-2035
  • Table 32: Latin America Market Volume (Units) Forecast by Concern, 2020-2035
  • Table 33: Latin America Market Value (USD Million) Forecast by Active Ingredient, 2020-2035
  • Table 34: Latin America Market Volume (Units) Forecast by Active Ingredient, 2020-2035
  • Table 35: Latin America Market Value (USD Million) Forecast by Product Type, 2020-2035
  • Table 36: Latin America Market Volume (Units) Forecast by Product Type, 2020-2035
  • Table 37: Latin America Market Value (USD Million) Forecast by Channel, 2020-2035
  • Table 38: Latin America Market Volume (Units) Forecast by Channel, 2020-2035
  • Table 39: Latin America Market Value (USD Million) Forecast by Claim, 2020-2035
  • Table 40: Latin America Market Volume (Units) Forecast by Claim, 2020-2035
  • Table 41: Latin America Market Value (USD Million) Forecast by End User, 2020-2035
  • Table 42: Latin America Market Volume (Units) Forecast by End User, 2020-2035
  • Table 43: Europe Market Value (USD Million) Forecast by Country, 2020-2035
  • Table 44: Europe Market Volume (Units) Forecast by Country, 2020-2035
  • Table 45: Europe Market Value (USD Million) Forecast by Concern, 2020-2035
  • Table 46: Europe Market Volume (Units) Forecast by Concern, 2020-2035
  • Table 47: Europe Market Value (USD Million) Forecast by Active Ingredient, 2020-2035
  • Table 48: Europe Market Volume (Units) Forecast by Active Ingredient, 2020-2035
  • Table 49: Europe Market Value (USD Million) Forecast by Product Type, 2020-2035
  • Table 50: Europe Market Volume (Units) Forecast by Product Type, 2020-2035
  • Table 51: Europe Market Value (USD Million) Forecast by Channel, 2020-2035
  • Table 52: Europe Market Volume (Units) Forecast by Channel, 2020-2035
  • Table 53: Europe Market Value (USD Million) Forecast by Claim, 2020-2035
  • Table 54: Europe Market Volume (Units) Forecast by Claim, 2020-2035
  • Table 55: Europe Market Value (USD Million) Forecast by End User, 2020-2035
  • Table 56: Europe Market Volume (Units) Forecast by End User, 2020-2035
  • Table 57: East Asia Market Value (USD Million) Forecast by Country, 2020-2035
  • Table 58: East Asia Market Volume (Units) Forecast by Country, 2020-2035
  • Table 59: East Asia Market Value (USD Million) Forecast by Concern, 2020-2035
  • Table 60: East Asia Market Volume (Units) Forecast by Concern, 2020-2035
  • Table 61: East Asia Market Value (USD Million) Forecast by Active Ingredient, 2020-2035
  • Table 62: East Asia Market Volume (Units) Forecast by Active Ingredient, 2020-2035
  • Table 63: East Asia Market Value (USD Million) Forecast by Product Type, 2020-2035
  • Table 64: East Asia Market Volume (Units) Forecast by Product Type, 2020-2035
  • Table 65: East Asia Market Value (USD Million) Forecast by Channel, 2020-2035
  • Table 66: East Asia Market Volume (Units) Forecast by Channel, 2020-2035
  • Table 67: East Asia Market Value (USD Million) Forecast by Claim, 2020-2035
  • Table 68: East Asia Market Volume (Units) Forecast by Claim, 2020-2035
  • Table 69: East Asia Market Value (USD Million) Forecast by End User, 2020-2035
  • Table 70: East Asia Market Volume (Units) Forecast by End User, 2020-2035
  • Table 71: South Asia & Pacific Market Value (USD Million) Forecast by Country, 2020-2035
  • Table 72: South Asia & Pacific Market Volume (Units) Forecast by Country, 2020-2035
  • Table 73: South Asia & Pacific Market Value (USD Million) Forecast by Concern, 2020-2035
  • Table 74: South Asia & Pacific Market Volume (Units) Forecast by Concern, 2020-2035
  • Table 75: South Asia & Pacific Market Value (USD Million) Forecast by Active Ingredient, 2020-2035
  • Table 76: South Asia & Pacific Market Volume (Units) Forecast by Active Ingredient, 2020-2035
  • Table 77: South Asia & Pacific Market Value (USD Million) Forecast by Product Type, 2020-2035
  • Table 78: South Asia & Pacific Market Volume (Units) Forecast by Product Type, 2020-2035
  • Table 79: South Asia & Pacific Market Value (USD Million) Forecast by Channel, 2020-2035
  • Table 80: South Asia & Pacific Market Volume (Units) Forecast by Channel, 2020-2035
  • Table 81: South Asia & Pacific Market Value (USD Million) Forecast by Claim, 2020-2035
  • Table 82: South Asia & Pacific Market Volume (Units) Forecast by Claim, 2020-2035
  • Table 83: South Asia & Pacific Market Value (USD Million) Forecast by End User, 2020-2035
  • Table 84: South Asia & Pacific Market Volume (Units) Forecast by End User, 2020-2035
  • Table 85: Middle East and Africa Market Value (USD Million) Forecast by Country, 2020-2035
  • Table 86: Middle East and Africa Market Volume (Units) Forecast by Country, 2020-2035
  • Table 87: Middle East and Africa Market Value (USD Million) Forecast by Concern, 2020-2035
  • Table 88: Middle East and Africa Market Volume (Units) Forecast by Concern, 2020-2035
  • Table 89: Middle East and Africa Market Value (USD Million) Forecast by Active Ingredient, 2020-2035
  • Table 90: Middle East and Africa Market Volume (Units) Forecast by Active Ingredient, 2020-2035
  • Table 91: Middle East and Africa Market Value (USD Million) Forecast by Product Type, 2020-2035
  • Table 92: Middle East and Africa Market Volume (Units) Forecast by Product Type, 2020-2035
  • Table 93: Middle East and Africa Market Value (USD Million) Forecast by Channel, 2020-2035
  • Table 94: Middle East and Africa Market Volume (Units) Forecast by Channel, 2020-2035
  • Table 95: Middle East and Africa Market Value (USD Million) Forecast by Claim, 2020-2035
  • Table 96: Middle East and Africa Market Volume (Units) Forecast by Claim, 2020-2035
  • Table 97: Middle East and Africa Market Value (USD Million) Forecast by End User, 2020-2035
  • Table 98: Middle East and Africa Market Volume (Units) Forecast by End User, 2020-2035

List of Figures

  • Figure 1: Global Market Value (USD Million) by Concern, 2025-2035
  • Figure 2: Global Market Value (USD Million) by Active Ingredient, 2025-2035
  • Figure 3: Global Market Value (USD Million) by Product Type, 2025-2035
  • Figure 4: Global Market Value (USD Million) by Channel, 2025-2035
  • Figure 5: Global Market Value (USD Million) by Claim, 2025-2035
  • Figure 6: Global Market Value (USD Million) by End User, 2025-2035
  • Figure 7: Global Market Value (USD Million) by Region, 2025-2035
  • Figure 8: Global Market Value (USD Million) Analysis by Region, 2020-2035
  • Figure 9: Global Market Volume (Units) Analysis by Region, 2020-2035
  • Figure 10: Global Market Value Share (%) and BPS Analysis by Region, 2025-2035
  • Figure 11: Global Market Y-o-Y Growth (%) Projections by Region, 2025-2035
  • Figure 12: Global Market Value (USD Million) Analysis by Concern, 2020-2035
  • Figure 13: Global Market Volume (Units) Analysis by Concern, 2020-2035
  • Figure 14: Global Market Value Share (%) and BPS Analysis by Concern, 2025-2035
  • Figure 15: Global Market Y-o-Y Growth (%) Projections by Concern, 2025-2035
  • Figure 16: Global Market Value (USD Million) Analysis by Active Ingredient, 2020-2035
  • Figure 17: Global Market Volume (Units) Analysis by Active Ingredient, 2020-2035
  • Figure 18: Global Market Value Share (%) and BPS Analysis by Active Ingredient, 2025-2035
  • Figure 19: Global Market Y-o-Y Growth (%) Projections by Active Ingredient, 2025-2035
  • Figure 20: Global Market Value (USD Million) Analysis by Product Type, 2020-2035
  • Figure 21: Global Market Volume (Units) Analysis by Product Type, 2020-2035
  • Figure 22: Global Market Value Share (%) and BPS Analysis by Product Type, 2025-2035
  • Figure 23: Global Market Y-o-Y Growth (%) Projections by Product Type, 2025-2035
  • Figure 24: Global Market Value (USD Million) Analysis by Channel, 2020-2035
  • Figure 25: Global Market Volume (Units) Analysis by Channel, 2020-2035
  • Figure 26: Global Market Value Share (%) and BPS Analysis by Channel, 2025-2035
  • Figure 27: Global Market Y-o-Y Growth (%) Projections by Channel, 2025-2035
  • Figure 28: Global Market Value (USD Million) Analysis by Claim, 2020-2035
  • Figure 29: Global Market Volume (Units) Analysis by Claim, 2020-2035
  • Figure 30: Global Market Value Share (%) and BPS Analysis by Claim, 2025-2035
  • Figure 31: Global Market Y-o-Y Growth (%) Projections by Claim, 2025-2035
  • Figure 32: Global Market Value (USD Million) Analysis by End User, 2020-2035
  • Figure 33: Global Market Volume (Units) Analysis by End User, 2020-2035
  • Figure 34: Global Market Value Share (%) and BPS Analysis by End User, 2025-2035
  • Figure 35: Global Market Y-o-Y Growth (%) Projections by End User, 2025-2035
  • Figure 36: Global Market Attractiveness by Concern, 2025-2035
  • Figure 37: Global Market Attractiveness by Active Ingredient, 2025-2035
  • Figure 38: Global Market Attractiveness by Product Type, 2025-2035
  • Figure 39: Global Market Attractiveness by Channel, 2025-2035
  • Figure 40: Global Market Attractiveness by Claim, 2025-2035
  • Figure 41: Global Market Attractiveness by End User, 2025-2035
  • Figure 42: Global Market Attractiveness by Region, 2025-2035
  • Figure 43: North America Market Value (USD Million) by Concern, 2025-2035
  • Figure 44: North America Market Value (USD Million) by Active Ingredient, 2025-2035
  • Figure 45: North America Market Value (USD Million) by Product Type, 2025-2035
  • Figure 46: North America Market Value (USD Million) by Channel, 2025-2035
  • Figure 47: North America Market Value (USD Million) by Claim, 2025-2035
  • Figure 48: North America Market Value (USD Million) by End User, 2025-2035
  • Figure 49: North America Market Value (USD Million) by Country, 2025-2035
  • Figure 50: North America Market Value (USD Million) Analysis by Country, 2020-2035
  • Figure 51: North America Market Volume (Units) Analysis by Country, 2020-2035
  • Figure 52: North America Market Value Share (%) and BPS Analysis by Country, 2025-2035
  • Figure 53: North America Market Y-o-Y Growth (%) Projections by Country, 2025-2035
  • Figure 54: North America Market Value (USD Million) Analysis by Concern, 2020-2035
  • Figure 55: North America Market Volume (Units) Analysis by Concern, 2020-2035
  • Figure 56: North America Market Value Share (%) and BPS Analysis by Concern, 2025-2035
  • Figure 57: North America Market Y-o-Y Growth (%) Projections by Concern, 2025-2035
  • Figure 58: North America Market Value (USD Million) Analysis by Active Ingredient, 2020-2035
  • Figure 59: North America Market Volume (Units) Analysis by Active Ingredient, 2020-2035
  • Figure 60: North America Market Value Share (%) and BPS Analysis by Active Ingredient, 2025-2035
  • Figure 61: North America Market Y-o-Y Growth (%) Projections by Active Ingredient, 2025-2035
  • Figure 62: North America Market Value (USD Million) Analysis by Product Type, 2020-2035
  • Figure 63: North America Market Volume (Units) Analysis by Product Type, 2020-2035
  • Figure 64: North America Market Value Share (%) and BPS Analysis by Product Type, 2025-2035
  • Figure 65: North America Market Y-o-Y Growth (%) Projections by Product Type, 2025-2035
  • Figure 66: North America Market Value (USD Million) Analysis by Channel, 2020-2035
  • Figure 67: North America Market Volume (Units) Analysis by Channel, 2020-2035
  • Figure 68: North America Market Value Share (%) and BPS Analysis by Channel, 2025-2035
  • Figure 69: North America Market Y-o-Y Growth (%) Projections by Channel, 2025-2035
  • Figure 70: North America Market Value (USD Million) Analysis by Claim, 2020-2035
  • Figure 71: North America Market Volume (Units) Analysis by Claim, 2020-2035
  • Figure 72: North America Market Value Share (%) and BPS Analysis by Claim, 2025-2035
  • Figure 73: North America Market Y-o-Y Growth (%) Projections by Claim, 2025-2035
  • Figure 74: North America Market Value (USD Million) Analysis by End User, 2020-2035
  • Figure 75: North America Market Volume (Units) Analysis by End User, 2020-2035
  • Figure 76: North America Market Value Share (%) and BPS Analysis by End User, 2025-2035
  • Figure 77: North America Market Y-o-Y Growth (%) Projections by End User, 2025-2035
  • Figure 78: North America Market Attractiveness by Concern, 2025-2035
  • Figure 79: North America Market Attractiveness by Active Ingredient, 2025-2035
  • Figure 80: North America Market Attractiveness by Product Type, 2025-2035
  • Figure 81: North America Market Attractiveness by Channel, 2025-2035
  • Figure 82: North America Market Attractiveness by Claim, 2025-2035
  • Figure 83: North America Market Attractiveness by End User, 2025-2035
  • Figure 84: North America Market Attractiveness by Country, 2025-2035
  • Figure 85: Latin America Market Value (USD Million) by Concern, 2025-2035
  • Figure 86: Latin America Market Value (USD Million) by Active Ingredient, 2025-2035
  • Figure 87: Latin America Market Value (USD Million) by Product Type, 2025-2035
  • Figure 88: Latin America Market Value (USD Million) by Channel, 2025-2035
  • Figure 89: Latin America Market Value (USD Million) by Claim, 2025-2035
  • Figure 90: Latin America Market Value (USD Million) by End User, 2025-2035
  • Figure 91: Latin America Market Value (USD Million) by Country, 2025-2035
  • Figure 92: Latin America Market Value (USD Million) Analysis by Country, 2020-2035
  • Figure 93: Latin America Market Volume (Units) Analysis by Country, 2020-2035
  • Figure 94: Latin America Market Value Share (%) and BPS Analysis by Country, 2025-2035
  • Figure 95: Latin America Market Y-o-Y Growth (%) Projections by Country, 2025-2035
  • Figure 96: Latin America Market Value (USD Million) Analysis by Concern, 2020-2035
  • Figure 97: Latin America Market Volume (Units) Analysis by Concern, 2020-2035
  • Figure 98: Latin America Market Value Share (%) and BPS Analysis by Concern, 2025-2035
  • Figure 99: Latin America Market Y-o-Y Growth (%) Projections by Concern, 2025-2035
  • Figure 100: Latin America Market Value (USD Million) Analysis by Active Ingredient, 2020-2035
  • Figure 101: Latin America Market Volume (Units) Analysis by Active Ingredient, 2020-2035
  • Figure 102: Latin America Market Value Share (%) and BPS Analysis by Active Ingredient, 2025-2035
  • Figure 103: Latin America Market Y-o-Y Growth (%) Projections by Active Ingredient, 2025-2035
  • Figure 104: Latin America Market Value (USD Million) Analysis by Product Type, 2020-2035
  • Figure 105: Latin America Market Volume (Units) Analysis by Product Type, 2020-2035
  • Figure 106: Latin America Market Value Share (%) and BPS Analysis by Product Type, 2025-2035
  • Figure 107: Latin America Market Y-o-Y Growth (%) Projections by Product Type, 2025-2035
  • Figure 108: Latin America Market Value (USD Million) Analysis by Channel, 2020-2035
  • Figure 109: Latin America Market Volume (Units) Analysis by Channel, 2020-2035
  • Figure 110: Latin America Market Value Share (%) and BPS Analysis by Channel, 2025-2035
  • Figure 111: Latin America Market Y-o-Y Growth (%) Projections by Channel, 2025-2035
  • Figure 112: Latin America Market Value (USD Million) Analysis by Claim, 2020-2035
  • Figure 113: Latin America Market Volume (Units) Analysis by Claim, 2020-2035
  • Figure 114: Latin America Market Value Share (%) and BPS Analysis by Claim, 2025-2035
  • Figure 115: Latin America Market Y-o-Y Growth (%) Projections by Claim, 2025-2035
  • Figure 116: Latin America Market Value (USD Million) Analysis by End User, 2020-2035
  • Figure 117: Latin America Market Volume (Units) Analysis by End User, 2020-2035
  • Figure 118: Latin America Market Value Share (%) and BPS Analysis by End User, 2025-2035
  • Figure 119: Latin America Market Y-o-Y Growth (%) Projections by End User, 2025-2035
  • Figure 120: Latin America Market Attractiveness by Concern, 2025-2035
  • Figure 121: Latin America Market Attractiveness by Active Ingredient, 2025-2035
  • Figure 122: Latin America Market Attractiveness by Product Type, 2025-2035
  • Figure 123: Latin America Market Attractiveness by Channel, 2025-2035
  • Figure 124: Latin America Market Attractiveness by Claim, 2025-2035
  • Figure 125: Latin America Market Attractiveness by End User, 2025-2035
  • Figure 126: Latin America Market Attractiveness by Country, 2025-2035
  • Figure 127: Europe Market Value (USD Million) by Concern, 2025-2035
  • Figure 128: Europe Market Value (USD Million) by Active Ingredient, 2025-2035
  • Figure 129: Europe Market Value (USD Million) by Product Type, 2025-2035
  • Figure 130: Europe Market Value (USD Million) by Channel, 2025-2035
  • Figure 131: Europe Market Value (USD Million) by Claim, 2025-2035
  • Figure 132: Europe Market Value (USD Million) by End User, 2025-2035
  • Figure 133: Europe Market Value (USD Million) by Country, 2025-2035
  • Figure 134: Europe Market Value (USD Million) Analysis by Country, 2020-2035
  • Figure 135: Europe Market Volume (Units) Analysis by Country, 2020-2035
  • Figure 136: Europe Market Value Share (%) and BPS Analysis by Country, 2025-2035
  • Figure 137: Europe Market Y-o-Y Growth (%) Projections by Country, 2025-2035
  • Figure 138: Europe Market Value (USD Million) Analysis by Concern, 2020-2035
  • Figure 139: Europe Market Volume (Units) Analysis by Concern, 2020-2035
  • Figure 140: Europe Market Value Share (%) and BPS Analysis by Concern, 2025-2035
  • Figure 141: Europe Market Y-o-Y Growth (%) Projections by Concern, 2025-2035
  • Figure 142: Europe Market Value (USD Million) Analysis by Active Ingredient, 2020-2035
  • Figure 143: Europe Market Volume (Units) Analysis by Active Ingredient, 2020-2035
  • Figure 144: Europe Market Value Share (%) and BPS Analysis by Active Ingredient, 2025-2035
  • Figure 145: Europe Market Y-o-Y Growth (%) Projections by Active Ingredient, 2025-2035
  • Figure 146: Europe Market Value (USD Million) Analysis by Product Type, 2020-2035
  • Figure 147: Europe Market Volume (Units) Analysis by Product Type, 2020-2035
  • Figure 148: Europe Market Value Share (%) and BPS Analysis by Product Type, 2025-2035
  • Figure 149: Europe Market Y-o-Y Growth (%) Projections by Product Type, 2025-2035
  • Figure 150: Europe Market Value (USD Million) Analysis by Channel, 2020-2035
  • Figure 151: Europe Market Volume (Units) Analysis by Channel, 2020-2035
  • Figure 152: Europe Market Value Share (%) and BPS Analysis by Channel, 2025-2035
  • Figure 153: Europe Market Y-o-Y Growth (%) Projections by Channel, 2025-2035
  • Figure 154: Europe Market Value (USD Million) Analysis by Claim, 2020-2035
  • Figure 155: Europe Market Volume (Units) Analysis by Claim, 2020-2035
  • Figure 156: Europe Market Value Share (%) and BPS Analysis by Claim, 2025-2035
  • Figure 157: Europe Market Y-o-Y Growth (%) Projections by Claim, 2025-2035
  • Figure 158: Europe Market Value (USD Million) Analysis by End User, 2020-2035
  • Figure 159: Europe Market Volume (Units) Analysis by End User, 2020-2035
  • Figure 160: Europe Market Value Share (%) and BPS Analysis by End User, 2025-2035
  • Figure 161: Europe Market Y-o-Y Growth (%) Projections by End User, 2025-2035
  • Figure 162: Europe Market Attractiveness by Concern, 2025-2035
  • Figure 163: Europe Market Attractiveness by Active Ingredient, 2025-2035
  • Figure 164: Europe Market Attractiveness by Product Type, 2025-2035
  • Figure 165: Europe Market Attractiveness by Channel, 2025-2035
  • Figure 166: Europe Market Attractiveness by Claim, 2025-2035
  • Figure 167: Europe Market Attractiveness by End User, 2025-2035
  • Figure 168: Europe Market Attractiveness by Country, 2025-2035
  • Figure 169: East Asia Market Value (USD Million) by Concern, 2025-2035
  • Figure 170: East Asia Market Value (USD Million) by Active Ingredient, 2025-2035
  • Figure 171: East Asia Market Value (USD Million) by Product Type, 2025-2035
  • Figure 172: East Asia Market Value (USD Million) by Channel, 2025-2035
  • Figure 173: East Asia Market Value (USD Million) by Claim, 2025-2035
  • Figure 174: East Asia Market Value (USD Million) by End User, 2025-2035
  • Figure 175: East Asia Market Value (USD Million) by Country, 2025-2035
  • Figure 176: East Asia Market Value (USD Million) Analysis by Country, 2020-2035
  • Figure 177: East Asia Market Volume (Units) Analysis by Country, 2020-2035
  • Figure 178: East Asia Market Value Share (%) and BPS Analysis by Country, 2025-2035
  • Figure 179: East Asia Market Y-o-Y Growth (%) Projections by Country, 2025-2035
  • Figure 180: East Asia Market Value (USD Million) Analysis by Concern, 2020-2035
  • Figure 181: East Asia Market Volume (Units) Analysis by Concern, 2020-2035
  • Figure 182: East Asia Market Value Share (%) and BPS Analysis by Concern, 2025-2035
  • Figure 183: East Asia Market Y-o-Y Growth (%) Projections by Concern, 2025-2035
  • Figure 184: East Asia Market Value (USD Million) Analysis by Active Ingredient, 2020-2035
  • Figure 185: East Asia Market Volume (Units) Analysis by Active Ingredient, 2020-2035
  • Figure 186: East Asia Market Value Share (%) and BPS Analysis by Active Ingredient, 2025-2035
  • Figure 187: East Asia Market Y-o-Y Growth (%) Projections by Active Ingredient, 2025-2035
  • Figure 188: East Asia Market Value (USD Million) Analysis by Product Type, 2020-2035
  • Figure 189: East Asia Market Volume (Units) Analysis by Product Type, 2020-2035
  • Figure 190: East Asia Market Value Share (%) and BPS Analysis by Product Type, 2025-2035
  • Figure 191: East Asia Market Y-o-Y Growth (%) Projections by Product Type, 2025-2035
  • Figure 192: East Asia Market Value (USD Million) Analysis by Channel, 2020-2035
  • Figure 193: East Asia Market Volume (Units) Analysis by Channel, 2020-2035
  • Figure 194: East Asia Market Value Share (%) and BPS Analysis by Channel, 2025-2035
  • Figure 195: East Asia Market Y-o-Y Growth (%) Projections by Channel, 2025-2035
  • Figure 196: East Asia Market Value (USD Million) Analysis by Claim, 2020-2035
  • Figure 197: East Asia Market Volume (Units) Analysis by Claim, 2020-2035
  • Figure 198: East Asia Market Value Share (%) and BPS Analysis by Claim, 2025-2035
  • Figure 199: East Asia Market Y-o-Y Growth (%) Projections by Claim, 2025-2035
  • Figure 200: East Asia Market Value (USD Million) Analysis by End User, 2020-2035
  • Figure 201: East Asia Market Volume (Units) Analysis by End User, 2020-2035
  • Figure 202: East Asia Market Value Share (%) and BPS Analysis by End User, 2025-2035
  • Figure 203: East Asia Market Y-o-Y Growth (%) Projections by End User, 2025-2035
  • Figure 204: East Asia Market Attractiveness by Concern, 2025-2035
  • Figure 205: East Asia Market Attractiveness by Active Ingredient, 2025-2035
  • Figure 206: East Asia Market Attractiveness by Product Type, 2025-2035
  • Figure 207: East Asia Market Attractiveness by Channel, 2025-2035
  • Figure 208: East Asia Market Attractiveness by Claim, 2025-2035
  • Figure 209: East Asia Market Attractiveness by End User, 2025-2035
  • Figure 210: East Asia Market Attractiveness by Country, 2025-2035
  • Figure 211: South Asia & Pacific Market Value (USD Million) by Concern, 2025-2035
  • Figure 212: South Asia & Pacific Market Value (USD Million) by Active Ingredient, 2025-2035
  • Figure 213: South Asia & Pacific Market Value (USD Million) by Product Type, 2025-2035
  • Figure 214: South Asia & Pacific Market Value (USD Million) by Channel, 2025-2035
  • Figure 215: South Asia & Pacific Market Value (USD Million) by Claim, 2025-2035
  • Figure 216: South Asia & Pacific Market Value (USD Million) by End User, 2025-2035
  • Figure 217: South Asia & Pacific Market Value (USD Million) by Country, 2025-2035
  • Figure 218: South Asia & Pacific Market Value (USD Million) Analysis by Country, 2020-2035
  • Figure 219: South Asia & Pacific Market Volume (Units) Analysis by Country, 2020-2035
  • Figure 220: South Asia & Pacific Market Value Share (%) and BPS Analysis by Country, 2025-2035
  • Figure 221: South Asia & Pacific Market Y-o-Y Growth (%) Projections by Country, 2025-2035
  • Figure 222: South Asia & Pacific Market Value (USD Million) Analysis by Concern, 2020-2035
  • Figure 223: South Asia & Pacific Market Volume (Units) Analysis by Concern, 2020-2035
  • Figure 224: South Asia & Pacific Market Value Share (%) and BPS Analysis by Concern, 2025-2035
  • Figure 225: South Asia & Pacific Market Y-o-Y Growth (%) Projections by Concern, 2025-2035
  • Figure 226: South Asia & Pacific Market Value (USD Million) Analysis by Active Ingredient, 2020-2035
  • Figure 227: South Asia & Pacific Market Volume (Units) Analysis by Active Ingredient, 2020-2035
  • Figure 228: South Asia & Pacific Market Value Share (%) and BPS Analysis by Active Ingredient, 2025-2035
  • Figure 229: South Asia & Pacific Market Y-o-Y Growth (%) Projections by Active Ingredient, 2025-2035
  • Figure 230: South Asia & Pacific Market Value (USD Million) Analysis by Product Type, 2020-2035
  • Figure 231: South Asia & Pacific Market Volume (Units) Analysis by Product Type, 2020-2035
  • Figure 232: South Asia & Pacific Market Value Share (%) and BPS Analysis by Product Type, 2025-2035
  • Figure 233: South Asia & Pacific Market Y-o-Y Growth (%) Projections by Product Type, 2025-2035
  • Figure 234: South Asia & Pacific Market Value (USD Million) Analysis by Channel, 2020-2035
  • Figure 235: South Asia & Pacific Market Volume (Units) Analysis by Channel, 2020-2035
  • Figure 236: South Asia & Pacific Market Value Share (%) and BPS Analysis by Channel, 2025-2035
  • Figure 237: South Asia & Pacific Market Y-o-Y Growth (%) Projections by Channel, 2025-2035
  • Figure 238: South Asia & Pacific Market Value (USD Million) Analysis by Claim, 2020-2035
  • Figure 239: South Asia & Pacific Market Volume (Units) Analysis by Claim, 2020-2035
  • Figure 240: South Asia & Pacific Market Value Share (%) and BPS Analysis by Claim, 2025-2035
  • Figure 241: South Asia & Pacific Market Y-o-Y Growth (%) Projections by Claim, 2025-2035
  • Figure 242: South Asia & Pacific Market Value (USD Million) Analysis by End User, 2020-2035
  • Figure 243: South Asia & Pacific Market Volume (Units) Analysis by End User, 2020-2035
  • Figure 244: South Asia & Pacific Market Value Share (%) and BPS Analysis by End User, 2025-2035
  • Figure 245: South Asia & Pacific Market Y-o-Y Growth (%) Projections by End User, 2025-2035
  • Figure 246: South Asia & Pacific Market Attractiveness by Concern, 2025-2035
  • Figure 247: South Asia & Pacific Market Attractiveness by Active Ingredient, 2025-2035
  • Figure 248: South Asia & Pacific Market Attractiveness by Product Type, 2025-2035
  • Figure 249: South Asia & Pacific Market Attractiveness by Channel, 2025-2035
  • Figure 250: South Asia & Pacific Market Attractiveness by Claim, 2025-2035
  • Figure 251: South Asia & Pacific Market Attractiveness by End User, 2025-2035
  • Figure 252: South Asia & Pacific Market Attractiveness by Country, 2025-2035
  • Figure 253: Middle East and Africa Market Value (USD Million) by Concern, 2025-2035
  • Figure 254: Middle East and Africa Market Value (USD Million) by Active Ingredient, 2025-2035
  • Figure 255: Middle East and Africa Market Value (USD Million) by Product Type, 2025-2035
  • Figure 256: Middle East and Africa Market Value (USD Million) by Channel, 2025-2035
  • Figure 257: Middle East and Africa Market Value (USD Million) by Claim, 2025-2035
  • Figure 258: Middle East and Africa Market Value (USD Million) by End User, 2025-2035
  • Figure 259: Middle East and Africa Market Value (USD Million) by Country, 2025-2035
  • Figure 260: Middle East and Africa Market Value (USD Million) Analysis by Country, 2020-2035
  • Figure 261: Middle East and Africa Market Volume (Units) Analysis by Country, 2020-2035
  • Figure 262: Middle East and Africa Market Value Share (%) and BPS Analysis by Country, 2025-2035
  • Figure 263: Middle East and Africa Market Y-o-Y Growth (%) Projections by Country, 2025-2035
  • Figure 264: Middle East and Africa Market Value (USD Million) Analysis by Concern, 2020-2035
  • Figure 265: Middle East and Africa Market Volume (Units) Analysis by Concern, 2020-2035
  • Figure 266: Middle East and Africa Market Value Share (%) and BPS Analysis by Concern, 2025-2035
  • Figure 267: Middle East and Africa Market Y-o-Y Growth (%) Projections by Concern, 2025-2035
  • Figure 268: Middle East and Africa Market Value (USD Million) Analysis by Active Ingredient, 2020-2035
  • Figure 269: Middle East and Africa Market Volume (Units) Analysis by Active Ingredient, 2020-2035
  • Figure 270: Middle East and Africa Market Value Share (%) and BPS Analysis by Active Ingredient, 2025-2035
  • Figure 271: Middle East and Africa Market Y-o-Y Growth (%) Projections by Active Ingredient, 2025-2035
  • Figure 272: Middle East and Africa Market Value (USD Million) Analysis by Product Type, 2020-2035
  • Figure 273: Middle East and Africa Market Volume (Units) Analysis by Product Type, 2020-2035
  • Figure 274: Middle East and Africa Market Value Share (%) and BPS Analysis by Product Type, 2025-2035
  • Figure 275: Middle East and Africa Market Y-o-Y Growth (%) Projections by Product Type, 2025-2035
  • Figure 276: Middle East and Africa Market Value (USD Million) Analysis by Channel, 2020-2035
  • Figure 277: Middle East and Africa Market Volume (Units) Analysis by Channel, 2020-2035
  • Figure 278: Middle East and Africa Market Value Share (%) and BPS Analysis by Channel, 2025-2035
  • Figure 279: Middle East and Africa Market Y-o-Y Growth (%) Projections by Channel, 2025-2035
  • Figure 280: Middle East and Africa Market Value (USD Million) Analysis by Claim, 2020-2035
  • Figure 281: Middle East and Africa Market Volume (Units) Analysis by Claim, 2020-2035
  • Figure 282: Middle East and Africa Market Value Share (%) and BPS Analysis by Claim, 2025-2035
  • Figure 283: Middle East and Africa Market Y-o-Y Growth (%) Projections by Claim, 2025-2035
  • Figure 284: Middle East and Africa Market Value (USD Million) Analysis by End User, 2020-2035
  • Figure 285: Middle East and Africa Market Volume (Units) Analysis by End User, 2020-2035
  • Figure 286: Middle East and Africa Market Value Share (%) and BPS Analysis by End User, 2025-2035
  • Figure 287: Middle East and Africa Market Y-o-Y Growth (%) Projections by End User, 2025-2035
  • Figure 288: Middle East and Africa Market Attractiveness by Concern, 2025-2035
  • Figure 289: Middle East and Africa Market Attractiveness by Active Ingredient, 2025-2035
  • Figure 290: Middle East and Africa Market Attractiveness by Product Type, 2025-2035
  • Figure 291: Middle East and Africa Market Attractiveness by Channel, 2025-2035
  • Figure 292: Middle East and Africa Market Attractiveness by Claim, 2025-2035
  • Figure 293: Middle East and Africa Market Attractiveness by End User, 2025-2035
  • Figure 294: Middle East and Africa Market Attractiveness by Country, 2025-2035

Frequently Asked Questions

How big is the Chronic Skin Redness Care Market in 2025?

The global Chronic Skin Redness Care Market is estimated to be valued at USD 3,205.20 million in 2025.

What will be the size of the Chronic Skin Redness Care Market in 2035?

The market size for the Chronic Skin Redness Care Market is projected to reach USD 7,401.80 million by 2035.

How much will be the Chronic Skin Redness Care Market growth between 2025 and 2035?

The Chronic Skin Redness Care Market is expected to grow at a CAGR of 8.70% between 2025 and 2035.

What are the key product types in the Chronic Skin Redness Care Market?

The key product types in the Chronic Skin Redness Care Market are creams and other formats such as gels, serums, and lotions.

Which claim segment will contribute significant share in the Chronic Skin Redness Care Market in 2025?

In terms of claims, the dermatologist-tested segment is projected to command 51.50% share in the Chronic Skin Redness Care Market in 2025.

Explore Similar Insights

Future Market Insights

Chronic Skin Redness Care Market

Chat With

MaRIA

Hi There, I am MaRIA, Your Market Research Intelligence Assistant. How may I help you?