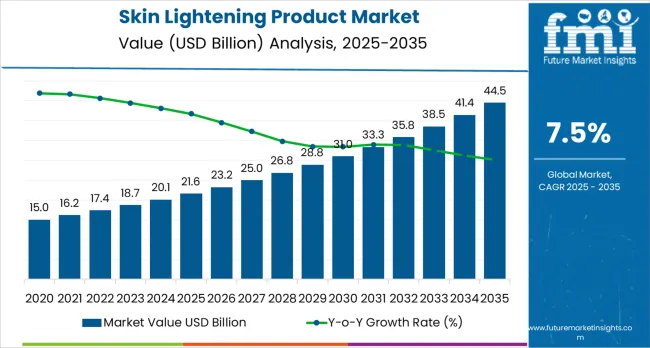
The skin lightening product market is expected to grow from USD 21.6 billion in 2025 to USD 44.5 billion by 2035, representing substantial growth, demonstrating the accelerating adoption of advanced skincare technology and beauty enhancement optimization across cosmetics infrastructure, personal care sectors, and consumer beauty markets.
The first half of the decade (2025-2030) will witness the market increase from USD 21.6 billion to USD 31.0 billion, adding USD 9.4 billion in value, which constitutes 41% of the total forecasted growth period. This phase will be characterized by the rapid adoption of lotion and cream systems, driven by increasing beauty enhancement volumes and the growing need for advanced skincare solutions worldwide. Enhanced formulation capabilities and automated beauty systems will become standard expectations rather than premium options.
The latter half (2030-2035) will witness continued growth, from USD 31.0 billion to USD 44.5 billion, representing an addition of USD 13.5 billion, or 43% of the decade's expansion. This period will be defined by mass market penetration of organic technologies, integration with comprehensive beauty platforms, and seamless compatibility with existing skincare infrastructure. The market trajectory signals fundamental shifts in how beauty facilities approach enhancement optimization and skin tone management, with participants positioned to benefit from growing demand across multiple beauty segments and consumer categories.
Rising consumer consciousness about personal appearance, coupled with a global trend toward self-care and wellness, has led to greater adoption of skin lightening products. These products, which include creams, serums, lotions, and masks, are designed to address a variety of skin concerns such as dark spots, melasma, acne scars, and age spots. The market is further driven by an increasing focus on skin health and the growing acceptance of dermatologically tested and safe formulations, which provide gentle, effective treatments without harsh side effects.
Industry dynamics are influenced by growing consumer interest in natural and organic ingredients. Consumers are increasingly favoring products with plant-based, safe, and effective ingredients, such as vitamin C, licorice extract, and arbutin, over those containing potentially harmful chemicals. This shift towards safer, sustainable formulations is pushing manufacturers to innovate, creating skin lightening solutions that align with evolving consumer preferences for clean beauty and ethical sourcing.
Opportunities remain substantial as skin lightening products expand beyond traditional applications and increasingly address holistic skin health. Technological advancements in formulation and delivery methods, such as nano-encapsulation, are enhancing the effectiveness of products while improving their safety profile. As consumers increasingly seek multi-functional skincare solutions, the integration of anti-aging, sun protection, and skin repair properties into skin lightening formulations will be a key driver of market growth.
| Metric | Value |
|---|---|
| Market Value (2025) → | USD 21.6 billion |
| Market Forecast (2035) ↑ | USD 44.5 billion |
| Growth Rate ★ | 7.5% CAGR |
| Leading Technology → | Lotions and Creams Type |
| Primary Application → | Women Segment |
The market demonstrates strong fundamentals with lotion and cream systems capturing a dominant share through advanced skincare capabilities and beauty optimization. Women applications drive primary demand, supported by increasing personal care activity and cosmetic enhancement requirements. Geographic expansion remains concentrated in developed markets with established beauty infrastructure, while emerging economies show accelerating adoption rates driven by urbanization initiatives and rising beauty standards.
Market expansion rests on three fundamental shifts driving adoption across the beauty and personal care sectors. 1. Consumer awareness enhancement creates compelling operational advantages through skin lightening products that provide immediate beauty improvement without major lifestyle changes, enabling consumers to meet appearance standards while maintaining cost effectiveness and reducing professional treatment dependencies. 2. Beauty industry modernization accelerates as facilities worldwide seek advanced systems that complement traditional skincare methods, enabling precise skin tone control and enhancement management that align with industry regulations and beauty efficiency standards. 3. Digital platform integration drives adoption from beauty retailers and consumers requiring effective skincare solutions that minimize complexity while maintaining performance standards during daily beauty routines.
However, growth faces headwinds from regulatory compliance challenges that vary across cosmetic suppliers regarding the safety of specialized skincare ingredients and formulation systems, which may limit penetration in regions with strict beauty product regulations or health-sensitive consumer environments. Technical limitations also persist regarding product capabilities and skin conditions that may reduce effectiveness in specialized applications or challenging skin environments, which affect product performance and beauty consistency.
The skin lightening product market represents a diverse yet critical opportunity driven by expanding beauty infrastructure, cosmetics modernization, and the adoption of personal care and wellness platforms. The market will expand from USD 21.6B in 2025 to USD 44.5B by 2035, adding USD 22.9B in new value. Growth opportunities are concentrated around advanced lotions and creams, organic formulations, consumer-driven women’s applications, and digital distribution strategies.
Primary Classification: The market segments by product type into lotions and creams, foam skin lightening, gels skin lightening, serum and toner, scrubs, and others, representing the evolution from basic skincare equipment to specialized products for comprehensive beauty optimization.
Secondary Classification: End user segmentation divides the market into women and men sectors, reflecting distinct requirements for beauty performance, skincare standards, and enhancement efficiency requirements.
Tertiary Classification: Price segmentation covers economic (USD 10-50), mid-range (USD 50-200), and premium (USD 200 &Above), nature classification includes herbal, synthetic, and organic, while sales channel applications span pharmacies, hypermarkets, specialty outlets, convenience stores, beauty stores, e-retailers, and others.
Regional Classification: Geographic distribution covers North America, Latin America, Western Europe, Eastern Europe, East Asia, South Asia Pacific, and Middle East &Africa, with developed markets leading adoption while emerging economies show accelerating growth patterns driven by beauty expansion programs.
The segmentation structure reveals technology progression from standard skincare equipment toward specialized systems with enhanced beauty performance and automation capabilities, while application diversity spans from consumer beauty to professional skincare requiring precise enhancement solutions.
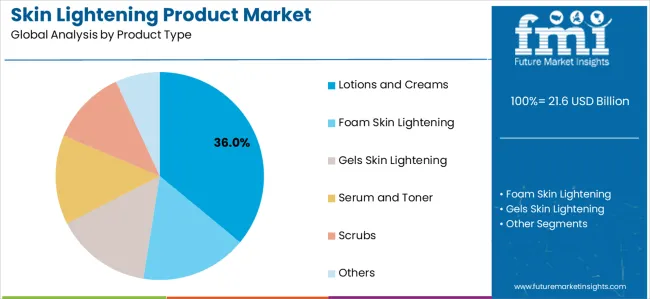
Market Position: Lotion and cream systems command the leading position in the skin lightening product market with 36.0% market share through advanced skincare features, including superior moisturizing capability, operational flexibility, and beauty optimization that enable consumers to achieve optimal enhancement across diverse personal and professional environments.
Value Drivers: The segment benefits from consumer preference for reliable skincare systems that provide consistent performance, reduced application complexity, and beauty efficiency optimization without requiring significant routine modifications. Advanced formulation features enable automated enhancement processes, skin consistency, and integration with existing beauty regimens, where performance and reliability represent critical consumer requirements.
Competitive Advantages: Lotion and cream systems differentiate through proven operational stability, consistent skincare characteristics, and integration with automated beauty systems that enhance consumer effectiveness while maintaining optimal enhancement standards suitable for diverse personal and professional applications.
Key market characteristics:
Foam, gels, serums and toners, and other skin lightening products maintain collectively 64.0% market position in the skin lightening product market due to their specialized skincare properties and application advantages. These systems appeal to consumers requiring specific product characteristics with competitive pricing for diverse beauty and skincare applications. Market growth is driven by cosmetics expansion, emphasizing reliable skincare solutions and operational efficiency through optimized formulation designs.
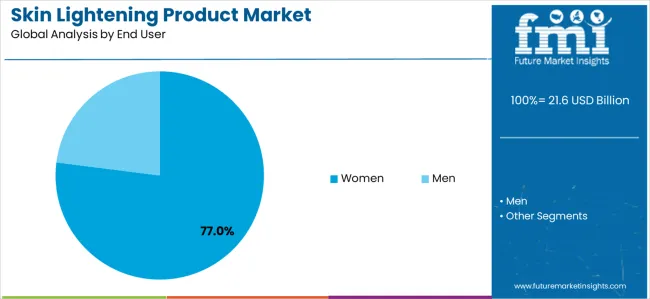
Market Context: Women applications demonstrate the highest market share with 77.0% due to widespread adoption of beauty enhancement systems and increasing focus on skincare optimization, appearance enhancement, and personal care applications that maximize beauty while maintaining cost standards.
Appeal Factors: Women consumers prioritize system reliability, beauty optimization, and integration with existing skincare infrastructure that enables coordinated enhancement across multiple personal care operations. The segment benefits from substantial beauty investment and modernization programs that emphasize the acquisition of reliable systems for performance enhancement and skincare efficiency applications.
Growth Drivers: Beauty enhancement programs incorporate skin lightening products as standard equipment for personal care operations, while women consumer growth increases demand for advanced beauty capabilities that comply with performance standards and minimize routine complexity.
Market Challenges: Varying beauty standards and skincare infrastructure differences may limit system standardization across different applications or cultural scenarios.
Application dynamics include:
Men applications capture 23.0% market share through specialized requirements in personal care facilities, grooming operations, and professional applications. These consumers demand reliable systems capable of operating in demanding environments while providing effective performance and skincare reliability capabilities.
Growth Accelerators: Beauty industry development drives primary adoption as skin lightening products provide skincare efficiency capabilities that enable consumers to meet appearance standards without excessive treatment investments, supporting personal care operations and beauty missions that require precise enhancement applications. Consumer awareness expansion accelerates market growth as individuals seek effective systems that minimize skincare complexity while maintaining operational effectiveness during daily beauty and personal care scenarios. Cosmetics technology spending increases worldwide, creating continued demand for skincare systems that complement traditional beauty methods and provide operational flexibility in complex personal care environments.
Growth Inhibitors: Regulatory compliance challenges vary across cosmetic suppliers regarding the safety of specialized skincare ingredients and formulation systems, which may limit operational flexibility and market penetration in regions with strict beauty regulations or health-sensitive consumer environments. Technical performance limitations persist regarding product capabilities and skin conditions that may reduce effectiveness in specialized applications, sensitive skin environments, or consumer conditions, affecting product performance and skincare consistency. Market fragmentation across multiple beauty specifications and skincare standards creates compatibility concerns between different product suppliers and existing personal care infrastructure.
Market Evolution Patterns: Adoption accelerates in beauty and personal care sectors where performance requirements justify skincare system costs, with geographic concentration in developed markets transitioning toward mainstream adoption in emerging economies driven by urbanization initiatives and beauty development. Technology development focuses on enhanced product capabilities, improved skincare efficiency, and integration with automated monitoring systems that optimize beauty and personal care effectiveness. The market could face disruption if alternative skincare technologies or beauty standards significantly limit the deployment of traditional enhancement equipment in personal care or cosmetic applications.
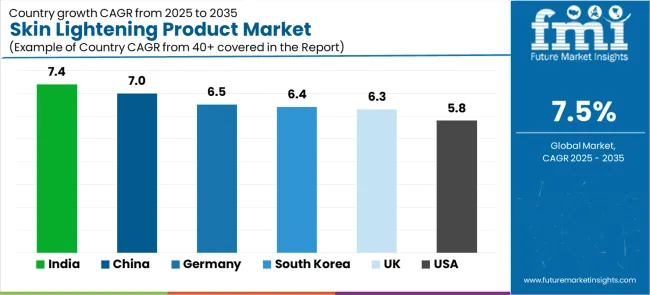
The skin lightening product market demonstrates varied regional dynamics with Growth Leaders including India (7.4% growth rate) and China (7.0% growth rate) driving expansion through beauty initiatives and cosmetics development. Steady Performers encompass United States (5.8% growth rate), United Kingdom (6.3% growth rate), and developed regions, benefiting from established beauty industries and advanced skincare adoption. Emerging Markets feature Germany (6.5% growth rate) and developing regions, where cosmetics initiatives and technology modernization support consistent growth patterns.
| Country | Growth Rate (2025-2035) |
|---|---|
| India | 7.4% |
| China | 7.0% |
| Germany | 6.5% |
| South Korea | 6.4% |
| United Kingdom | 6.3% |
| United States | 5.8% |
Regional synthesis reveals Asian markets leading adoption through beauty expansion and cosmetics development, while North American countries maintain steady expansion supported by skincare technology advancement and performance standardization requirements. European markets show moderate growth driven by beauty applications and enhancement optimization trends.
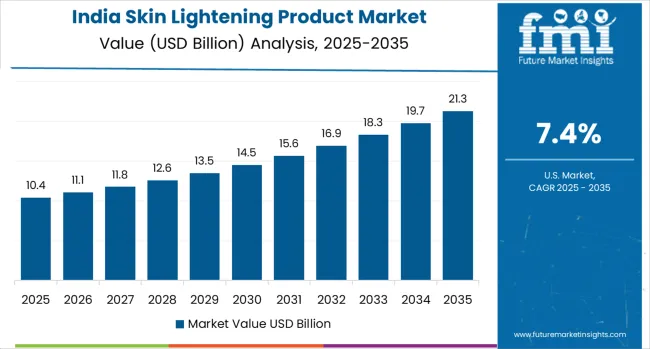
India establishes fastest market growth through aggressive beauty programs and comprehensive cosmetics development, integrating advanced skin lightening products as standard components in personal care and beauty installations. The country's 7.4% growth rate reflects cultural preferences and domestic beauty capabilities that mandate the use of advanced skincare systems in personal care and cosmetic facilities. Growth concentrates in major urban centers, including Mumbai, Delhi, and Bangalore, where beauty technology development showcases integrated skincare systems that appeal to consumers seeking advanced enhancement capabilities and personal care applications.
Indian manufacturers are developing cost-effective skincare solutions that combine domestic production advantages with advanced formulation features, including automated processes and enhanced beauty capabilities. Distribution channels through beauty suppliers and cosmetic distributors expand market access, while cultural support for appearance enhancement supports adoption across diverse personal care and beauty segments.
Strategic Market Indicators:
In Beijing, Shanghai, and Guangzhou, beauty facilities and cosmetic manufacturers are implementing advanced skin lightening products as standard equipment for enhancement optimization and skincare applications, driven by increasing consumer beauty investment and cosmetics modernization programs that emphasize the importance of skincare capabilities. The market holds a 7.0% growth rate, supported by consumer beauty initiatives and cosmetics development programs that promote advanced skincare systems for personal care and beauty facilities. Chinese consumers are adopting skincare systems that provide consistent operational performance and beauty features, particularly appealing in urban regions where enhancement efficiency and performance standards represent critical consumer requirements.
Market expansion benefits from growing beauty technology manufacturing capabilities and international technology transfer agreements that enable domestic production of advanced skincare systems for personal care and cosmetic applications. Technology adoption follows patterns established in cosmetic equipment, where reliability and performance drive procurement decisions and consumer deployment.
Market Intelligence Brief:
Germany establishes beauty leadership through comprehensive cosmetics programs and advanced skincare infrastructure development, integrating skin lightening products across personal care and beauty applications. The country's 6.5% growth rate reflects established beauty industry relationships and mature skincare technology adoption that supports widespread use of enhancement systems in personal care and cosmetic facilities. Growth concentrates in major beauty centers, including Berlin, Munich, and Hamburg, where cosmetic technology showcases mature skincare deployment that appeals to consumers seeking proven enhancement capabilities and beauty efficiency applications.
German skincare providers leverage established distribution networks and comprehensive manufacturing capabilities, including technical support programs and performance optimization that create customer relationships and operational advantages. The market benefits from mature beauty regulations and cosmetics standards that support skincare use while supporting technology advancement and operational optimization.
Market Intelligence Brief:
United Kingdom's advanced beauty technology market demonstrates sophisticated skin lightening product deployment with documented operational effectiveness in personal care applications and cosmetics through integration with existing beauty systems and skincare infrastructure. The country leverages expertise in beauty technology and enhancement integration to maintain a 6.3% growth rate. Technology centers, including London, Manchester, and Birmingham, showcase premium installations where skincare systems integrate with comprehensive beauty platforms and enhancement management systems to optimize skincare operations and beauty effectiveness.
British manufacturers prioritize system reliability and performance compliance in skincare equipment development, creating demand for premium systems with advanced features, including beauty monitoring integration and automated enhancement processing. The market benefits from established beauty technology infrastructure and a willingness to invest in advanced skincare technologies that provide long-term operational benefits and compliance with international beauty standards.
Market Intelligence Brief:
United States'market expansion benefits from diverse beauty demand, including cosmetics infrastructure modernization in New York and California, personal care facility upgrades, and consumer beauty programs that increasingly incorporate skincare solutions for enhancement optimization applications. The country maintains a 5.8% growth rate, driven by rising beauty activity and increasing recognition of skincare technology benefits, including precise enhancement control and reduced beauty complexity.
Market dynamics focus on cost-effective skincare solutions that balance advanced operational performance with affordability considerations important to American beauty consumers. Growing cosmetics industrialization creates continued demand for modern skincare systems in new facility infrastructure and beauty modernization projects.
Strategic Market Considerations:
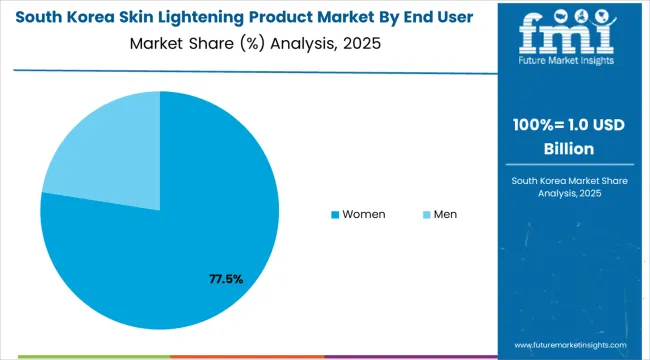
South Korea's market expansion benefits from K-beauty leadership and comprehensive skincare development, integrating advanced skin lightening products across beauty and cosmetic applications. The country maintains a 6.4% growth rate, driven by beauty innovation and increasing recognition of advanced skincare technology benefits, including precise enhancement control and improved beauty effectiveness.
Market dynamics focus on premium skincare solutions that provide advanced operational performance and beauty capabilities important to Korean cosmetic consumers. Growing beauty technology industrialization creates continued demand for innovative skincare systems in beauty infrastructure and cosmetic modernization projects.
Strategic Market Considerations:
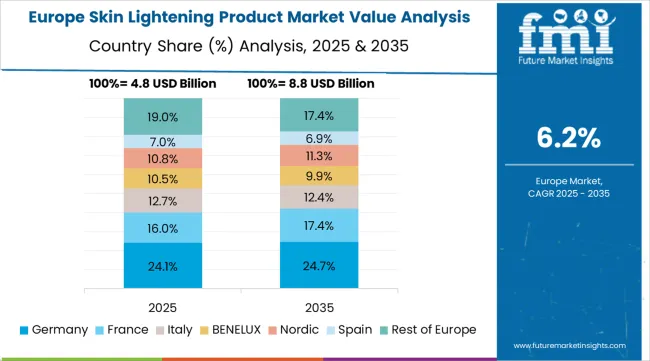
The European skin lightening product market is projected to grow from USD 6.2 billion in 2025 to USD 12.8 billion by 2035, registering a CAGR of 7.5% over the forecast period. Germany is expected to maintain its leadership position with a 28.4% market share in 2025, supported by its advanced beauty technology infrastructure and major cosmetic centers.
United Kingdom follows with a 22.1% share in 2025, driven by comprehensive beauty programs and skincare technology development initiatives. France holds a 18.9% share through specialized cosmetic applications and enhancement optimization requirements. Italy commands a 14.7% share, while Spain accounts for 9.2% in 2025. Netherlands maintains a 4.8% share, while other European countries account for 1.9% of the European market in 2025. The Rest of Europe region is anticipated to gain momentum, expanding its collective share from 6.8% to 7.2% by 2035, attributed to increasing beauty adoption in Nordic countries and emerging cosmetic facilities implementing technology modernization programs.
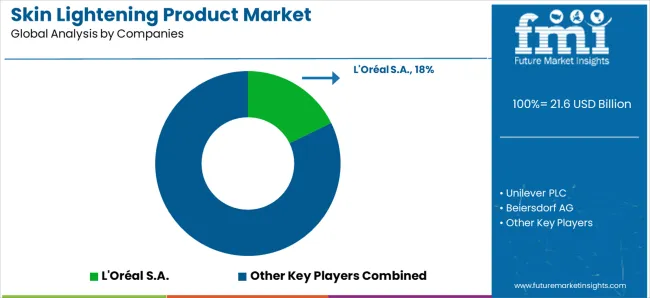
The skin lightening product market features 10–15 key players, with the top five companies controlling 60–65% of global market share, driven by their strong brand equity, extensive distribution networks, and established consumer trust. Competition is focused on product efficacy, ingredient quality, regulatory compliance, and brand reputation, rather than pricing alone. L'Oréal S.A. leads with an 18% market share, leveraging its extensive portfolio of dermatologist-recommended skin care products, global distribution capabilities, and cutting-edge formulations that address diverse skin concerns while adhering to stringent safety standards.
Market leaders such as L'Oréal, Unilever PLC, Procter & Gamble Company, Beiersdorf AG, and Shiseido Company dominate by offering well-established product lines across multiple skin types, ages, and regions. Their competitive edge lies in their ability to develop scientifically-backed formulas, robust marketing strategies, and deep retail partnerships, positioning them as trusted global brands. Their emphasis on skin health and safety, coupled with global consumer awareness campaigns, gives them a strong foothold in both mature and emerging markets.
Challengers like Estée Lauder Companies Inc., VLCC Health Care Limited, and Lotus Herbals Private Limited target niche markets with organic and alternative skincare options, appealing to environmentally-conscious consumers and those seeking customized solutions. Regional players such as Clarins Group and Himalaya Global Holdings Limited focus on offering localized formulations that cater to specific regional preferences and skin types, driving growth in key geographic markets through specialized product offerings and competitive pricing.
| Item | Value |
|---|---|
| Quantitative Units | USD 21.6 billion |
| Product Type | Lotions and Creams, Foam Skin Lightening, Gels Skin Lightening, Serum and Toner, Scrubs, Others |
| End User | Women, Men |
| Price | Economic (USD 10-50), Mid-range (USD 50-200), Premium (USD 200 &Above) |
| Nature | Herbal, Synthetic, Organic |
| Sales Channel | Pharmacies, Hypermarkets, Specialty Outlets, Convenience Stores, Beauty Stores, E-Retailers, Others |
| Regions Covered | North America, Latin America, Western Europe, Eastern Europe, East Asia, South Asia Pacific, Middle East &Africa |
| Countries Covered | United States, China, Germany, India, United Kingdom, South Korea, Japan, Canada, Brazil, France, Australia, and 25+ additional countries |
| Key Companies Profiled | L'Oréal S.A., Unilever PLC, Procter & Gamble Company, Beiersdorf AG, Shiseido Company, Estée Lauder Companies Inc., VLCC Health Care Limited, Lotus Herbals Private Limited, Clarins Group, and Himalaya Global Holdings Limited |
| Additional Attributes | Dollar sales by product type and end user categories, regional adoption trends across Asia Pacific, North America, and Western Europe, competitive landscape with cosmetic manufacturers and beauty suppliers, consumer preferences for precision enhancement control and system reliability. |
The global skin lightening product market is estimated to be valued at USD 21.6 billion in 2025.
The market size for the skin lightening product market is projected to reach USD 44.5 billion by 2035.
The skin lightening product market is expected to grow at a 7.5% CAGR between 2025 and 2035.
The key product types in skin lightening product market are lotions and creams, foam skin lightening, gels skin lightening, serum and toner, scrubs and others.
In terms of end user, women segment to command 77.0% share in the skin lightening product market in 2025.


Our Research Products

The "Full Research Suite" delivers actionable market intel, deep dives on markets or technologies, so clients act faster, cut risk, and unlock growth.

The Leaderboard benchmarks and ranks top vendors, classifying them as Established Leaders, Leading Challengers, or Disruptors & Challengers.

Locates where complements amplify value and substitutes erode it, forecasting net impact by horizon

We deliver granular, decision-grade intel: market sizing, 5-year forecasts, pricing, adoption, usage, revenue, and operational KPIs—plus competitor tracking, regulation, and value chains—across 60 countries broadly.

Spot the shifts before they hit your P&L. We track inflection points, adoption curves, pricing moves, and ecosystem plays to show where demand is heading, why it is changing, and what to do next across high-growth markets and disruptive tech

Real-time reads of user behavior. We track shifting priorities, perceptions of today’s and next-gen services, and provider experience, then pace how fast tech moves from trial to adoption, blending buyer, consumer, and channel inputs with social signals (#WhySwitch, #UX).

Partner with our analyst team to build a custom report designed around your business priorities. From analysing market trends to assessing competitors or crafting bespoke datasets, we tailor insights to your needs.
Supplier Intelligence
Discovery & Profiling
Capacity & Footprint
Performance & Risk
Compliance & Governance
Commercial Readiness
Who Supplies Whom
Scorecards & Shortlists
Playbooks & Docs
Category Intelligence
Definition & Scope
Demand & Use Cases
Cost Drivers
Market Structure
Supply Chain Map
Trade & Policy
Operating Norms
Deliverables
Buyer Intelligence
Account Basics
Spend & Scope
Procurement Model
Vendor Requirements
Terms & Policies
Entry Strategy
Pain Points & Triggers
Outputs
Pricing Analysis
Benchmarks
Trends
Should-Cost
Indexation
Landed Cost
Commercial Terms
Deliverables
Brand Analysis
Positioning & Value Prop
Share & Presence
Customer Evidence
Go-to-Market
Digital & Reputation
Compliance & Trust
KPIs & Gaps
Outputs
Full Research Suite comprises of:
Market outlook & trends analysis
Interviews & case studies
Strategic recommendations
Vendor profiles & capabilities analysis
5-year forecasts
8 regions and 60+ country-level data splits
Market segment data splits
12 months of continuous data updates
DELIVERED AS:
PDF EXCEL ONLINE
Skin Lightening Lip Balm Market Trends – Demand & Forecast 2024-2034
Skincare Products Market Size and Share Forecast Outlook 2025 to 2035
Hair Lightening Products Market Size and Share Forecast Outlook 2025 to 2035
Men’s Skincare Products Market Size, Growth, and Forecast for 2025 to 2035
Oily Skin Control Products Market Analysis - Size and Share Forecast Outlook 2025 to 2035
Dehydrated Skin Product Market Forecast Outlook 2025 to 2035
Buffering Skincare Products Market Analysis - Size and Share Forecast Outlook 2025 to 2035
Intimate Lightening Products Market Size and Share Forecast Outlook 2025 to 2035
Tea-Based Skin Care Products Market Analysis by Product Type, Tea Type, Skin Type, Sales Channel and Region from 2025 to 2035
Astringent Skin Care Products Market Analysis - Size and Share Forecast Outlook 2025 to 2035
Dispersing Skin Care Products Market Size and Share Forecast Outlook 2025 to 2035
Lubricating Skin Care Products Market Analysis - Size and Share Forecast Outlook 2025 to 2035
Moisturizing Skincare Products Market Size and Share Forecast Outlook 2025 to 2035
Anti-Fatigue Skincare Products Market Size and Share Forecast Outlook 2025 to 2035
Incontinence Skincare Products Market Analysis by Product Type, Price, End-User, Sales Channel and Region 2025 to 2035
Anti-Pollution Skin Care Products Market Trends - Growth & Forecast 2025 to 2035
Plant Stem Cell Skincare Product Market Size and Share Forecast Outlook 2025 to 2035
Anti-Inflammatory Skincare Products Market Size and Share Forecast Outlook 2025 to 2035
Allantoin Extract for Skincare Products Market Analysis – Trends, Growth & Forecast 2025 to 2035
Western Europe Men’s Skincare Market Analysis – Forecast 2023-2033

Thank you!
You will receive an email from our Business Development Manager. Please be sure to check your SPAM/JUNK folder too.
Chat With
MaRIA