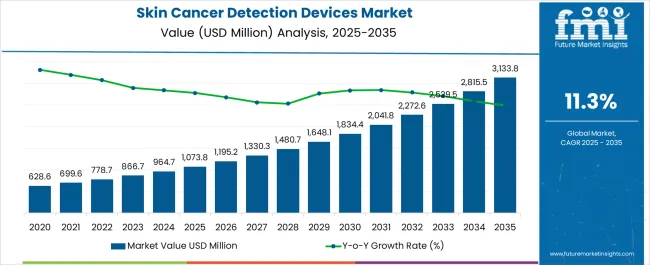
The Skin Cancer Detection Devices Market is estimated to be valued at USD 1073.8 million in 2025 and is projected to reach USD 3133.8 million by 2035, registering a compound annual growth rate (CAGR) of 11.3% over the forecast period.
| Metric | Value |
|---|---|
| Skin Cancer Detection Devices Market Estimated Value in (2025 E) | USD 1073.8 million |
| Skin Cancer Detection Devices Market Forecast Value in (2035 F) | USD 3133.8 million |
| Forecast CAGR (2025 to 2035) | 11.3% |
The skin cancer detection devices market is experiencing robust expansion as the global burden of skin cancer continues to rise and demand for early detection technologies grows. Increasing awareness among patients and clinicians regarding the importance of early diagnosis has accelerated the adoption of advanced imaging and diagnostic tools.
Technological improvements in optical imaging, AI assisted diagnostic platforms, and non invasive modalities have further enhanced accuracy and efficiency in clinical settings. Hospitals and specialty clinics are investing in modern diagnostic equipment to reduce biopsy dependence and improve patient outcomes.
Public health initiatives, coupled with favorable reimbursement frameworks in developed markets, are also supporting widespread adoption. The outlook remains promising as continuous innovation and healthcare system integration pave the way for broader accessibility and enhanced precision in skin cancer diagnostics.
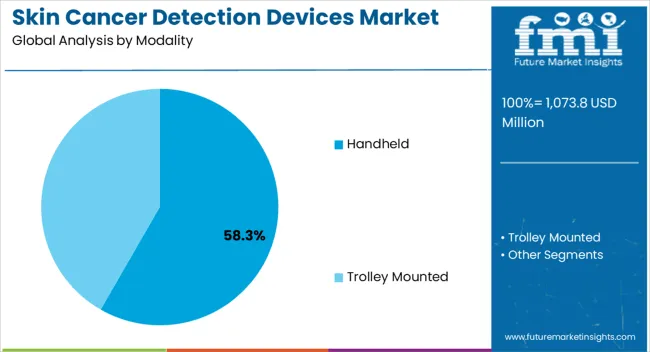
The handheld modality segment is projected to hold 58.30% of total market revenue by 2025, positioning it as the leading modality. This dominance is attributed to the ease of use, portability, and cost effectiveness of handheld devices, which allow for quick and accurate skin lesion assessment in diverse clinical and outpatient settings.
The capability to provide real time imaging and diagnostic insights without requiring large scale infrastructure has increased its adoption among dermatologists and primary care practitioners. Continuous innovation in handheld optical technologies, including dermatoscopes and AI powered imaging devices, has further improved diagnostic accuracy and user convenience.
These advantages have reinforced handheld devices as the preferred choice for skin cancer detection, especially in early stage screening.
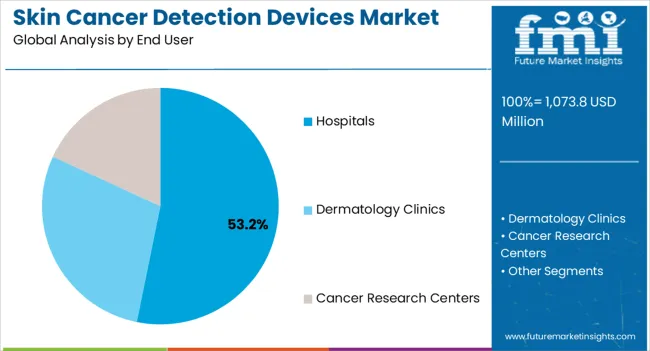
The hospitals segment is expected to account for 53.20% of overall market revenue by 2025, making it the dominant end user. Hospitals serve as the primary centers for diagnosis, treatment, and comprehensive patient management, driving higher adoption of advanced skin cancer detection technologies.
The presence of multidisciplinary teams, robust infrastructure, and access to reimbursement frameworks have strengthened the role of hospitals in early cancer detection. Investments in advanced diagnostic modalities and the integration of AI driven tools for accuracy and workflow efficiency have further supported this segment’s growth.
With rising patient inflows and increased demand for specialized dermatological services, hospitals continue to represent the largest share in the market.
From 2020 to 2025, the global skin cancer detection devices market experienced a CAGR of 11.8%, reaching a market size of USD 1073.8 million in 2025.
From 2020 to 2025, the global skin cancer detection devices market industry witnessed steady growth due to the increased awareness and acceptance of skin cancer detection devices. The growing public awareness of the need of early identification and prevention of skin cancer has aided the expansion of the market for skin cancer detection equipment. Educational efforts and initiatives by healthcare organisations and governments have aided in boosting public awareness. The global incidence of skin cancer has increased significantly during the last several decades. This rise has resulted in an increased need for skin cancer detection systems that are both effective and efficient.
Future Forecast for Skin Cancer Detection Devices Market Industry:
Looking ahead, the global skin cancer detection devices market industry is expected to rise at a CAGR of 11.9% from 2025 to 2035. During the forecast period, the market size is expected to reach USD 3133.8 billion by 2035.
The skin cancer detection devices market industry is expected to continue its growth trajectory from 2025 to 2035. Although very uncomfortable, skin biopsies are nonetheless a crucial technique for the early diagnosis of cancer.
There are currently around 30 benign lesions biopsied for every incidence of skin cancer that is discovered, thanks to intensive diagnostic efforts that have caused the number of biopsies to increase nearly four times more quickly than the number of tumors identified. A low-cost portable gadget that might reduce the number of unwanted biopsies in half and provide dermatologists and other front-line doctors with quick access to laboratory-grade cancer diagnoses is now being developed by researchers.
| Country | The United States |
|---|---|
| Market Size (USD million) by End of Forecast Period (2035) | USD 3133.8.0 million |
| CAGR % 2025 to End of Forecast (2035) | 11.4% |
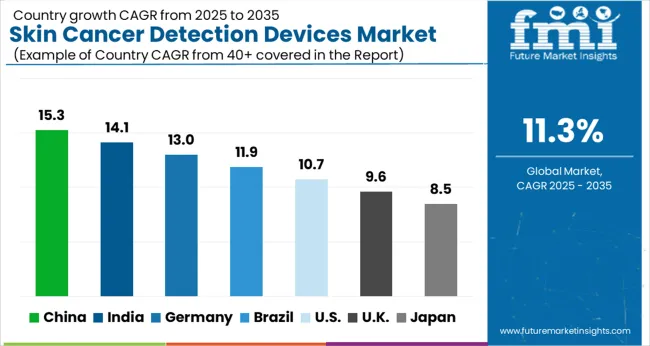
The skin cancer detection devices market industry in the United States is expected to reach a market size of USD 3133.8.0 million by 2035, expanding at a CAGR of 11.4%. Due to the increasing incidence of skin cancer nationwide the market is on the rise. According to the American Academy of Dermatology Association, melanoma is projected to be responsible for 7,650 fatalities in the US in 2025. The market for skin cancer detection equipment is in high demand due to the rising incidence of diabetes in the nation.
| Country | The United Kingdom |
|---|---|
| Market Size (USD million) by End of Forecast Period (2035) | USD 207.0 million |
| CAGR % 2025 to End of Forecast (2035) | 11.6% |
The skin cancer detection devices market industry in the United Kingdom is expected to reach a market share of USD 207.0 million, expanding at a CAGR of 11.6% during the forecast period. The United Kingdom market is projected to growth of the market due to the growing personalized medicine initiatives. In the United Kingdom, there has been a growing emphasis on improving early diagnosis and creating novel skin cancer detection technology. This has resulted in the development of equipment such as dermoscopes, mole mapping systems, and smartphone apps that help in the early detection of suspected skin lesions. As healthcare professionals and individuals become more proactive in screening for skin cancer, the need for these devices may continue to rise.
| Country | China |
|---|---|
| Market Size (USD million) by End of Forecast Period (2035) | USD 285.0 million |
| CAGR % 2025 to End of Forecast (2035) | 13.4% |
The skin cancer detection devices market industry in China is anticipated to reach a market size of USD 285.0 million, moving at a CAGR of 13.4% during the forecast period. The skin cancer detection devices market industry in China is expected to grow prominently due to the increasing awareness regarding skin cancer among people.
Skin cancer is also becoming an increasing problem in China as a result of factors such as changing lifestyles, increased UV radiation exposure, and an ageing population. Skin cancer detection technologies are becoming increasingly essential in China's healthcare scene as the government works to increase cancer diagnosis rates and provide early therapies.
| Country | Japan |
|---|---|
| Market Size (USD million) by End of Forecast Period (2035) | USD 105.0 million |
| CAGR % 2025 to End of Forecast (2035) | 11.2% |
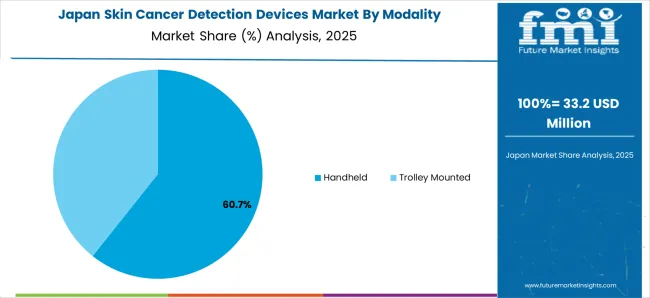
The skin cancer detection devices market industry in Japan is estimated to reach a market size of USD 105.0 million by 2035, thriving at a CAGR of 11.2%. The market in Japan is predicted to grow because of the growing technological advancements. Early detection and preventative care are highly valued in the Japanese healthcare system.
As a result, there has been increasing emphasis on the development and implementation of novel technologies for skin cancer screening and detection. In dermatological clinics and hospitals, dermoscopy instruments, digital imaging systems, and other modern technologies have been used to help in the identification and assessment of worrisome skin lesions.
| Country | South Korea |
|---|---|
| Market Size (USD million) by End of Forecast Period (2035) | USD 59.0 million |
| CAGR % 2025 to End of Forecast (2035) | 12.4% |
The skin cancer detection devices market industry in South Korea is expected to reach a market size of USD 59.0 million, expanding at a CAGR of 12.4% during the forecast period. Early identification and frequent screening for many forms of cancer are highly valued in South Korea.
Dermatology clinics and hospitals frequently use sophisticated imaging technology for skin cancer examination and diagnosis, such as dermoscopes and digital dermatoscopy systems.
The handheld devices is expected to dominate the skin cancer detection devices market industry with a market share of 54.3% in 2025. Due to its inexpensive portable device that might reduce the number of needless biopsies by half and provide dermatologists and other frontline doctors with simple access to laboratory-grade cancer diagnoses, this market category has a sizable market share in 2025.
There is an increasing need for portable devices since point-of-care tests offer a rapid turnaround time and are non-invasive, both of which have the potential to increase screening uptake.
The dermatology clinics is dominating the skin cancer detection devices market with the market share of 47.8% in 2025. Patients commonly visit specialty dermatological hospitals for rapid and efficient care, as the need for specialist dermatology treatments grows, fueling the segment's growth. Furthermore, due to the global increase in malignancies of the skin and melanoma incidence and the establishment of dermatology clinics, more people are seeking treatment and care at dermatological clinics.
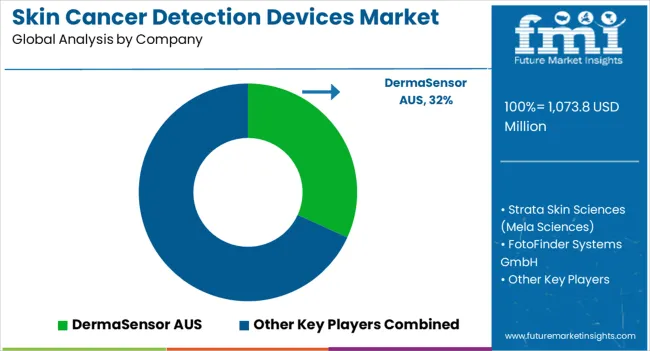
The skin cancer detection device sector is fiercely competitive, with many companies fighting for market dominance. To stay ahead of the competition in such a circumstance, essential players must employ smart techniques.
Key Strategies Used by the Participants
Product Development
To produce innovative goods that increase efficacy, dependability, and cost-effectiveness, businesses make significant investments in R&D. Product innovation enables companies to stand out from the competition while also meeting the shifting needs of their customers.
Strategic Alliances & Collaborations
Strategic alliances and partnerships with other businesses are regularly formed by major players in an industry to take advantage of each other's advantages and expand their market reach. Through such arrangements, businesses may also obtain access to new technologies and markets.
Expansion into Emerging Markets
The market for skin cancer detection devices is rising quickly in developing nations like China and India. To boost their presence in these regions, major companies are expanding their distribution networks and building regional manufacturing sites.
Acquisitions and mergers
Key companies in the skin cancer detection devices market routinely employ mergers and acquisitions to strengthen their market positions, broaden their product offerings, and enter new markets.
Key Developments in the Skin Cancer Detection Devices Market:
The global skin cancer detection devices market is estimated to be valued at USD 1,073.8 million in 2025.
The market size for the skin cancer detection devices market is projected to reach USD 3,133.8 million by 2035.
The skin cancer detection devices market is expected to grow at a 11.3% CAGR between 2025 and 2035.
The key product types in skin cancer detection devices market are handheld and trolley mounted.
In terms of end user, hospitals segment to command 53.2% share in the skin cancer detection devices market in 2025.


Our Research Products

The "Full Research Suite" delivers actionable market intel, deep dives on markets or technologies, so clients act faster, cut risk, and unlock growth.

The Leaderboard benchmarks and ranks top vendors, classifying them as Established Leaders, Leading Challengers, or Disruptors & Challengers.

Locates where complements amplify value and substitutes erode it, forecasting net impact by horizon

We deliver granular, decision-grade intel: market sizing, 5-year forecasts, pricing, adoption, usage, revenue, and operational KPIs—plus competitor tracking, regulation, and value chains—across 60 countries broadly.

Spot the shifts before they hit your P&L. We track inflection points, adoption curves, pricing moves, and ecosystem plays to show where demand is heading, why it is changing, and what to do next across high-growth markets and disruptive tech

Real-time reads of user behavior. We track shifting priorities, perceptions of today’s and next-gen services, and provider experience, then pace how fast tech moves from trial to adoption, blending buyer, consumer, and channel inputs with social signals (#WhySwitch, #UX).

Partner with our analyst team to build a custom report designed around your business priorities. From analysing market trends to assessing competitors or crafting bespoke datasets, we tailor insights to your needs.
Supplier Intelligence
Discovery & Profiling
Capacity & Footprint
Performance & Risk
Compliance & Governance
Commercial Readiness
Who Supplies Whom
Scorecards & Shortlists
Playbooks & Docs
Category Intelligence
Definition & Scope
Demand & Use Cases
Cost Drivers
Market Structure
Supply Chain Map
Trade & Policy
Operating Norms
Deliverables
Buyer Intelligence
Account Basics
Spend & Scope
Procurement Model
Vendor Requirements
Terms & Policies
Entry Strategy
Pain Points & Triggers
Outputs
Pricing Analysis
Benchmarks
Trends
Should-Cost
Indexation
Landed Cost
Commercial Terms
Deliverables
Brand Analysis
Positioning & Value Prop
Share & Presence
Customer Evidence
Go-to-Market
Digital & Reputation
Compliance & Trust
KPIs & Gaps
Outputs
Full Research Suite comprises of:
Market outlook & trends analysis
Interviews & case studies
Strategic recommendations
Vendor profiles & capabilities analysis
5-year forecasts
8 regions and 60+ country-level data splits
Market segment data splits
12 months of continuous data updates
DELIVERED AS:
PDF EXCEL ONLINE
Skin Care Devices Market Analysis - Trends & Forecast 2025 to 2035
Seizure Detection Devices Market
Arc Fault Detection Devices Market Size and Share Forecast Outlook 2025 to 2035
Portable Cancer Screen Devices Market Size and Share Forecast Outlook 2025 to 2035
Skin Perfusion Pressure Testing Devices Market Size and Share Forecast Outlook 2025 to 2035
Ultrasound Skin Tightening Devices Market Size and Share Forecast Outlook 2025 to 2035
Pressure Ulcer Detection Devices Market Trends – Growth & Forecast 2025 to 2035
Hand-held Breast Cancer Detection Market Analysis Size and Share Forecast Outlook 2025 to 2035
Molecular Biomarkers For Cancer Detection Market Size and Share Forecast Outlook 2025 to 2035
Skin Health Supplement Market Size, Share and Growth Forecast Outlook 2025 to 2035
Cancer Registry Software Market Size and Share Forecast Outlook 2025 to 2035
Skin Lightening Product Market Size and Share Forecast Outlook 2025 to 2035
Skincare Supplement Market Size and Share Forecast Outlook 2025 to 2035
Skin Tightening Device Market Size and Share Forecast Outlook 2025 to 2035
Skincare Oil Market Size and Share Forecast Outlook 2025 to 2035
Cancer Biological Therapy Market Size and Share Forecast Outlook 2025 to 2035
Skin-Barrier Strengthening Phospholipids Market Size and Share Forecast Outlook 2025 to 2035
Skin Toner Market Size and Share Forecast Outlook 2025 to 2035
Cancer Diagnostics Market Analysis - Size, Share and Forecast 2025 to 2035
Skincare Nutritional Serum Market Size and Share Forecast Outlook 2025 to 2035

Thank you!
You will receive an email from our Business Development Manager. Please be sure to check your SPAM/JUNK folder too.
Chat With
MaRIA