Reports
- Global Locations -
Headquarters
Future Market Insights, Inc.
Christiana Corporate, 200
Continental Drive, Suite 401,
Newark, Delaware - 19713,
United States
Americas
Future Market Insights, Inc.
616 Corporate Way, Suite 2-9018,
Valley Cottage, NY 10989, United States
MEA
Future Market Insights
1602-6 Jumeirah Bay X2 Tower, Plot No: JLT-PH2-X2A,
Jumeirah Lakes Towers, Dubai,
United Arab Emirates
Europe
Future Market Insights
3rd Floor, 207 Regent Street,
W1B 3HH London
United Kingdom
Asia Pacific
Future Market Insights
Office No. 401-A, 4th Floor,
VANTAGE 9, S.No. 36/1/1,
Baner, Pune 411045, India
The rising prevalence of peripheral artery disease and the increasing incidence of chronic limb ischemia has necessitated innovation in skin perfusion pressure testing devices. Chronic limb ischemia is the most advanced form of peripheral artery disease, and leads to mortality, morbidity, and high healthcare resource utilization. The assessment for wound healing in limb ischemia requires the skin perfusion pressure method for checking blood flow pressure in the limbs.
In its new study, ESOMAR-certified market research and consulting firm Future Market Insights (FMI) offers insights about key factors driving demand for skin perfusion pressure testing devices. The report tracks the global sales of skin perfusion pressure testing devices in 20+ high-growth markets, along with analyzing the impact COVID-19 has had on the medical device industry in general, and skin perfusion pressure testing devices in particular.
Don't pay for what you don't need
Customize your report by selecting specific countries or regions and save 30%!
Peripheral artery disease (PAD) is a progressive disorder affecting more than 200 million people, worldwide. It has a significant impact on mortality in hemodialysis patients. Approximately 6.5 million people aged 40 years and older in the United States have PAD. The increasing PAD population has propelled the growth of the skin perfusion pressure testing market.
Skin perfusion pressure has become a potential tool for wound healing in patients with chronic limb ischemia. Compared to other non-invasive methods such as toe blood pressure and ankle-brachial index, skin perfusion pressure provides more accurate results, thus, its usage is gaining popularity among physicians.
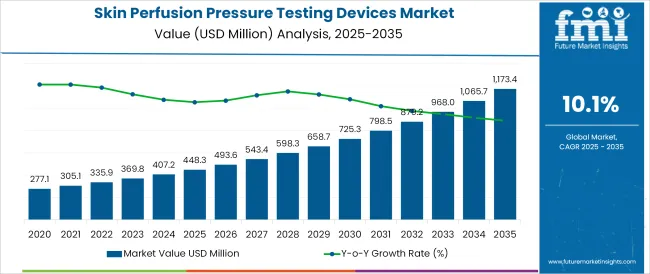
This technique also remains a clinically relevant and objective tool of local perfusion in the setting of chronic limb ischemia, particularly among higher-risk patients with arterial calicifications and comorbidities that tend to microvascular disease. FMI expects global skin perfusion pressure testing devices market to grow at 4.5% CAGR through 2030.
Non-invasive procedures have continued to grow in popularity as compared to surgeries. The measurement of skin perfusion pressure by a laser doppler is a non-invasive method that is widely used by professionals. Due to high reproducibility, accuracy, specificity, and sensitivity, skin perfusion pressure testing has become one of the soundest methods.
For instance, non-invasive VMS-VASC system (Moor) Instruments), including the laser Doppler monitor moorVMS-LDF, low profile fibre optic probe (VP-SPP), and pressure cuff controller moorVMS-PRES have been specifically designed to aid micro vascular assessments in a variety of clinical applications and physiological research.
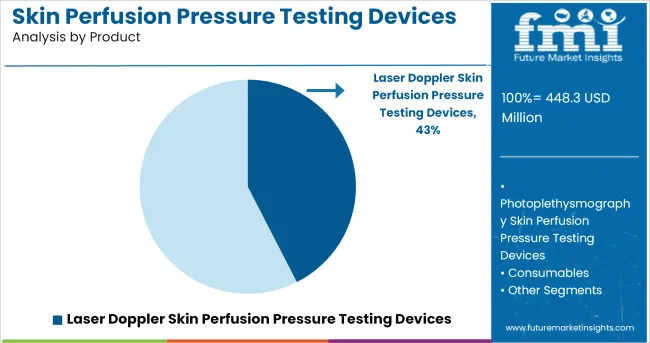
Laser dopplers have proven to be effective devices for the measurement of skin perfusion pressure. Laser dopplers are among the regularly utilized gadgets for the appraisal of skin perfusion pressure, they are seen as the ideal instrument for the location of peripheral artery disease as well as diagnosis of wound healing potential in limb ischemia patients.
Furthermore, the accuracy in a laser doppler is much higher than any other traditional method. The high accuracy, simplicity of operability and non-invasiveness feature of the devices are likely to fuel the utilization of laser dopplers by the physicians, boosting the demand of the skin perfusion testing devices.
Get the data you need at a Fraction of the cost
Personalize your report by choosing insights you need
and save 40%!
Due to an increase in the need for assessment of wound healing in peripheral artery disease and limb ischemia, many manufacturers are seeking 510(k) Premarket Notification to FDA which demonstrates the device to be safe and effective as equivalent to a legally-marketed device
For example, Perimed Inc. seeks 510(k) Premarket Notification for PeriFlux System 5000, which is a laser doppler system consisting of main units and functional units
However, according to FDA Modernization Act, devices that fall under class I and II are exempted from premarket approval, thus, the time required for regulatory approval is reduced, which brings down the costs. The increasing FDA approvals attracts the end users, and this expected to boost the demand for skin perfusion pressure testing devices.
Skin pressure perfusion is the most advanced method for the assessment of wound healing in limb ischemia and peripheral artery diseases. This method requires highly trained or skilled professionals to operate the device. Since it is fully-automated and provides quantitative evaluation of microcirculation, its operability requires skilled people, which as a result may limit the use of skin perfusion pressure testing devices.
Thus, reliability and reproducible measurement is highly dependent on a skilled technician or operator who interprets the results of skin perfusion pressure measurement. Lack of skilled professionals therefore can create significant challenges for the market.
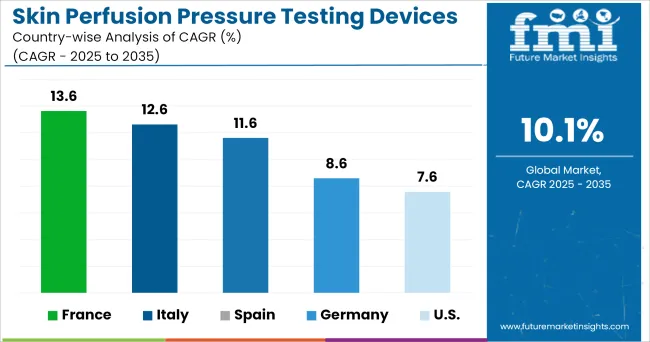
The healthcare system of the U.S. is well renowned for its advanced infrastructure and expenditure. The care regime of the care centers and hospitals are monitored by various regulatory rules and insurance policies. The massive hospital bills incurred other than the Medicare have been influencing the market in the country.
Government and regulatory bodies of the U.S. are adopting several cost-containment plans to reduce their healthcare burden. The shift from a volume to a value-based system is majorly driven by the various measures undertaken by providers, governments, biotechnology companies, and insurance payers. Some of the measures are outcome-based profits, pricing, risk sharing, competitive tendering, and price control.
A value-based healthcare system will not only provide improved outcomes through integrated care pathways, but also levy pricing pressure on medical device companies, and this is likely to impact investments on the R&D of advanced medical treatment technologies.
Furthermore, due to the higher prevalence of critical limb ischemia and peripheral arterial disease in U.S., several manufactures are conducting campaigns to raise general awareness among people related to these diseases. This is likely to support the overall market growth in the country. For example, Amputee Coalition of America (NGO) launched a campaign in April 2018 to raise limb loss awareness among people.
The Federal Statistical Office has reported that healthcare spending in Germany rose by 4% in 2018 from 2017. In 2018, the country’s healthcare spending accounted for 11.7% of the GDP. Furthermore, health expenditure was expected to surge to 407.4 billion Euros by 2019, presenting a lucrative landscape for the expansion of the skin perfusion pressure testing devices.
Also presence of companies such as ELCAT GmbH is supporting the expansion in Germany. The company has been investing significantly in expansion efforts. Growth strategies adopted by these companies are expected to aid the expansion in Germany.
Since 2009, health insurance has been made mandatory for all citizens of the country. According to National Center for Biotechnology Information (NCBI), a total of 70 million people, which roughly covers 85% of the population are covered by statutory health insurance. Another 11% population of Germany is covered by substitutive private health insurance. Conducive reimbursement policies and regulatory scenario are presenting attractive opportunities for growth.
Increasing disposable income can have significant impact in development of economy in emerging countries which results in affordability of proper healthcare treatment. China’s per capita disposable income reached (about 4,961 U.S. dollars) in 2020, more than double the level in 2010.
Potential for high healthcare insurance and rising disposable income will contribute to increase in affordability of healthcare services. This will also allow improved accessibility to expensive equipment for treatment of diseases. The market in China is expected to witness significant growth at a CAGR of around 5.4%.
Both chronic limb ischemia and peripheral artery disease impose serious threats to the population. Lack of awareness of diseases and lack of proper treatment leads to high prevalence of these diseases. Due to limited campaigning about the assessment of these diseases, there seems to occur less usage of these devices in hospitals in South Africa.
Moreover, poor healthcare facilities in some countries restrain the growth of the skin perfusion pressure testing market. Despite financial burden, government in South Africa is adopting various initiatives to spread create awareness among population, which is expected to enable steady growth in the market.
The market in South Africa is expected to witness sluggish growth at a CAGR of just around 3.8%.
Laser dopplers are widely used for skin perfusion pressure testing. Due to easy operability and noninvasiveness, most physicians opt for laser dopplers. Since laser dopplers are costly, manufacturers provide reimbursements for such devices.
However, the use of laser dopplers is not only limited to the measurement of skin perfusion pressure. These can be used in a wide range of testing parameters such as toe blood pressure (TBP), post occlusive reactive hyperaemia (PORH), ankle brachial pressure index (ABPI), and others.
For example, Moor Instrument’s new moorVMS-VASC 2.0 monitoring system is designed to test pulse volume recording (PVR) and other parameters apart from skin perfusion pressure.
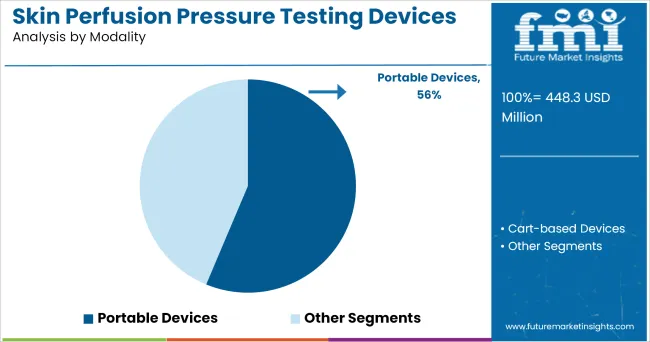
The portable devices segment will continue to grow and dominate the market during the forecast period. According to FMI, the segment is expected to hold around 73% of the market share, in terms of modality, by the end of 2030. A portable device is a wearable or hand-held device. This is designed for easy usage, to be able to move or carry it from one place to another, thus its ease of operability, makes the device most widely adopted devices in the market.
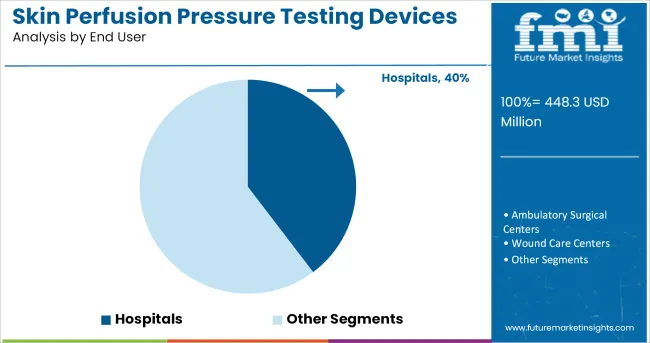
Hospitals have been dominating the market as key end users because it receives higher footfall of patients. Besides this, hospitals have more advanced infrastructure to support advance equipment. Backed by these factors, FMI forecasts hospitals to continue dominating the market and account for 34.7% of the overall share in 2021.
Most of the medical device companies are currently focusing on designing laser doppler since it has gain much popularity in assessment of wound healing.
For example, Moor Instruments has design moorVMS-VASC 2.0 laser doppler system.
Moreover, the manufactures are focusing on getting stamp of approvals for their product and also entering into partnership and collaboration agreement to expand their product portfolio in different countries globally.
For instance, in April 2016, Perimed AB announced FDA approval for PeriFlux 6000.
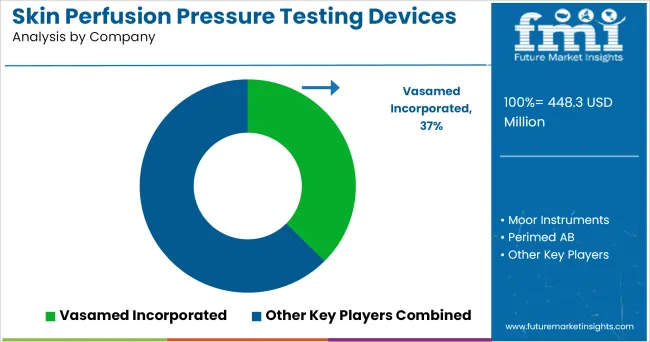
Some of the leading companies operating in the market are:
*The list is not exhaustive, and only for representational purposes. Full competitive intelligence with SWOT analysis available in the report.
Attribute | Details |
---|---|
Forecast Period | 2020-2030 |
Historical Data Available for | 2015-2019 |
Market Analysis | USD Million for Value |
Key Regions Covered | North America, Latin America, Europe, East Asia, South Asia, Oceania Middle East & Africa |
Key Countries Covered | US, Canada, Germany, U.K., France, Italy, Spain, Poland, Russia, China, Japan, South Korea, India, Thailand, Malaysia, Indonesia, Australia, New Zealand, GCC Countries, Turkey, Northern Africa, South Africa |
Key Segments Covered | Product Type, Modality, End User, and Region |
Key Companies Profiled |
|
Report Coverage | Market Forecast, Competition Intelligence, DROT Analysis, Market Dynamics and Challenges, Strategic Growth Initiatives |
Customization & Pricing | Available upon Request |
1. Executive Summary 1.1. Global Market Outlook 1.2. Demand Side Trends 1.3. Supply Side Trends 1.4. Analysis and Recommendations 2. Market Overview 2.1. Market Coverage / Taxonomy 2.2. Market Definition / Scope / Limitations 2.3. Inclusions and Exclusions 3. Key Market Trends 3.1. Key Trends Impacting the Market 3.2. Product Innovation / Development Trends 4. Key Success Factors 4.1. Product Adoption & Awareness Analysis 4.2. Product Features Vs. Modality Matrix 4.3. Key Strategies by Service Providers 4.4. Reimbursement Scenario 5. Market Background 5.1. Macro-Economic Factors 5.1.1. Global GDP Growth Outlook 5.1.2. Global Healthcare Outlook 5.2. Forecast Factors - Relevance & Impact 5.2.1. Shift towards non-invasive procedures 5.2.2. Increasing use of laser doppler 5.2.3. Growing incidences of chronic limb ischemia (CLI) 5.2.4. Rising demand for skin perfusion pressure (SPP) 5.3. Market Dynamics 5.3.1. Drivers 5.3.2. Restraints 5.3.3. Opportunities 6. COVID19 Crisis Impact Analysis 6.1. Current COVID-19 Statistics and Probable Future Impact 6.2. Current GDP Projection and Probable Impact 6.3. Current Economic Projection as compared to 2008 financial analysis 6.4. COVID19 and Impact Analysis 6.4.1. Revenue By Product Type 6.4.2. Revenue By Country 6.5. 2020 Market Scenario 6.6. Quarter by Quarter Forecast 6.7. Projected recovery Quarter 6.8. Recovery Scenario - Short term, Midterm and Long Term Impact 7. Global Skin Perfusion Pressure Testing Devices Market Value (US$ Mn) Analysis 2015-2019 and Forecast, 2020-2030 7.1. Historical Market Value (US$ Mn) Analysis, 2015-2019 7.2. Current and Future Market Value (US$ Mn) Projections, 2020-2030 7.2.1. Y-o-Y Growth Trend Analysis 7.2.2. Opportunity Analysis, 2020-2030 8. Global Skin Perfusion Pressure Testing Devices Market Analysis 2015-2019 and Forecast 2020-2030, By Product Type 8.1. Introduction / Key Findings 8.2. Historical Market Size (US$ Mn) Analysis By Product Type, 2015–2019 8.3. Current and Future Market Size (US$ Mn) Analysis and Forecast By Product Type, 2020-2030 8.3.1. Laser Doppler Skin Perfusion Pressure Testing Devices 8.3.2. Photoplethysmography Skin Perfusion Pressure Testing Devices 8.3.3. Consumables 8.3.3.1. Pressure Cuff Controller 8.3.3.2. Fibre Optic Probe 8.4. Market Attractiveness Analysis By Product Type 9. Global Skin Perfusion Pressure Testing Devices Market Analysis 2015-2019 and Forecast 2020-2030, By Modality 9.1. Introduction / Key Findings 9.2. Historical Market Size (US$ Mn) Analysis By Modality, 2015–2019 9.3. Current and Future Market Size (US$ Mn) Analysis and Forecast By Modality, 2020-2030 9.3.1. Portable Devices 9.3.2. Cart-based Devices 9.4. Market Attractiveness Analysis By Modality 10. Global Skin Perfusion Pressure Testing Devices Market Analysis 2015-2019 and Forecast 2020-2030, by End User 10.1. Introduction / Key Findings 10.2. Historical Market Size (US$ Mn) Analysis By End User, 2015–2019 10.3. Current and Future Market Size (US$ Mn) Analysis and Forecast By End User, 2020-2030 10.3.1. Hospitals 10.3.2. Ambulatory Surgical Centers 10.3.3. Wound Care Centers 10.3.4. Vascular Laboratory 10.4. Market Attractiveness Analysis By End User 11. Global Skin Perfusion Pressure Testing Devices Market Analysis 2015-2019 and Forecast 2020-2030, by Region 11.1. Introduction / Key Findings 11.2. Historical Market Size (US$ Mn) Analysis By Region, 2015–2019 11.3. Current and Future Market Size (US$ Mn) Analysis and Forecast By Region, 2020-2030 11.3.1. North America 11.3.2. Latin America 11.3.3. Europe 11.3.4. East Asia 11.3.5. South Asia 11.3.6. Oceania 11.3.7. Middle East and Africa 11.4. Market Attractiveness Analysis By Region 12. North America Skin Perfusion Pressure Testing Devices Market Analysis 2015-2019 and Forecast 2020-2030 12.1. Introduction 12.2. Historical Market Size (US$ Mn) Analysis By Market Taxonomy, 2015–2019 12.3. Current and Future Market Size (US$ Mn) Analysis and Forecast By Market Taxonomy, 2020-2030 12.3.1. By Country 12.3.1.1. U.S. 12.3.1.2. Canada 12.3.2. By Product Type 12.3.3. By Modality 12.3.4. By End User 12.4. Market Attractiveness Analysis 12.5. Key Market Participants - Intensity Mapping 12.6. Drivers and Restraints - Impact Analysis 13. Latin America Skin Perfusion Pressure Testing Devices Market Analysis 2015-2019 and Forecast 2020-2030 13.1. Introduction 13.2. Historical Market Size (US$ Mn) Analysis By Market Taxonomy, 2015–2019 13.3. Current and Future Market Size (US$ Mn) Analysis and Forecast By Market Taxonomy, 2020-2030 13.3.1. By Country 13.3.1.1. Brazil 13.3.1.2. Mexico 13.3.1.3. Argentina 13.3.1.4. Rest of Latin America 13.3.2. By Product Type 13.3.3. By Modality 13.3.4. By End User 13.4. Market Attractiveness Analysis 13.5. Key Market Participants - Intensity Mapping 13.6. Drivers and Restraints - Impact Analysis 14. Europe Skin Perfusion Pressure Testing Devices Market Analysis 2015-2019 and Forecast 2020-2030 14.1. Introduction 14.2. Historical Market Size (US$ Mn) Analysis By Market Taxonomy, 2015–2019 14.3. Current and Future Market Size (US$ Mn) Analysis and Forecast By Market Taxonomy, 2020-2030 14.3.1. By Country 14.3.1.1. Germany 14.3.1.2. Italy 14.3.1.3. France 14.3.1.4. U.K. 14.3.1.5. Spain 14.3.1.6. BENELUX 14.3.1.7. Russia 14.3.1.8. Rest of Europe 14.3.2. By Product Type 14.3.3. By Modality 14.3.4. By End User 14.4. Market Attractiveness Analysis 14.5. Key Market Participants - Intensity Mapping 14.6. Drivers and Restraints - Impact Analysis 15. South Asia Skin Perfusion Pressure Testing Devices Market Analysis 2015-2019 and Forecast 2020-2030 15.1. Introduction 15.2. Historical Market Size (US$ Mn) Analysis By Market Taxonomy, 2015–2019 15.3. Current and Future Market Size (US$ Mn) Analysis and Forecast By Market Taxonomy, 2020-2030 15.3.1. By Country 15.3.1.1. India 15.3.1.2. Thailand 15.3.1.3. Indonesia 15.3.1.4. Malaysia 15.3.1.5. Rest of South Asia 15.3.2. By Product Type 15.3.3. By Modality 15.3.4. By End User 15.4. Market Attractiveness Analysis 15.5. Key Market Participants - Intensity Mapping 15.6. Drivers and Restraints - Impact Analysis 16. East Asia Skin Perfusion Pressure Testing Devices Market Analysis 2015-2019 and Forecast 2020-2030 16.1. Introduction 16.2. Historical Market Size (US$ Mn) Analysis By Market Taxonomy, 2015–2019 16.3. Current and Future Market Size (US$ Mn) Analysis and Forecast By Market Taxonomy, 2020-2030 16.3.1. By Country 16.3.1.1. China 16.3.1.2. Japan 16.3.1.3. South Korea 16.3.2. By Product Type 16.3.3. By Modality 16.3.4. By End User 16.4. Market Attractiveness Analysis 16.5. Key Market Participants - Intensity Mapping 16.6. Drivers and Restraints - Impact Analysis 17. Oceania Skin Perfusion Pressure Testing Devices Market Analysis 2015-2019 and Forecast 2020-2030 17.1. Introduction 17.2. Historical Market Size (US$ Mn) Analysis By Market Taxonomy, 2015–2019 17.3. Current and Future Market Size (US$ Mn) Analysis and Forecast By Market Taxonomy, 2020-2030 17.3.1. By Country 17.3.1.1. Australia 17.3.1.2. New Zealand 17.3.2. By Product Type 17.3.3. By Modality 17.3.4. By End User 17.4. Market Attractiveness Analysis 17.5. Key Market Participants - Intensity Mapping 17.6. Drivers and Restraints - Impact Analysis 18. Middle East and Africa Skin Perfusion Pressure Testing Devices Market Analysis 2015-2019 and Forecast 2020-2030 18.1. Introduction 18.2. Historical Market Size (US$ Mn) Analysis By Market Taxonomy, 2015–2019 18.3. Current and Future Market Size (US$ Mn) Analysis and Forecast By Market Taxonomy, 2020-2030 18.3.1. By Country 18.3.1.1. GCC Countries 18.3.1.2. Turkey 18.3.1.3. South Africa 18.3.1.4. Rest of Middle East and Africa 18.3.2. By Product Type 18.3.3. By Modality 18.3.4. By End User 18.4. Market Attractiveness Analysis 18.5. Key Market Participants - Intensity Mapping 18.6. Drivers and Restraints - Impact Analysis 19. Key and Emerging Countries Skin Perfusion Pressure Testing Devices Market Analysis 2015-2019 and Forecast 2020-2030 19.1. Introduction 19.1.1. Market Value Proportion Analysis, By Key Countries 19.1.2. Global Vs. Country Growth Comparison 19.2. U.S. Skin Perfusion Pressure Testing Devices Market Analysis 19.2.1. By Product Type 19.2.2. By Modality 19.2.3. By End User 19.3. Canada Skin Perfusion Pressure Testing Devices Market Analysis 19.3.1. By Product Type 19.3.2. By Modality 19.3.3. By End User 19.4. Mexico Skin Perfusion Pressure Testing Devices Market Analysis 19.4.1. By Product Type 19.4.2. By Modality 19.4.3. By End User 19.5. Brazil Skin Perfusion Pressure Testing Devices Market Analysis 19.5.1. By Product Type 19.5.2. By Modality 19.5.3. By End User 19.6. U.K. Skin Perfusion Pressure Testing Devices Market Analysis 19.6.1. By Product Type 19.6.2. By Modality 19.6.3. By End User 19.7. Germany Skin Perfusion Pressure Testing Devices Market Analysis 19.7.1. By Product Type 19.7.2. By Modality 19.7.3. By End User 19.8. France Skin Perfusion Pressure Testing Devices Market Analysis 19.8.1. By Product Type 19.8.2. By Modality 19.8.3. By End User 19.9. Italy Skin Perfusion Pressure Testing Devices Market Analysis 19.9.1. By Product Type 19.9.2. By Modality 19.9.3. By End User 19.10. Spain Skin Perfusion Pressure Testing Devices Market Analysis 19.10.1. By Product Type 19.10.2. By Modality 19.10.3. By End User 19.11. BENELUX Skin Perfusion Pressure Testing Devices Market Analysis 19.11.1. By Product Type 19.11.2. By Modality 19.11.3. By End User 19.12. Russia Skin Perfusion Pressure Testing Devices Market Analysis 19.12.1. By Product Type 19.12.2. By Modality 19.12.3. By End User 19.13. China Skin Perfusion Pressure Testing Devices Market Analysis 19.13.1. By Product Type 19.13.2. By Modality 19.13.3. By End User 19.14. Japan Skin Perfusion Pressure Testing Devices Market Analysis 19.14.1. By Product Type 19.14.2. By Modality 19.14.3. By End User 19.15. South Korea Skin Perfusion Pressure Testing Devices Market Analysis 19.15.1. By Product Type 19.15.2. By Modality 19.15.3. By End User 19.16. India Skin Perfusion Pressure Testing Devices Market Analysis 19.16.1. By Product Type 19.16.2. By Modality 19.16.3. By End User 19.17. ASEAN Skin Perfusion Pressure Testing Devices Market Analysis 19.17.1. By Product Type 19.17.2. By Modality 19.17.3. By End User 19.18. Australia Skin Perfusion Pressure Testing Devices Market Analysis 19.18.1. By Product Type 19.18.2. By Modality 19.18.3. By End User 19.19. New Zealand Skin Perfusion Pressure Testing Devices Market Analysis 19.19.1. By Product Type 19.19.2. By Modality 19.19.3. By End User 19.20. GCC Countries Skin Perfusion Pressure Testing Devices Market Analysis 19.20.1. By Product Type 19.20.2. By Modality 19.20.3. By End User 19.21. Turkey Skin Perfusion Pressure Testing Devices Market Analysis 19.21.1. By Product Type 19.21.2. By Modality 19.21.3. By End User 19.22. South Africa Skin Perfusion Pressure Testing Devices Market Analysis 19.22.1. By Product Type 19.22.2. By Modality 19.22.3. By End User 20. Market Structure Analysis 20.1. Market Analysis by Tier of Companies 20.2. Market Share Analysis of Top Players 20.3. Market Presence Analysis 20.3.1. Regional Footprint by Players 20.3.2. Product Foot print by Players 20.3.3. Channel Foot Print by Players 21. Competition Analysis 21.1. Competition Dashboard 21.2. Competition Benchmarking 21.3. Competition Deep Dive (Tentative List) 21.3.1. Vasamed Incorporated 21.3.1.1. Overview 21.3.1.2. Product Portfolio 21.3.1.3. Profitability by Market Segments (Product/Channel/Region) 21.3.1.4. Sales Footprint 21.3.1.5. Strategy Overview 21.3.1.5.1. Marketing Strategy 21.3.1.5.2. Product Strategy 21.3.1.5.3. Channel Strategy 21.3.2. Moor Instruments 21.3.2.1. Overview 21.3.2.2. Product Portfolio 21.3.2.3. Profitability by Market Segments (Product/Channel/Region) 21.3.2.4. Sales Footprint 21.3.2.5. Strategy Overview 21.3.2.5.1. Marketing Strategy 21.3.2.5.2. Product Strategy 21.3.2.5.3. Channel Strategy 21.3.3. Perimed AB 21.3.3.1. Overview 21.3.3.2. Product Portfolio 21.3.3.3. Profitability by Market Segments (Product/Channel/Region) 21.3.3.4. Sales Footprint 21.3.3.5. Strategy Overview 21.3.3.5.1. Marketing Strategy 21.3.3.5.2. Product Strategy 21.3.3.5.3. Channel Strategy 21.3.4. ELCAT GmbH 21.3.4.1. Overview 21.3.4.2. Product Portfolio 21.3.4.3. Profitability by Market Segments (Product/Channel/Region) 21.3.4.4. Sales Footprint 21.3.4.5. Strategy Overview 21.3.4.5.1. Marketing Strategy 21.3.4.5.2. Product Strategy 21.3.4.5.3. Channel Strategy 21.3.5. ATYS Medical 21.3.5.1. Overview 21.3.5.2. Product Portfolio 21.3.5.3. Profitability by Market Segments (Product/Channel/Region) 21.3.5.4. Sales Footprint 21.3.5.5. Strategy Overview 21.3.5.5.1. Marketing Strategy 21.3.5.5.2. Product Strategy 21.3.5.5.3. Channel Strategy 21.3.6. Viasonix 21.3.6.1. Overview 21.3.6.2. Product Portfolio 21.3.6.3. Profitability by Market Segments (Product/Channel/Region) 21.3.6.4. Sales Footprint 21.3.6.5. Strategy Overview 21.3.6.5.1. Marketing Strategy 21.3.6.5.2. Product Strategy 21.3.6.5.3. Channel Strategy 21.3.7. Promed Group 21.3.7.1. Overview 21.3.7.2. Product Portfolio 21.3.7.3. Profitability by Market Segments (Product/Channel/Region) 21.3.7.4. Sales Footprint 21.3.7.5. Strategy Overview 21.3.7.5.1. Marketing Strategy 21.3.7.5.2. Product Strategy 21.3.7.5.3. Channel Strategy
Don't pay for what you don't need
Customize your report by selecting specific countries or regions and save 30%!
Table 01: Global Skin Perfusion Pressure Testing Devices Market Value (US$ Mn) Analysis 2015–2019 and Forecast 2020–2030, by Product Type Table 02: Global Skin Perfusion Pressure Testing Devices Market Value (US$ Mn) Analysis 2015–2019 and Forecast 2020–2030, by Modality Table 03: Global Skin Perfusion Pressure Testing Devices Market Value (US$ Mn) Analysis 2015–2019 and Forecast 2020–2030, by End User Table 04: Global Skin Perfusion Pressure Testing Devices Market Value (US$ Mn) Analysis 2015–2019 and Forecast 2020–2030, by Region Table 05: North America Skin Perfusion Pressure Testing Devices Market Value (US$ Mn) Analysis 2015–2019 and Forecast 2020–2030, by Country Table 06: North America Skin Perfusion Pressure Testing Devices Market Value (US$ Mn) Analysis 2015–2019 and Forecast 2020–2030, by Product Type Table 07: North America Skin Perfusion Pressure Testing Devices Market Value (US$ Mn) Analysis 2015–2019 and Forecast 2020–2030, by Modality Table 08: North America Skin Perfusion Pressure Testing Devices Market Value (US$ Mn) Analysis 2015–2019 and Forecast 2020–2030, by End User Table 09: Latin America Skin Perfusion Pressure Testing Devices Market Value (US$ Mn) Analysis 2015–2019 and Forecast 2020–2030, by Country Table 10: Latin America Skin Perfusion Pressure Testing Devices Market Value (US$ Mn) Analysis 2015–2019 and Forecast 2020–2030, by Product Type Table 11: Latin America Skin Perfusion Pressure Testing Devices Market Value (US$ Mn) Analysis 2015–2019 and Forecast 2020–2030, by Modality Table 12: Latin America Skin Perfusion Pressure Testing Devices Market Value (US$ Mn) Analysis 2015–2019 and Forecast 2020–2030, by End User Table 13: Europe Skin Perfusion Pressure Testing Devices Market Value (US$ Mn) Analysis 2015–2019 and Forecast 2020–2030, by Country Table 14: Europe Skin Perfusion Pressure Testing Devices Market Value (US$ Mn) Analysis 2015–2019 and Forecast 2020–2030, by Product Type Table 15: Europe Skin Perfusion Pressure Testing Devices Market Value (US$ Mn) Analysis 2015–2019 and Forecast 2020–2030, by Modality Table 16: Europe Skin Perfusion Pressure Testing Devices Market Value (US$ Mn) Analysis 2015–2019 and Forecast 2020–2030, by End User Table 17: South Asia Skin Perfusion Pressure Testing Devices Market Value (US$ Mn) Analysis 2015–2019 and Forecast 2020–2030, by Country Table 18: South Asia Skin Perfusion Pressure Testing Devices Market Value (US$ Mn) Analysis 2015–2019 and Forecast 2020–2030, by Product Type Table 19: South Asia Skin Perfusion Pressure Testing Devices Market Value (US$ Mn) Analysis 2015–2019 and Forecast 2020–2030, by Modality Table 20: South Asia Skin Perfusion Pressure Testing Devices Market Value (US$ Mn) Analysis 2015–2019 and Forecast 2020–2030, by End User Table 21: East Asia Skin Perfusion Pressure Testing Devices Market Value (US$ Mn) Analysis 2015–2019 and Forecast 2020–2030, by Country Table 22: East Asia Skin Perfusion Pressure Testing Devices Market Value (US$ Mn) Analysis 2015–2019 and Forecast 2020–2030, by Product Type Table 23: East Asia Skin Perfusion Pressure Testing Devices Market Value (US$ Mn) Analysis 2015–2019 and Forecast 2020–2030, by Modality Table 24: East Asia Skin Perfusion Pressure Testing Devices Market Value (US$ Mn) Analysis 2015–2019 and Forecast 2020–2030, by End User Table 25: Oceania Skin Perfusion Pressure Testing Devices Market Value (US$ Mn) Analysis 2015–2019 and Forecast 2020–2030, by Country Table 26: Oceania Skin Perfusion Pressure Testing Devices Market Value (US$ Mn) Analysis 2015–2019 and Forecast 2020–2030, by Product Type Table 27: Oceania Skin Perfusion Pressure Testing Devices Market Value (US$ Mn) Analysis 2015–2019 and Forecast 2020–2030, by Modality Table 28: Oceania Skin Perfusion Pressure Testing Devices Market Value (US$ Mn) Analysis 2015–2019 and Forecast 2020–2030, by End User Table 29: MEA Skin Perfusion Pressure Testing Devices Market Value (US$ Mn) Analysis 2015–2019 and Forecast 2020–2030, by Country Table 30: MEA Skin Perfusion Pressure Testing Devices Market Value (US$ Mn) Analysis 2015–2019 and Forecast 2020–2030, by Product Type Table 31: MEA Skin Perfusion Pressure Testing Devices Market Value (US$ Mn) Analysis 2015–2019 and Forecast 2020–2030, by Modality Table 32: MEA Skin Perfusion Pressure Testing Devices Market Value (US$ Mn) Analysis 2015–2019 and Forecast 2020–2030, by End User
Figure 01: Skin Perfusion Pressure Testing Devices Market Value Analysis and Forecast 2020 – 2030 (US$ Mn) Figure 02: Skin Perfusion Pressure Testing Devices Market Absolute $ Opportunity (US$ Mn), 2020–2030 Figure 03: Global Skin Perfusion Pressure Testing Devices Market Share Analysis (%) by Product Type, 2020 & 2030 Figure 04: Global Skin Perfusion Pressure Testing Devices Market Y-o-Y Growth (%) by, 2021–2030 Figure 05: Global Skin Perfusion Pressure Testing Devices Market Attractiveness Analysis by Product Type, 2020–2030 Figure 06: Global Skin Perfusion Pressure Testing Devices Market Share Analysis (%) by Modality, 2020 & 2030 Figure 07: Global Skin Perfusion Pressure Testing Devices Market Y-o-Y Growth (%) by Modality, 2021–2030 Figure 08: Global Skin Perfusion Pressure Testing Devices Market Attractiveness Analysis by Modality, 2020–2030 Figure 09: Global Skin Perfusion Pressure Testing Devices Market Share Analysis (%) by End User, 2020 & 2030 Figure 10: Global Skin Perfusion Pressure Testing Devices Market Y-o-Y Growth (%) by End User, 2021–2030 Figure 11: Global Skin Perfusion Pressure Testing Devices Market Attractiveness Analysis by End User, 2020–2030 Figure 12: Global Skin Perfusion Pressure Testing Devices Market Share Analysis (%) by Region, 2020 & 2030 Figure 13: Global Skin Perfusion Pressure Testing Devices Market Y-o-Y Growth (%) by Region, 2021–2030 Figure 14: Global Skin Perfusion Pressure Testing Devices Market Attractiveness Analysis by Region, 2020–2030 Figure 15: North America Skin Perfusion Pressure Testing Devices Market Value Share, By Product Type, 2020 (E) Figure 16: North America Skin Perfusion Pressure Testing Devices Market Value Share, By Modality, 2020 (E) Figure 17: North America Skin Perfusion Pressure Testing Devices Market Value Share, By End User, 2020 (E) Figure 18: North America Skin Perfusion Pressure Testing Devices Market Value Share, By Country, 2020 (E) Figure 19: North America Skin Perfusion Pressure Testing Devices Market Value (US$ Mn), 2015 – 2019 Figure 20: North America Skin Perfusion Pressure Testing Devices Market Value (US$ Mn) Forecast, 2019–2030 Figure 21: North America Skin Perfusion Pressure Testing Devices Market Attractiveness Analysis by Product Type, 2020–2030 Figure 22: North America Skin Perfusion Pressure Testing Devices Market Attractiveness Analysis by Modality, 2020–2030 Figure 23: North America Skin Perfusion Pressure Testing Devices Market Attractiveness Analysis by End User, 2020–2030 Figure 24: North America Skin Perfusion Pressure Testing Devices Market Attractiveness Analysis by Country, 2020–2030 Figure 25: Latin America Skin Perfusion Pressure Testing Devices Market Value Share, By Product Type, 2020 (E) Figure 26: Latin America Skin Perfusion Pressure Testing Devices Market Value Share, By Modality, 2020 (E) Figure 27: Latin America Skin Perfusion Pressure Testing Devices Market Value Share, By End User, 2020 (E) Figure 28: Latin America Skin Perfusion Pressure Testing Devices Market Value Share, By Country, 2020 (E) Figure 29: Latin America Skin Perfusion Pressure Testing Devices Market Value (US$ Mn), 2015 – 2019 Figure 30: Latin America Skin Perfusion Pressure Testing Devices Market Value (US$ Mn) Forecast, 2019–2030 Figure 31: Latin America Skin Perfusion Pressure Testing Devices Market Attractiveness Analysis by Product Type, 2020–2030 Figure 32: Latin America Skin Perfusion Pressure Testing Devices Market Attractiveness Analysis by Modality, 2020–2030 Figure 33: Latin America Skin Perfusion Pressure Testing Devices Market Attractiveness Analysis by End User, 2020–2030 Figure 34: Latin America Skin Perfusion Pressure Testing Devices Market Attractiveness Analysis by Country, 2020–2030 Figure 35: Europe Skin Perfusion Pressure Testing Devices Market Value Share, By Product Type, 2020 (E) Figure 36: Europe Skin Perfusion Pressure Testing Devices Market Value Share, By Modality, 2020 (E) Figure 37: Europe Skin Perfusion Pressure Testing Devices Market Value Share, By End User, 2020 (E) Figure 38: Europe Skin Perfusion Pressure Testing Devices Market Value Share, By Country, 2020 (E) Figure 39: Europe Skin Perfusion Pressure Testing Devices Market Value (US$ Mn), 2015 – 2019 Figure 40: Europe Skin Perfusion Pressure Testing Devices Market Value (US$ Mn) Forecast, 2019–2030 Figure 41: Europe Skin Perfusion Pressure Testing Devices Market Attractiveness Analysis by Product Type, 2020–2030 Figure 42: Europe Skin Perfusion Pressure Testing Devices Market Attractiveness Analysis by Modality, 2020–2030 Figure 43: Europe Skin Perfusion Pressure Testing Devices Market Attractiveness Analysis by End User, 2020–2030 Figure 44: Europe Skin Perfusion Pressure Testing Devices Market Attractiveness Analysis by Country, 2020–2030 Figure 45: South Asia Skin Perfusion Pressure Testing Devices Market Value Share, By Product Type, 2020 (E) Figure 46: South Asia Skin Perfusion Pressure Testing Devices Market Value Share, By Modality, 2020 (E) Figure 47: South Asia Skin Perfusion Pressure Testing Devices Market Value Share, By End User, 2020 (E) Figure 48: South Asia Skin Perfusion Pressure Testing Devices Market Value Share, By Country, 2020 (E) Figure 49: South Asia Skin Perfusion Pressure Testing Devices Market Value (US$ Mn), 2015 – 2019 Figure 50: South Asia Skin Perfusion Pressure Testing Devices Market Value (US$ Mn) Forecast, 2019–2030 Figure 51: South Asia Skin Perfusion Pressure Testing Devices Market Attractiveness Analysis by Product Type, 2020–2030 Figure 52: South Asia Skin Perfusion Pressure Testing Devices Market Attractiveness Analysis by Modality, 2020–2030 Figure 53: South Asia Skin Perfusion Pressure Testing Devices Market Attractiveness Analysis by End User, 2020–2030 Figure 54: South Asia Skin Perfusion Pressure Testing Devices Market Attractiveness Analysis by Country, 2020–2030 Figure 55: East Asia Skin Perfusion Pressure Testing Devices Market Value Share, By Product Type, 2020 (E) Figure 56: East Asia Skin Perfusion Pressure Testing Devices Market Value Share, By Modality, 2020 (E) Figure 57: East Asia Skin Perfusion Pressure Testing Devices Market Value Share, By End User, 2020 (E) Figure 58: East Asia Skin Perfusion Pressure Testing Devices Market Value Share, By Country, 2020 (E) Figure 59: East Asia Skin Perfusion Pressure Testing Devices Market Value (US$ Mn), 2015 – 2019 Figure 60: East Asia Skin Perfusion Pressure Testing Devices Market Value (US$ Mn) Forecast, 2019–2030 Figure 61: East Asia Skin Perfusion Pressure Testing Devices Market Attractiveness Analysis by Product Type, 2020–2030 Figure 62: East Asia Skin Perfusion Pressure Testing Devices Market Attractiveness Analysis by Modality, 2020–2030 Figure 63: East Asia Skin Perfusion Pressure Testing Devices Market Attractiveness Analysis by End User, 2020–2030 Figure 64: East Asia Skin Perfusion Pressure Testing Devices Market Attractiveness Analysis by Country, 2020–2030 Figure 65: Oceania Skin Perfusion Pressure Testing Devices Market Value Share, By Product Type, 2020 (E) Figure 66: Oceania Skin Perfusion Pressure Testing Devices Market Value Share, By Modality, 2020 (E) Figure 67: Oceania Skin Perfusion Pressure Testing Devices Market Value Share, By End User, 2020 (E) Figure 68: Oceania Skin Perfusion Pressure Testing Devices Market Value Share, By Country, 2020 (E) Figure 69: Oceania Skin Perfusion Pressure Testing Devices Market Value (US$ Mn), 2015 – 2019 Figure 70: Oceania Skin Perfusion Pressure Testing Devices Market Value (US$ Mn) Forecast, 2019–2030 Figure 71: Oceania Skin Perfusion Pressure Testing Devices Market Attractiveness Analysis by Product Type, 2020–2030 Figure 72: Oceania Skin Perfusion Pressure Testing Devices Market Attractiveness Analysis by Modality, 2020–2030 Figure 73: Oceania Skin Perfusion Pressure Testing Devices Market Attractiveness Analysis by End User, 2020–2030 Figure 74: Oceania Skin Perfusion Pressure Testing Devices Market Attractiveness Analysis by Country, 2020–2030 Figure 75: MEA Skin Perfusion Pressure Testing Devices Market Value Share, By Product Type, 2020 (E) Figure 76: MEA Skin Perfusion Pressure Testing Devices Market Value Share, By Modality, 2020 (E) Figure 77: MEA Skin Perfusion Pressure Testing Devices Market Value Share, By End User, 2020 (E) Figure 78: MEA Skin Perfusion Pressure Testing Devices Market Value Share, By Country, 2020 (E) Figure 79: MEA Skin Perfusion Pressure Testing Devices Market Value (US$ Mn), 2015 – 2019 Figure 80: MEA Skin Perfusion Pressure Testing Devices Market Value (US$ Mn) Forecast, 2019–2030 Figure 81: MEA Skin Perfusion Pressure Testing Devices Market Attractiveness Analysis by Product Type, 2020–2030 Figure 82: MEA Skin Perfusion Pressure Testing Devices Market Attractiveness Analysis by Modality, 2020–2030 Figure 83: MEA Skin Perfusion Pressure Testing Devices Market Attractiveness Analysis by End User, 2020–2030 Figure 84: MEA Skin Perfusion Pressure Testing Devices Market Attractiveness Analysis by Country, 2020–2030 Figure 85: U.S. Skin Perfusion Pressure Testing Devices Market Value Analysis (US$ Mn), 2020 & 2030 Figure 86: U.S. Skin Perfusion Pressure Testing Devices Market Value Share, Product, 2020 & 2030 Figure 87: U.S. Skin Perfusion Pressure Testing Devices Market Value Share, By Modality, 2020 & 2030 Figure 88: U.S. Skin Perfusion Pressure Testing Devices Market Value Share, By End User, 2020 & 2030 Figure 89: Canada Skin Perfusion Pressure Testing Devices Market Value Analysis (US$ Mn), 2020 & 2030 Figure 90: Canada Skin Perfusion Pressure Testing Devices Market Value Share, Product, 2020 & 2030 Figure 91: Canada Skin Perfusion Pressure Testing Devices Market Value Share, By Modality, 2020 & 2030 Figure 92: Canada Skin Perfusion Pressure Testing Devices Market Value Share, By End User, 2020 & 2030 Figure 93: Brazil Skin Perfusion Pressure Testing Devices Market Value Analysis (US$ Mn), 2020 & 2030 Figure 94: Brazil Skin Perfusion Pressure Testing Devices Market Value Share, Product, 2020 & 2030 Figure 95: Brazil Skin Perfusion Pressure Testing Devices Market Value Share, By Modality, 2020 & 2030 Figure 96: Brazil Skin Perfusion Pressure Testing Devices Market Value Share, By End User, 2020 & 2030 Figure 97: Mexico Skin Perfusion Pressure Testing Devices Market Value Analysis (US$ Mn), 2020 & 2030 Figure 98: Mexico Skin Perfusion Pressure Testing Devices Market Value Share, Product, 2020 & 2030 Figure 99: Mexico Skin Perfusion Pressure Testing Devices Market Value Share, By Modality, 2020 & 2030 Figure 100: Mexico Skin Perfusion Pressure Testing Devices Market Value Share, By End User, 2020 & 2030 Figure 101: Argentina Skin Perfusion Pressure Testing Devices Market Value Analysis (US$ Mn), 2020 & 2030 Figure 102: Argentina Skin Perfusion Pressure Testing Devices Market Value Share, Product, 2020 & 2030 Figure 103: Argentina Skin Perfusion Pressure Testing Devices Market Value Share, By Modality, 2020 & 2030 Figure 104: Argentina Skin Perfusion Pressure Testing Devices Market Value Share, By End User, 2020 & 2030 Figure 105: Germany Skin Perfusion Pressure Testing Devices Market Value Analysis (US$ Mn), 2020 & 2030 Figure 106: Germany Skin Perfusion Pressure Testing Devices Market Value Share, Product, 2020 & 2030 Figure 107: Germany Skin Perfusion Pressure Testing Devices Market Value Share, By Modality, 2020 & 2030 Figure 108: Germany Skin Perfusion Pressure Testing Devices Market Value Share, By End User, 2020 & 2030 Figure 109: U.K. Skin Perfusion Pressure Testing Devices Market Value Analysis (US$ Mn), 2020 & 2030 Figure 110: U.K. Skin Perfusion Pressure Testing Devices Market Value Share, Product, 2020 & 2030 Figure 111: U.K. Skin Perfusion Pressure Testing Devices Market Value Share, By Modality, 2020 & 2030 Figure 112: U.K. Skin Perfusion Pressure Testing Devices Market Value Share, By End User, 2020 & 2030 Figure 113: France Skin Perfusion Pressure Testing Devices Market Value Analysis (US$ Mn), 2020 & 2030 Figure 114: France Skin Perfusion Pressure Testing Devices Market Value Share, Product, 2020 & 2030 Figure 115: France Skin Perfusion Pressure Testing Devices Market Value Share, By Modality, 2020 & 2030 Figure 116: France Skin Perfusion Pressure Testing Devices Market Value Share, By End User, 2020 & 2030 Figure 117: Italy Skin Perfusion Pressure Testing Devices Market Value Analysis (US$ Mn), 2020 & 2030 Figure 118: Italy Skin Perfusion Pressure Testing Devices Market Value Share, Product, 2020 & 2030 Figure 119: Italy Skin Perfusion Pressure Testing Devices Market Value Share, By Modality, 2020 & 2030 Figure 120: Italy Skin Perfusion Pressure Testing Devices Market Value Share, By End User, 2020 & 2030 Figure 121: Spain Skin Perfusion Pressure Testing Devices Market Value Analysis (US$ Mn), 2020 & 2030 Figure 122: Spain Skin Perfusion Pressure Testing Devices Market Value Share, Product, 2020 & 2030 Figure 123: Spain Skin Perfusion Pressure Testing Devices Market Value Share, By Modality, 2020 & 2030 Figure 124: Spain Skin Perfusion Pressure Testing Devices Market Value Share, By End User, 2020 & 2030 Figure 125: Russia Skin Perfusion Pressure Testing Devices Market Value Analysis (US$ Mn), 2020 & 2030 Figure 126: Russia Skin Perfusion Pressure Testing Devices Market Value Share, Product, 2020 & 2030 Figure 127: Russia Skin Perfusion Pressure Testing Devices Market Value Share, By Modality, 2020 & 2030 Figure 128: Russia Skin Perfusion Pressure Testing Devices Market Value Share, By End User, 2020 & 2030 Figure 129: China Skin Perfusion Pressure Testing Devices Market Value Analysis (US$ Mn), 2020 & 2030 Figure 130: China Skin Perfusion Pressure Testing Devices Market Value Share, Product, 2020 & 2030 Figure 131: China Skin Perfusion Pressure Testing Devices Market Value Share, By Modality, 2020 & 2030 Figure 132: China Skin Perfusion Pressure Testing Devices Market Value Share, By End User, 2020 & 2030 Figure 133: Japan Skin Perfusion Pressure Testing Devices Market Value Analysis (US$ Mn), 2020 & 2030 Figure 134: Japan Skin Perfusion Pressure Testing Devices Market Value Share, Product, 2020 & 2030 Figure 135: Japan Skin Perfusion Pressure Testing Devices Market Value Share, By Modality, 2020 & 2030 Figure 136: Japan Skin Perfusion Pressure Testing Devices Market Value Share, By End User, 2020 & 2030 Figure 137: South Korea Skin Perfusion Pressure Testing Devices Market Value Analysis (US$ Mn), 2020 & 2030 Figure 138: South Korea Skin Perfusion Pressure Testing Devices Market Value Share, Product, 2020 & 2030 Figure 139: South Korea Skin Perfusion Pressure Testing Devices Market Value Share, By Modality, 2020 & 2030 Figure 140: South Korea Skin Perfusion Pressure Testing Devices Market Value Share, By End User, 2020 & 2030 Figure 141: India Skin Perfusion Pressure Testing Devices Market Value Analysis (US$ Mn), 2020 & 2030 Figure 142: India Skin Perfusion Pressure Testing Devices Market Value Share, Product, 2020 & 2030 Figure 143: India Skin Perfusion Pressure Testing Devices Market Value Share, By Modality, 2020 & 2030 Figure 144: India Skin Perfusion Pressure Testing Devices Market Value Share, By End User, 2020 & 2030 Figure 145: Thailand Skin Perfusion Pressure Testing Devices Market Value Analysis (US$ Mn), 2020 & 2030 Figure 146: Thailand Skin Perfusion Pressure Testing Devices Market Value Share, Product, 2020 & 2030 Figure 147: Thailand Skin Perfusion Pressure Testing Devices Market Value Share, By Modality, 2020 & 2030 Figure 148: Thailand Skin Perfusion Pressure Testing Devices Market Value Share, By End User, 2020 & 2030 Figure 149: Indonesia Skin Perfusion Pressure Testing Devices Market Value Analysis (US$ Mn), 2020 & 2030 Figure 150: Indonesia Skin Perfusion Pressure Testing Devices Market Value Share, Product, 2020 & 2030 Figure 151: Indonesia Skin Perfusion Pressure Testing Devices Market Value Share, By Modality, 2020 & 2030 Figure 152: Indonesia Skin Perfusion Pressure Testing Devices Market Value Share, By End User, 2020 & 2030 Figure 153: Malaysia Skin Perfusion Pressure Testing Devices Market Value Analysis (US$ Mn), 2020 & 2030 Figure 154: Malaysia Skin Perfusion Pressure Testing Devices Market Value Share, Product, 2020 & 2030 Figure 155: Malaysia Skin Perfusion Pressure Testing Devices Market Value Share, By Modality, 2020 & 2030 Figure 156: Malaysia Skin Perfusion Pressure Testing Devices Market Value Share, By End User, 2020 & 2030 Figure 157: Australia Skin Perfusion Pressure Testing Devices Market Value Analysis (US$ Mn), 2020 & 2030 Figure 158: Australia Skin Perfusion Pressure Testing Devices Market Value Share, Product, 2020 & 2030 Figure 159: Australia Skin Perfusion Pressure Testing Devices Market Value Share, By Modality, 2020 & 2030 Figure 160: Australia Skin Perfusion Pressure Testing Devices Market Value Share, By End User, 2020 & 2030 Figure 161: New Zealand Skin Perfusion Pressure Testing Devices Market Value Analysis (US$ Mn), 2020 & 2030 Figure 162: New Zealand Skin Perfusion Pressure Testing Devices Market Value Share, Product, 2020 & 2030 Figure 163: New Zealand Skin Perfusion Pressure Testing Devices Market Value Share, By Modality, 2020 & 2030 Figure 164: New Zealand Skin Perfusion Pressure Testing Devices Market Value Share, By End User, 2020 & 2030 Figure 165: GCC Countries Skin Perfusion Pressure Testing Devices Market Value Analysis (US$ Mn), 2020 & 2030 Figure 166: GCC Countries Skin Perfusion Pressure Testing Devices Market Value Share, Product, 2020 & 2030 Figure 167: GCC Countries Skin Perfusion Pressure Testing Devices Market Value Share, By Modality, 2020 & 2030 Figure 168: GCC Countries Skin Perfusion Pressure Testing Devices Market Value Share, By End User, 2020 & 2030 Figure 169: Turkey Countries Skin Perfusion Pressure Testing Devices Market Value Analysis (US$ Mn), 2020 & 2030 Figure 170: Turkey Skin Perfusion Pressure Testing Devices Market Value Share, Product, 2020 & 2030 Figure 171: Turkey Skin Perfusion Pressure Testing Devices Market Value Share, By Modality, 2020 & 2030 Figure 172: Turkey Skin Perfusion Pressure Testing Devices Market Value Share, By End User, 2020 & 2030 Figure 173: South Africa Countries Skin Perfusion Pressure Testing Devices Market Value Analysis (US$ Mn), 2020 & 2030 Figure 174: South Africa Skin Perfusion Pressure Testing Devices Market Value Share, Product, 2020 & 2030 Figure 175: South Africa Skin Perfusion Pressure Testing Devices Market Value Share, By Modality, 2020 & 2030 Figure 176: South Africa Skin Perfusion Pressure Testing Devices Market Value Share, By End User, 2020 & 2030
Explore Healthcare Insights
View Reports