Autologous Wound Care Market Size and Share Forecast Outlook (2023 to 2033)

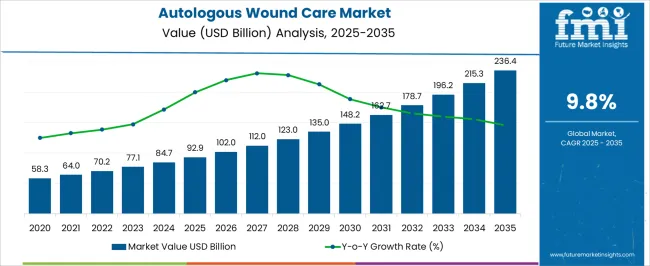
The autologous wound care market size is projected to be worth USD 76.4 million in 2023. The market is likely to surpass USD 203.3 million by 2033 at a CAGR of 10.3% during the forecast period.

The market growth is being propelled by increased point of wound care. According to WHO in 2022, traffic accidents cause nearly 1.3 million death annually. Additional 20 to 50 million people develop disabilities owed to sustaining non-fatal injuries.

The formation of wound, alerts the body to the urgent need to heal the lesions through the self-regenerative process. The physiological process of wound healing involves a series of intricate, well-ordered, and interconnected actions from a variety of cell types that interact in a highly complex temporal sequence, aided by the release of soluble mediators and signals that can direct circulating cells towards the injured tissues.

Other Drivers Propelling the Demand for Autologous wound care include:

  • The rising prevalence of chronic wounds, such as diabetic foot ulcers, pressure ulcers, and venous leg ulcers, is a significant driver for the autologous wound care market
  • There is a growing demand for personalized medicine across various healthcare sectors. Autologous wound care aligns with this trend by tailoring treatments to individual patients, utilizing their own cells or tissues.
  • Reimbursement policies and coverage by healthcare systems and insurance providers play a significant role in driving the adoption of autologous wound care.
  • Patients often prefer treatments that utilize their own cells or tissues, as it aligns with the concept of personalized care and may lead to improved outcomes. The positive patient experience and potential benefits of autologous wound care contribute to its market growth.

Challenges for Companies /Manufacturers in the Autologous wound care Market:

  • Autologous wound care therapies often involve complex procedures, cell processing, and specialized technologies, which can contribute to high treatment costs. The expenses associated with autologous therapies, including cell isolation, expansion, and delivery methods, may limit their accessibility and affordability.
  • Autologous wound care therapies often rely on individual patient-specific cells or tissues, which can present challenges in terms of standardization and scalability. Ensuring consistent quality control, reproducibility, and scalability of autologous treatments can be demanding and may limit their widespread adoption.

Opportunities in the Autologous wound care Industry:

  • The growing prevalence of chronic wounds, such as diabetic foot ulcers, venous leg ulcers, and pressure ulcers, provides a significant opportunity for autologous wound care
  • The shift towards personalized medicine and precision wound care presents opportunities for autologous therapies. Autologous wound care enables tailored treatments based on an individual's specific wound characteristics and biological profile.
  • The integration of digital health technologies and remote monitoring in wound care presents opportunities for autologous therapies. Telemedicine, mobile applications, wearable devices, and remote monitoring platforms can facilitate remote consultations, wound assessment, and follow-up care.

Latest Trends in the Autologous wound care Market:

  • Advancements in cellular therapies such as stem cell-based treatments, are rapidly advancing in the field of autologous wound care. Researchers are exploring the potential of various cell types, including mesenchymal stem cells, adipose-derived stem cells, and epidermal stem cells, for enhancing wound healing and tissue regeneration.
  • 3D printing technology is increasingly being utilized in autologous wound care. It enables the fabrication of patient-specific scaffolds or implants using biocompatible materials. 3D printing allows for precise customization, shape complexity, and incorporation of specific features to match individual wound requirements.
  • Biomaterial innovations play a crucial role in autologous wound care by providing scaffolds, matrices, or carriers for cells, growth factors, or other bioactive substances.
Attributes Details
Autologous wound care Market Size (2023) USD 76.4 million
Autologous wound care Market Projected Size (2033) USD 203.3 million
Value CAGR (2023 to 2033) 10.3%

Comparison of Historical vs Future Outlook for Autologous Wound Care Market (2017 to 2033)

From 2017 to 2022, the global autologous wound care market experienced a CAGR of 8.5%, reaching a market size of USD 76.4 million in 2023.

Over the past two decades, numerous clinical trials have been conducted to evaluate the efficacy and safety of autologous wound care therapies.

These trials have been focused on various approaches, including stem cell-based therapies, tissue-engineered skin substitutes, and bioactive dressings. Some of these therapies have gained regulatory approvals and entered the market, providing options for autologous wound care.

Future Forecast for Autologous wound care Industry:

Looking ahead, the global autologous wound care industry is expected to rise at a CAGR of 10.3% from 2023 to 2033. During the forecast period, the market size is expected to reach USD 203.3 million by 2033.

The autologous wound care industry is expected to continue its growth trajectory from 2023 to 2033, driven by increasing technological advancements and digital solutions for wound monitoring. The integration of digital health solutions in wound care is a growing trend. Mobile applications, wearable devices, and remote monitoring platforms allow for real-time monitoring of wounds, tracking healing progress, and facilitating communication between patients and healthcare providers.

Gene therapy approaches are being explored in autologous wound care to deliver therapeutic genes or modulate gene expression in the wound site. Researchers are investigating the use of gene therapy techniques to enhance wound healing processes, stimulate tissue regeneration, or modulate inflammatory responses. Gene therapy holds potential for personalized and targeted interventions in autologous wound care.

Analysis of Top Countries Adopting Autologous Wound Care Solutions

Autologous wound care Market to Surge in the United States Due to Rising Rate of Regenerative Medicine

Country The United States
Market Size (USD million) by End of Forecast Period (2033) USD 45.6 million
CAGR % 2023 to End of Forecast (2033) 5.8%

The autologous wound care industry in the United States is expected to reach a market size of USD 45.6 million by 2033, expanding at a CAGR of 5.8%. Autologous wound care is part of the broader field of regenerative medicine, which focuses on harnessing the body's own healing capabilities.

In the United States, there is a growing interest in regenerative medicine therapies, including autologous approaches, for wound healing. This includes the use of autologous stem cells, growth factors, and other cellular components to promote tissue regeneration and wound repair.

Rising Demand for Autologous Wound Care by Healthcare Professional to Propel the United Kingdom Market Growth

Country The United Kingdom
Market Size (USD million) by End of Forecast Period (2033) USD 7.2 million
CAGR % 2023 to End of Forecast (2033) 9.8%

The autologous wound care industry in the United Kingdom is expected to reach a market share of USD 7.2 million, expanding at a CAGR of 9.8% during the forecast period.

The UK is investing in regenerative medicine initiatives, including autologous wound care, through research funding and collaborative projects. These initiatives aim to advance the understanding of wound healing mechanisms and develop innovative autologous therapies. Academic institutions, government bodies, and industry partners are actively engaged in these efforts.

Notable Growth Expected in China's Autologous Wound Care Market as Government Focuses on the Stem Cell Therapy

Country China
Market Size (USD million) by End of Forecast Period (2033) USD 38.3 million
CAGR % 2023 to End of Forecast (2033) 19.5%

The autologous wound care industry in China is anticipated to reach a market size of USD 38.3 million, moving at a CAGR of 19.5% during the forecast period. Stem cell-based autologous wound care is gaining traction in China.

Researchers and clinicians are exploring the use of various types of stem cells, such as mesenchymal stem cells (MSCs) derived from the patient's own tissues, for promoting wound healing. Stem cell therapy aims to enhance tissue regeneration, modulate the inflammatory response, and accelerate wound closure.
Growing Awareness and Acceptance to Drive Market Growth in Japan

Country Japan
Market Size (USD million) by End of Forecast Period (2033) USD 22.5 million
CAGR % 2023 to End of Forecast (2033) 17.3%

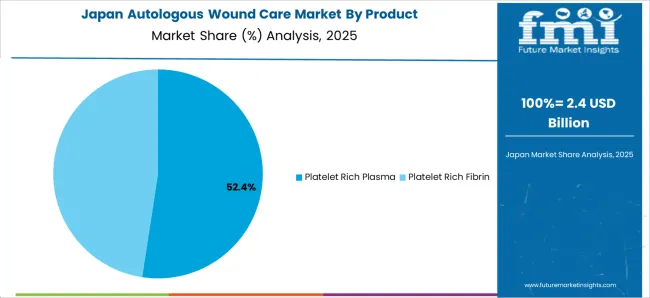
The autologous wound care industry in Japan is estimated to reach a market size of USD 22.5 million by 2033, thriving at a CAGR of 17.3%. Autologous growth factor therapies are gaining attention in Japan.

These therapies involve the extraction and concentration of growth factors from the patient's own tissues, such as platelet-rich plasma (PRP), to stimulate wound healing. Autologous growth factor therapies are being explored for the treatment of chronic wounds, diabetic ulcers, and other difficult-to-heal wounds.
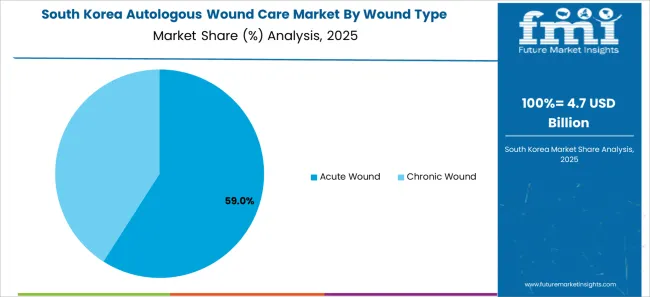
Demand for Autologous wound care is Rising Due to Increased Investment in Tissue Engineering to Fuel Market Growth in South Korea

Country South Korea
Market Size (USD million) by End of Forecast Period (2033) USD 23.2 million
CAGR % 2023 to End of Forecast (2033) 22.3%

The autologous wound care industry in South Korea is expected to reach a market size of USD 23.2 million, expanding at a CAGR of 22.3% during the forecast period. South Korea is actively engaged in the development of tissue engineering and biotechnology approaches for autologous wound care.

Researchers and companies are working on the creation of biomaterial scaffolds and three-dimensional structures that can support cell growth and promote tissue regeneration at the wound site. These advancements aim to provide innovative solutions for healing chronic wounds and enhancing wound closure.

Autologous Wound Care Industry Analysis by Category

Platelet Rich Fibrin to Dominate Autologous wound care Industry with 9.2% CAGR through 2033

Platelet rich fibrin is expected to dominate the autologous wound care industry with a CAGR of 9.2% from 2023 to 2033. This segment captures a significant market share in 2023 due to its high efficiency, and expected appropriate results.

PRF is relatively simple to prepare. It involves the centrifugation of the patient's blood, which separates it into its various components, including PRF. The PRF can then be easily extracted and applied to the wound site. This ease of preparation makes PRF a convenient and accessible option for healthcare professionals.

How is Chronic Wound Type Driving the Autologous wound care Market?

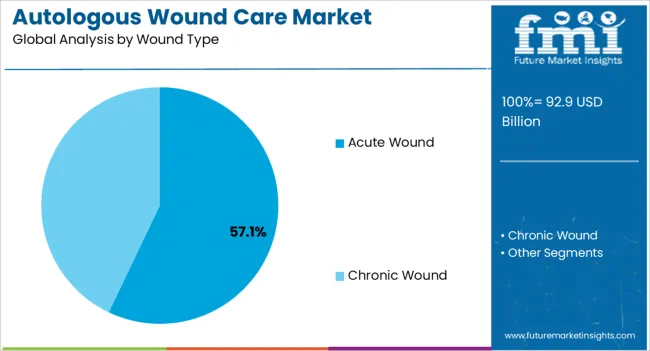
Chronic wound type is expected to dominate the autologous wound care industry with a CAGR of 9.7% from 2023 to 2033. This segment captures a significant market share in 2023 due to rising prevalence of chronic diseases like diabetic foot ulcers, venous leg ulcers, and pressure ulcers, are prevalent medical conditions.

They affect a significant number of patients globally, leading to a substantial burden on healthcare systems. The high prevalence of chronic wounds creates a significant market demand for effective wound care solutions, including autologous therapies.

Which End User is Widely Adopted the Autologous wound care?

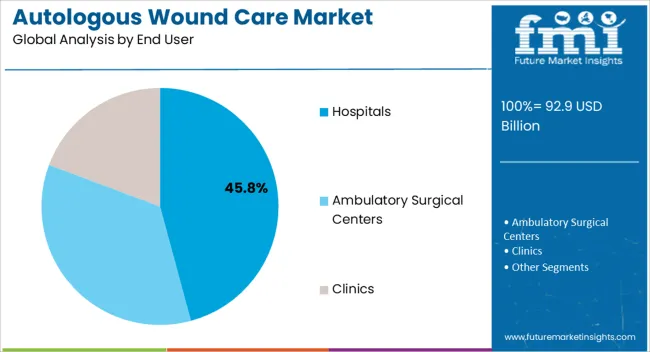
The hospital segment is expected to dominate the autologous wound care industry with a CAGR of 8.5% from 2023 to 2033. Hospitals are equipped with advanced infrastructure, technologies, and medical expertise, making them ideal settings for the adoption and implementation of autologous wound care. These facilities have the necessary resources and specialized personnel to perform autologous procedures, including the preparation and administration of therapies such as platelet-rich plasma (PRP) or stem cell treatments.
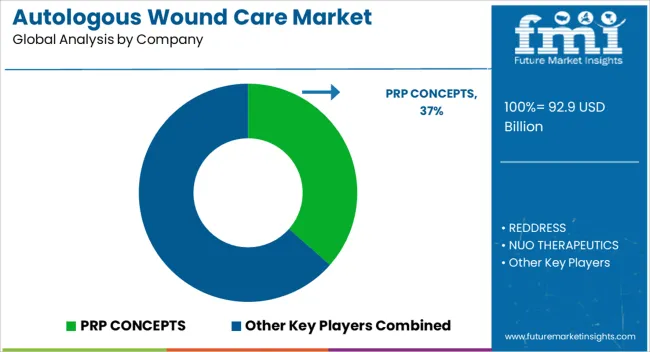
Competitive Landscape of the Autologous Wound Care Market

Autologous wound care sector is fiercely competitive, with many companies fighting for market dominance. To stay ahead of the competition in such a circumstance, essential players must employ smart techniques.

Key Strategies Used by the Participants

Product Development

Companies invest heavily in R&D to deliver therapies of wound care that improve efficiency, dependability, and cost-effectiveness. Product innovation allows businesses to differentiate themselves from their competition while also catering to the changing demands of their clients.

Strategic Alliances & Collaborations

Key industry leaders frequently develop strategic partnerships and collaborations with other companies in order to harness their strengths and increase their market reach. Companies might also gain access to new technology and markets through such agreements.

Expansion into Emerging Markets

Autologous wound care sector is expanding rapidly in emerging regions such as China and India. Key firms are enhancing their distribution networks and developing local manufacturing facilities to increase their presence in these areas.

Acquisitions and mergers

Mergers and acquisitions are frequently used by key players in the autologous wound care business to consolidate their market position, extend their product range, and gain access to new markets.

Key Autologous Wound Care Market Players and Concentration

  • PRP CONCEPTS
  • REDDRESS
  • NUO THERAPEUTICS
  • Reapplix A/S

Key Developments in the Autologous wound care Market:

  • In May 2023, RedDress raised USD 26 million in Series D round of funding. The key participants included ATHOS Biopharma GmbH and life science investors such as Investors the Ragnar Crossover Fund and Group of HCS Capital. This funding will support the expansion of RedDress' unique blood-based technology, increased adoption of its product line, and the establishment of international partnerships.
  • In August 2021, PRP Concepts announced Made in the USA for all kit production falling under CASCADE Autologous Platelet System. These will be manufactured at two facilities: Carlsbad, California, and Cary, North Carolina.

Top Segments Studied in the Autologous Wound Care Market Research Report

By Product:

  • Platelet Rich Plasma
  • Platelet Rich Fibrin

By Wound Type:

  • Acute Wound
  • Chronic Wound

By End User:

  • Hospitals
  • Ambulatory Surgical Centers
  • Clinics

By Region:

  • North America
  • Latin America
  • Europe
  • East Asia
  • South Asia
  • Oceania
  • The Middle East & Africa

Table of Content

  • 1. Executive Summary
  • 2. Market Overview
  • 3. Key Market Trends
  • 4. Value Added Insights
  • 5. Market Background
  • 6. Global Market Demand (in Value or Size in USD Million) Analysis 2012 to 2022 and Forecast, 2023 to 2033
  • 7. Global Market Analysis 2012 to 2022 and Forecast 2023 to 2033, By Product
    • 7.1. Platelet Rich Plasma
    • 7.2. Platelet Rich Fibrin
  • 8. Global Market Analysis 2012 to 2022 and Forecast 2023 to 2033, By Wound Type
    • 8.1. Acute Wound
    • 8.2. Chronic Wound
  • 9. Global Market Analysis 2012 to 2022 and Forecast 2023 to 2033, By End User
    • 9.1. Hospitals
    • 9.2. Ambulatory Surgical Centers
    • 9.3. Clinics
  • 10. Global Market Analysis 2012 to 2022 and Forecast 2023 to 2033, by Region
    • 10.1. North America
    • 10.2. Latin America
    • 10.3. Europe
    • 10.4. South Asia
    • 10.5. East Asia
    • 10.6. Oceania
    • 10.7. Middle East and Africa (MEA)
  • 11. North America Market Analysis 2012 to 2022 and Forecast 2023 to 2033
  • 12. Latin America Market Analysis 2012 to 2022 and Forecast 2023 to 2033
  • 13. Europe Market Analysis 2012 to 2022 and Forecast 2023 to 2033
  • 14. South Asia Market Analysis 2012 to 2022 and Forecast 2023 to 2033
  • 15. East Asia Market Analysis 2012 to 2022 and Forecast 2023 to 2033
  • 16. Oceania Market Analysis 2012 to 2022 and Forecast 2023 to 2033
  • 17. Middle East and Africa Market Analysis 2012 to 2022 and Forecast 2023 to 2033
  • 18. Market Structure Analysis
  • 19. Competition Analysis
    • 19.1. PRP CONCEPTS
    • 19.2. REDDRESS
    • 19.3. NUO THERAPEUTICS
    • 19.4. Reapplix A/S
  • 20. Assumptions and Acronyms Used
  • 21. Research Methodology

List of Tables

Table 01: Global Market Analysis 2012 to 2022 and Forecast 2023 to 2033, by Product

Table 02: Global Market Analysis 2012 to 2022 and Forecast 2023 to 2033by Wound Type

Table 03: Global Market Analysis 2012 to 2022 and Forecast 2023 to 2033, by End User

Table 04: Global Market Analysis 2012 to 2022 and Forecast 2023 to 2033, by Region

Table 05: North America Market Value (US$ Million) Analysis 2012 to 2022 and Forecast 2023 to 2033, by Country

Table 06: North America Market Value (US$ Million) Analysis 2012 to 2022 and Forecast 2023 to 2033, by Product

Table 07: North America Market Value (US$ Million) Analysis 2012 to 2022 and Forecast 2023 to 2033, by Wound Type

Table 08: North America Market Value (US$ Million) Analysis 2012 to 2022 and Forecast 2023 to 2033, by End User

Table 09: Latin America Market Value (US$ Million) Analysis 2012 to 2022 and Forecast 2023 to 2033, by Country

Table 10: Latin America Market Value (US$ Million) Analysis 2012 to 2022 and Forecast 2023 to 2033, by Product

Table 11: Latin America Market Value (US$ Million) Analysis 2012 to 2022 and Forecast 2023 to 2033, by Wound Type

Table 12: Latin America Market Value (US$ Million) Analysis 2012 to 2022 and Forecast 2023 to 2033, by End User

Table 13: Europe Market Value (US$ Million) Analysis 2012 to 2022 and Forecast 2023 to 2033, by Country

Table 14: Europe Market Value (US$ Million) Analysis 2012 to 2022 and Forecast 2023 to 2033, by Product

Table 15: Europe Market Analysis 2012 to 2022 and Forecast 2023 to 2033 by Wound Type

Table 16: Europe Market Value (US$ Million) Analysis 2012 to 2022 and Forecast 2023 to 2033, by End User

Table 17: East Asia Market Value (US$ Million) Analysis 2012 to 2022 and Forecast 2023 to 2033, by Country

Table 18: East Asia Market Value (US$ Million) Analysis 2012 to 2022 and Forecast 2023 to 2033, by Product

Table 19: East Asia Market Value (US$ Million) Analysis 2012 to 2022 and Forecast 2023 to 2033, by Wound Type

Table 20: East Asia Market Value (US$ Million) Analysis 2012 to 2022 and Forecast 2023 to 2033, by End User

Table 21: South Asia Market Value (US$ Million) Analysis 2012 to 2022 and Forecast 2023 to 2033, by Country

Table 22: South Asia Market Value (US$ Million) Analysis 2012 to 2022 and Forecast 2023 to 2033, by Product

Table 23: South Asia Market Value (US$ Million) Analysis 2012 to 2022 and Forecast 2023 to 2033, by Wound Type

Table 24: South Asia Market Value (US$ Million) Analysis 2012 to 2022 and Forecast 2023 to 2033, by End User

Table 25: Oceania Market Value (US$ Million) Analysis 2012 to 2022 and Forecast 2023 to 2033, by Country

Table 26: Oceania Market Value (US$ Million) Analysis 2012 to 2022 and Forecast 2023 to 2033, by Product

Table 27: Oceania Market Analysis 2012 to 2022 and Forecast 2023 to 2033by Wound Type

Table 28: Oceania Market Value (US$ Million) Analysis 2012 to 2022 and Forecast 2023 to 2033, by End User

Table 29: Middle East & Africa Market Value (US$ Million) Analysis 2012 to 2022 and Forecast 2023 to 2033, by Country

Table 30: Middle East & Africa Market Value (US$ Million) Analysis 2012 to 2022 and Forecast 2023 to 2033, by Product

Table 31: Middle East & Africa Market Analysis 2012 to 2022 and Forecast 2023 to 2033by Wound Type

Table 32: Middle East & Africa Market Value (US$ Million) Analysis 2012 to 2022 and Forecast 2023 to 2033, by End User

List of Figures

Figure 01: Global Market Value (US$ Million) Analysis, 2012 to 2022

Figure 02: Global Market Forecast & Y-o-Y Growth, 2023 to 2033

Figure 03: Global Market Absolute $ Opportunity (US$ Million) Analysis, 2023 to 2033

Figure 04: Global Market Value Share (%) Analysis 2022 and 2032, by Product

Figure 05: Global Market Y-o-Y Growth (%) Analysis 2023 to 2033, by Product

Figure 06: Global Market Attractiveness Analysis 2023 to 2033, by Product

Figure 07: Global Market Value Share (%) Analysis 2022 and 2032, by Wound Type

Figure 08: Global Market Y-o-Y Growth (%) Analysis 2023 to 2033, by Wound Type

Figure 09: Global Market Attractiveness Analysis 2023 to 2033, by Wound Type

Figure 10: Global Market Value Share (%) Analysis 2022 and 2032, by End User

Figure 11: Global Market Y-o-Y Growth (%) Analysis 2023 to 2033, by End User

Figure 12: Global Market Attractiveness Analysis 2023 to 2033, by End User

Figure 13: Global Market Value Share (%) Analysis 2022 and 2032, by Region

Figure 14: Global Market Y-o-Y Growth (%) Analysis 2023 to 2033, by Region

Figure 15: Global Market Attractiveness Analysis 2023 to 2033, by Region

Figure 16: North America Market Value (US$ Million) Analysis, 2012 to 2022

Figure 17: North America Market Value (US$ Million) Forecast, 2023 to 2033

Figure 18: North America Market Value Share, by Product (2023 E)

Figure 19: North America Market Value Share, by Wound Type (2023 E)

Figure 20: North America Market Value Share, by End User (2023 E)

Figure 21: North America Market Value Share, by Country (2023 E)

Figure 22: North America Market Attractiveness Analysis by Product, 2023 to 2033

Figure 23: North America Market Attractiveness Analysis by Wound Type, 2023 to 2033

Figure 24: North America Market Attractiveness Analysis by End User, 2023 to 2033

Figure 25: North America Market Attractiveness Analysis by Country, 2023 to 2033

Figure 26: USA Market Value Proportion Analysis, 2022

Figure 27: Global Vs. USA Growth Comparison

Figure 28: USA Market Share Analysis (%) by Product, 2023 & 2033

Figure 29: USA Market Share Analysis (%) by Wound Type, 2023 & 2033

Figure 30: USA Market Share Analysis (%) by End User, 2023 & 2033

Figure 31: Canada Market Value Proportion Analysis, 2022

Figure 32: Global Vs. Canada. Growth Comparison

Figure 33: Canada Market Share Analysis (%) by Product, 2023 & 2033

Figure 34: Canada Market Share Analysis (%) by Wound Type, 2023 & 2033

Figure 35: Canada Market Share Analysis (%) by End User, 2023 & 2033

Figure 36: Latin America Market Value (US$ Million) Analysis, 2012 to 2022

Figure 37: Latin America Market Value (US$ Million) Forecast, 2023 to 2033

Figure 38: Latin America Market Value Share, by Product (2023 E)

Figure 39: Latin America Market Value Share, by Wound Type (2023 E)

Figure 40: Latin America Market Value Share, by End User (2023 E)

Figure 41: Latin America Market Value Share, by Country (2023 E)

Figure 42: Latin America Market Attractiveness Analysis by Product, 2023 to 2033

Figure 43: Latin America Market Attractiveness Analysis by Wound Type, 2023 to 2033

Figure 44: Latin America Market Attractiveness Analysis by End User, 2023 to 2033

Figure 45: Latin America Market Attractiveness Analysis by Country, 2023 to 2033

Figure 46: Mexico Market Value Proportion Analysis, 2022

Figure 47: Global Vs Mexico Growth Comparison

Figure 48: Mexico Market Share Analysis (%) by Product, 2023 & 2033

Figure 49: Mexico Market Share Analysis (%) by Wound Type, 2023 & 2033

Figure 50: Mexico Market Share Analysis (%) by End User, 2023 & 2033

Figure 51: Brazil Market Value Proportion Analysis, 2022

Figure 52: Global Vs. Brazil. Growth Comparison

Figure 53: Brazil Market Share Analysis (%) by Product, 2023 & 2033

Figure 54: Brazil Market Share Analysis (%) by Wound Type, 2023 & 2033

Figure 55: Brazil Market Share Analysis (%) by End User, 2023 & 2033

Figure 56: Argentina Market Value Proportion Analysis, 2022

Figure 57: Global Vs Argentina Growth Comparison

Figure 58: Argentina Market Share Analysis (%) by Product, 2023 & 2033

Figure 59: Argentina Market Share Analysis (%) by Wound Type, 2023 & 2033

Figure 60: Argentina Market Share Analysis (%) by End User, 2023 & 2033

Figure 61: Europe Market Value (US$ Million) Analysis, 2012 to 2022

Figure 62: Europe Market Value (US$ Million) Forecast, 2023 to 2033

Figure 63: Europe Market Value Share, by Product (2023 E)

Figure 64: Europe Market Value Share, by Wound Type (2023 E)

Figure 65: Europe Market Value Share, by End User (2023 E)

Figure 66: Europe Market Value Share, by Country (2023 E)

Figure 67: Europe Market Attractiveness Analysis by Product, 2023 to 2033

Figure 68: Europe Market Attractiveness Analysis by Wound Type, 2023 to 2033

Figure 69: Europe Market Attractiveness Analysis by End User, 2023 to 2033

Figure 70: Europe Market Attractiveness Analysis by Country, 2023 to 2033

Figure 71: UK Market Value Proportion Analysis, 2022

Figure 72: Global Vs. UK Growth Comparison

Figure 73: UK Market Share Analysis (%) by Product, 2023 & 2033

Figure 74: UK Market Share Analysis (%) by Wound Type, 2023 & 2033

Figure 75: UK Market Share Analysis (%) by End User, 2023 & 2033

Figure 76: Germany Market Value Proportion Analysis, 2022

Figure 77: Global Vs. Germany Growth Comparison

Figure 78: Germany Market Share Analysis (%) by Product, 2023 & 2033

Figure 79: Germany Market Share Analysis (%) by Wound Type, 2023 & 2033

Figure 80: Germany Market Share Analysis (%) by End User, 2023 & 2033

Figure 81: Italy Market Value Proportion Analysis, 2022

Figure 82: Global Vs. Italy Growth Comparison

Figure 83: Italy Market Share Analysis (%) by Product, 2023 & 2033

Figure 84: Italy Market Share Analysis (%) by Wound Type, 2023 & 2033

Figure 85: Italy Market Share Analysis (%) by End User, 2023 & 2033

Figure 86: France Market Value Proportion Analysis, 2022

Figure 87: Global Vs France Growth Comparison

Figure 88: France Market Share Analysis (%) by Product, 2023 & 2033

Figure 89: France Market Share Analysis (%) by Wound Type, 2023 & 2033

Figure 90: France Market Share Analysis (%) by End User, 2023 & 2033

Figure 91: Spain Market Value Proportion Analysis, 2022

Figure 92: Global Vs Spain Growth Comparison

Figure 93: Spain Market Share Analysis (%) by Product, 2023 & 2033

Figure 94: Spain Market Share Analysis (%) by Wound Type, 2023 & 2033

Figure 95: Spain Market Share Analysis (%) by End User, 2023 & 2033

Figure 96: Russia Market Value Proportion Analysis, 2022

Figure 97: Global Vs Russia Growth Comparison

Figure 98: Russia Market Share Analysis (%) by Product, 2023 & 2033

Figure 99: Russia Market Share Analysis (%) by Wound Type, 2023 & 2033

Figure 100: Russia Market Share Analysis (%) by End User, 2023 & 2033

Figure 101: BENELUX Market Value Proportion Analysis, 2022

Figure 102: Global Vs BENELUX Growth Comparison

Figure 103: BENELUX Market Share Analysis (%) by Product, 2023 & 2033

Figure 104: BENELUX Market Share Analysis (%) by Wound Type, 2023 & 2033

Figure 105: BENELUX Market Share Analysis (%) by End User, 2023 & 2033

Figure 106: East Asia Market Value (US$ Million) Analysis, 2012 to 2022

Figure 107: East Asia Market Value (US$ Million) Forecast, 2023 to 2033

Figure 108: East Asia Market Value Share, by Product (2023 E)

Figure 109: East Asia Market Value Share, by Wound Type (2023 E)

Figure 110: East Asia Market Value Share, by End User (2023 E)

Figure 111: East Asia Market Value Share, by Country (2023 E)

Figure 112: East Asia Market Attractiveness Analysis by Product, 2023 to 2033

Figure 113: East Asia Market Attractiveness Analysis by Wound Type, 2023 to 2033

Figure 114: East Asia Market Attractiveness Analysis by End User, 2023 to 2033

Figure 115: East Asia Market Attractiveness Analysis by Country, 2023 to 2033

Figure 116: China Market Value Proportion Analysis, 2022

Figure 117: Global Vs. China Growth Comparison

Figure 118: China Market Share Analysis (%) by Product, 2023 & 2033

Figure 119: China Market Share Analysis (%) by Wound Type, 2023 & 2033

Figure 120: China Market Share Analysis (%) by End User, 2023 & 2033

Figure 121: Japan Market Value Proportion Analysis, 2022

Figure 122: Global Vs. Japan Growth Comparison

Figure 123: Japan Market Share Analysis (%) by Product, 2023 & 2033

Figure 124: Japan Market Share Analysis (%) by Wound Type, 2023 & 2033

Figure 125: Japan Market Share Analysis (%) by End User, 2023 & 2033

Figure 126: South Korea Market Value Proportion Analysis, 2022

Figure 127: Global Vs South Korea Growth Comparison

Figure 128: South Korea Market Share Analysis (%) by Product, 2023 & 2033

Figure 129: South Korea Market Share Analysis (%) by Wound Type, 2023 & 2033

Figure 130: South Korea Market Share Analysis (%) by End User, 2023 & 2033

Figure 131: South Asia Market Value (US$ Million) Analysis, 2012 to 2022

Figure 132: South Asia Market Value (US$ Million) Forecast, 2023 to 2033

Figure 133: South Asia Market Value Share, by Product (2023 E)

Figure 134: South Asia Market Value Share, by Wound Type (2023 E)

Figure 135: South Asia Market Value Share, by End User (2023 E)

Figure 136: South Asia Market Value Share, by Country (2023 E)

Figure 137: South Asia Market Attractiveness Analysis by Product, 2023 to 2033

Figure 138: South Asia Market Attractiveness Analysis by Wound Type, 2023 to 2033

Figure 139: South Asia Market Attractiveness Analysis by End User, 2023 to 2033

Figure 140: South Asia Market Attractiveness Analysis by Country, 2023 to 2033

Figure 141: India Market Value Proportion Analysis, 2022

Figure 142: Global Vs. India Growth Comparison

Figure 143: India Market Share Analysis (%) by Product, 2023 & 2033

Figure 144: India Market Share Analysis (%) by Wound Type, 2023 & 2033

Figure 145: India Market Share Analysis (%) by End User, 2023 & 2033

Figure 146: Indonesia Market Value Proportion Analysis, 2022

Figure 147: Global Vs. Indonesia Growth Comparison

Figure 148: Indonesia Market Share Analysis (%) by Product, 2023 & 2033

Figure 149: Indonesia Market Share Analysis (%) by Wound Type, 2023 & 2033

Figure 150: Indonesia Market Share Analysis (%) by End User, 2023 & 2033

Figure 151: Malaysia Market Value Proportion Analysis, 2022

Figure 152: Global Vs. Malaysia Growth Comparison

Figure 153: Malaysia Market Share Analysis (%) by Product, 2023 & 2033

Figure 154: Malaysia Market Share Analysis (%) by Wound Type, 2023 & 2033

Figure 155: Malaysia Market Share Analysis (%) by End User, 2023 & 2033

Figure 156: Thailand Market Value Proportion Analysis, 2022

Figure 157: Global Vs. Thailand Growth Comparison

Figure 158: Thailand Market Share Analysis (%) by Product, 2023 & 2033

Figure 159: Thailand Market Share Analysis (%) by Wound Type, 2023 & 2033

Figure 160: Thailand Market Share Analysis (%) by End User, 2023 & 2033

Figure 161: Oceania Market Value (US$ Million) Analysis, 2012 to 2022

Figure 162: Oceania Market Value (US$ Million) Forecast, 2023 to 2033

Figure 163: Oceania Market Value Share, by Product (2023 E)

Figure 164: Oceania Market Value Share, by Wound Type (2023 E)

Figure 165: Oceania Market Value Share, by End User (2023 E)

Figure 166: Oceania Market Value Share, by Country (2023 E)

Figure 167: Oceania Market Attractiveness Analysis by Product, 2023 to 2033

Figure 168: Oceania Market Attractiveness Analysis by Wound Type, 2023 to 2033

Figure 169: Oceania Market Attractiveness Analysis by End User, 2023 to 2033

Figure 170: Oceania Market Attractiveness Analysis by Country, 2023 to 2033

Figure 171: Australia Market Value Proportion Analysis, 2022

Figure 172: Global Vs. Australia Growth Comparison

Figure 173: Australia Market Share Analysis (%) by Product, 2023 & 2033

Figure 174: Australia Market Share Analysis (%) by Wound Type, 2023 & 2033

Figure 175: Australia Market Share Analysis (%) by End User, 2023 & 2033

Figure 176: New Zealand Market Value Proportion Analysis, 2022

Figure 177: Global Vs New Zealand Growth Comparison

Figure 178: New Zealand Market Share Analysis (%) by Product, 2023 & 2033

Figure 179: New Zealand Market Share Analysis (%) by Wound Type, 2023 & 2033

Figure 180: New Zealand Market Share Analysis (%) by End User, 2023 & 2033

Figure 181: Middle East & Africa Market Value (US$ Million) Analysis, 2012 to 2022

Figure 182: Middle East & Africa Market Value (US$ Million) Forecast, 2023 to 2033

Figure 183: Middle East & Africa Market Value Share, by Product (2023 E)

Figure 184: Middle East & Africa Market Value Share, by Wound Type (2023 E)

Figure 185: Middle East & Africa Market Value Share, by End User (2023 E)

Figure 186: Middle East & Africa Market Value Share, by Country (2023 E)

Figure 187: Middle East & Africa Market Attractiveness Analysis by Product, 2023 to 2033

Figure 188: Middle East & Africa Market Attractiveness Analysis by Wound Type, 2023 to 2033

Figure 189: Middle East & Africa Market Attractiveness Analysis by End User, 2023 to 2033

Figure 190: Middle East & Africa Market Attractiveness Analysis by Country, 2023 to 2033

Figure 191: GCC Countries Market Value Proportion Analysis, 2022

Figure 192: Global Vs GCC Countries Growth Comparison

Figure 193: GCC Countries Market Share Analysis (%) by Product, 2023 & 2033

Figure 194: GCC Countries Market Share Analysis (%) by Wound Type, 2023 & 2033

Figure 195: GCC Countries Market Share Analysis (%) by End User, 2023 & 2033

Figure 196: Türkiye Market Value Proportion Analysis, 2022

Figure 197: Global Vs. Türkiye Growth Comparison

Figure 198: Türkiye Market Share Analysis (%) by Product, 2023 & 2033

Figure 199: Türkiye Market Share Analysis (%) by Wound Type, 2023 & 2033

Figure 200: Türkiye Market Share Analysis (%) by End User, 2023 & 2033

Figure 201: South Africa Market Value Proportion Analysis, 2022

Figure 202: Global Vs. South Africa Growth Comparison

Figure 203: South Africa Market Share Analysis (%) by Product, 2023 & 2033

Figure 204: South Africa Market Share Analysis (%) by Wound Type, 2023 & 2033

Figure 205: South Africa Market Share Analysis (%) by End User, 2023 & 2033

Figure 206: North Africa Market Value Proportion Analysis, 2022

Figure 207: Global Vs North Africa Growth Comparison

Figure 208: North Africa Market Share Analysis (%) by Product, 2023 & 2033

Figure 209: North Africa Market Share Analysis (%) by Wound Type, 2023 & 2033

Figure 210: North Africa Market Share Analysis (%) by End User, 2023 & 2033

Frequently Asked Questions

What is the Estimated Valuation of the Autologous Wound Care Industry?

The autologous wound care market to hit USD 76.4 million in 2023.

Which are the Leading Players in the Industry?

PRP CONCEPTS, REDDRESS, and NUO THERAPEUTICS are the three leading market players.

What will be the Worldwide Autologous Wound Care Market Value by 2033?

The market is likely to reach USD 203.3 million by 2033.

What Drives Sales of the Worldwide Autologous Wound Care Market?

Growing incidences of chronic wounds is a prominent driver in the market.

Which is the Key Segment Product in the Industry Through 2033?

The platelet rich fibrin segment to remain preferred through 2033.

Explore Therapeutic Device Insights

Future Market Insights

Autologous Wound Care Market