Reports

- Global Locations -

Headquarters

Future Market Insights, Inc.

Christiana Corporate, 200
Continental Drive, Suite 401,
Newark, Delaware - 19713,
United States

T: +1-845-579-5705

Americas

Future Market Insights, Inc.

616 Corporate Way, Suite 2-9018,
Valley Cottage, NY 10989, United States

T: +1-347-918-3531

MEA

Future Market Insights

1602-6 Jumeirah Bay X2 Tower, Plot No: JLT-PH2-X2A,
Jumeirah Lakes Towers, Dubai,
United Arab Emirates

Europe

Future Market Insights

3rd Floor, 207 Regent Street,
W1B 3HH London
United Kingdom

T: + 44 (0) 20 8123 9659
D: +44 (0) 20 3287 4268

Asia Pacific

Future Market Insights

IndiaLand Global Tech Park, Unit UG-1, Behind Grand HighStreet, Phase 1, Hinjawadi, MH, Pune – 411057, India

Wound Evacuators Market Outlook (2022 to 2032)

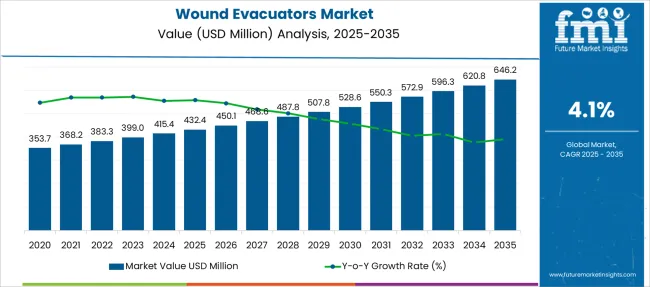
The global wound evacuators market size is estimated to be valued at US$ 383.3 Million in 2022. Furthermore, amid the increasing incidence of acute and chronic wounds such as diabetic foot ulcers, post-surgical ulcers, venous ulcers, and pressure ulcers, and rising spending on wound care, the overall wound evacuator sales are projected to grow at a steady CAGR of 4.1% between 2022 and 2032, generating revenues worth US$ 593.6 Million by the end of 2032.

Attributes Key Statistics
Global Wound Evacuators Market CAGR (2022 to 2032) 4.1%
Global Wound Evacuators Market Estimated Value (2022) US$ 383.3 Million
Global Wound Evacuators Market Projected Value (2032) US$ 593.6Million

Wound evacuators are medical devices used for the management and treatment of acute and chronic wounds. They are being increasingly used for the extraction of body fluids from patients to facilitate wound healing.

Over the years, wound evacuators have become highly sought-after medical devices used in post-operative wound management for removing drainage from wounds to prevent infection and facilitate wound healing.

The surge in the number of wounds due to accidents and chronic diseases like diabetes is a key factor driving growth in the global wound evacuators market. A sedentary lifestyle and unhealthy eating habits have resulted in the rise of diabetes worldwide. According to the International Diabetes Federation (IDF), the total number of people living with diabetes is expected to rise to 643 million in 2030 and 783 million by 2045.

Diabetes often leads to serious complications like diabetic foot ulcers which are fatal in nature. For instance, various researches have suggested that 30% of people who develop a diabetic foot ulcer will die within 5 years. This will continue to create a conducive environment for wound evacuators market growth during the forecast period.

Don't pay for what you don't need

Customize your report by selecting specific countries or regions and save 30%!

How Will Rising Prevalence of Wounds Influence the Growth in Wound Evacuators Market?

As per FMI, the global demand for wound evacuators is projected to increase at a CAGR of 4.1% between 2022 and 2032, in comparison to the 3% CAGR registered from 2017 to 2021. Growth in the global wound evacuators market is mainly driven by the rising incidence of acute and chronic wounds, increasing healthcare spending, and the growing need for better wound care to reduce complications.

Wound evacuators have become ideal solutions for better wound management used across healthcare facilities. These medical devices allow healthcare professionals to remove infection and facilitate wound healing.

The rising prevalence of chronic wounds such as diabetic foot ulcers, pressure ulcers, and venous ulcers is a key factor pushing the demand for wound evacuators across the world. As per the International Diabetes Federation (IDF), diabetic foot and lower limb complications affect around 40 to 60 million people with diabetes globally. This rise in the number of diabetic foot ulcers will therefore continue to boost the wound evacuators market growth during the forecast period.

Similarly, rising preference for cost-effective wound treatment and advancements in wound evacuators will create lucrative opportunities for wound evacuator manufacturers in the coming years.

The growing adoption of wound evacuators in homecare settings to minimize the risk of infections and reduce healthcare costs is projected to expand the global wound evacuators market size in the future.

Which Factors are Challenging the Growth of Wound Evacuators Market?

Despite a positive growth trajectory, the global wound evacuators market is facing various challenges that are restraining its growth to some extent. Some of these factors are higher prices of wound evacuators, scarcity of trained professionals, and increasing usage of traditional wound management across lower economies.

Sabyasachi Ghosh
Sabyasachi Ghosh

Principal Consultant

Talk to Analyst

Find your sweet spots for generating winning opportunities in this market.

Why is North America Emerging as an Opportunistic Wound Evacuators Market?

As per FMI, North America will continue to dominate the global wound evacuators market, accounting for the largest share of 33.9% in 2022. Demand in the North American wound evacuators market is driven by the rising prevalence of chronic diseases, the highly established healthcare industry, increasing spending on wound care, and the heavy presence of leading wound evacuator manufacturers.

Demand for wound evacuators is particularly high across the USA owing to a surge in cases of pressure ulcers and their (pressure ulcers) high morbidity and mortality rates. According to the Agency for Healthcare Research and Quality (AHRQ), over 2.5 million people in the United States develop pressure ulcers each year. This is acting as a catalyst for the growth of the wound evacuators market in the country.

Similarly, rising healthcare spending, an increasing number of hospitals, clinics, and ambulatory centers, and the presence of some of the world’s leading medical device companies are positively impacting the market growth in the region.
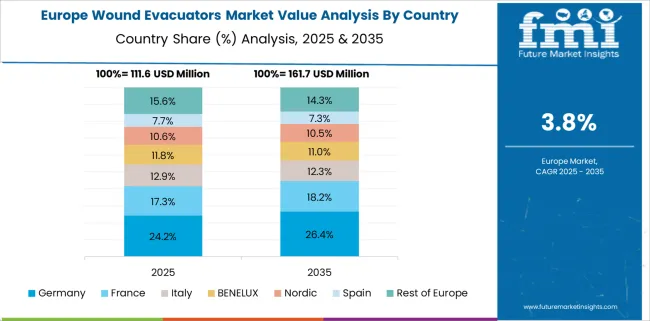
Why is the Demand for Wound Evacuators Burgeoning in Europe?

In Europe, the market for wound evacuators is growing significantly owing to the high levels of health awareness among people, the surging burden of chronic wounds, booming medical tourism, favorable government support, and increasing usage of wound evacuators in chronic wound management. According to FMI, Europe holds a share of 27.4% of the global wound evacuators market and this number is likely to further improve during the forecast period.

Within Europe, the United Kingdom and Germany are emerging as the most lucrative markets for wound evacuators due to the increasing incidence of chronic wounds and rising spending on wound care. For instance, as per GOV.UK, there are over 2.2 million people with chronic wounds in the country. Similarly, as per a report published in the Journal of the European Wound Management Association (EWMA Journal), around 0.24% of the population in Germany is affected by chronic wounds. Driven by this, sales of wound evacuators are projected to grow at a considerable pace in the region during the forthcoming years.

Get the data you need at a Fraction of the cost

Personalize your report by choosing insights you need
and save 40%!

How are Start-ups Changing the Global Wound Evacuators Market Dynamics?

Over the years, the field of wound care has witnessed huge developments and advancements from traditional wound management methods to novel ones like negative pressure wound therapy. This has raised interest among various companies to try their hands at manufacturing wound care therapeutics and devices. As a result, there has been a sharp rise in the number of wound-care start-ups that offer a variety of wound management devices like wound evacuators. For instance,
  • In 2020, NanoTess was started in the USA to solve the world's toughest health challenges beginning with chronic wounds.
  • Guard Medical, a privately-held company, was founded in 2020 to develop easy-to-use and cost-effective solutions that enable prophylactic Negative Pressure Wound Therapy (NPWT) wound care of closed surgical incisions.

Who are the Key Players in the Global Wound Evacuators Market?

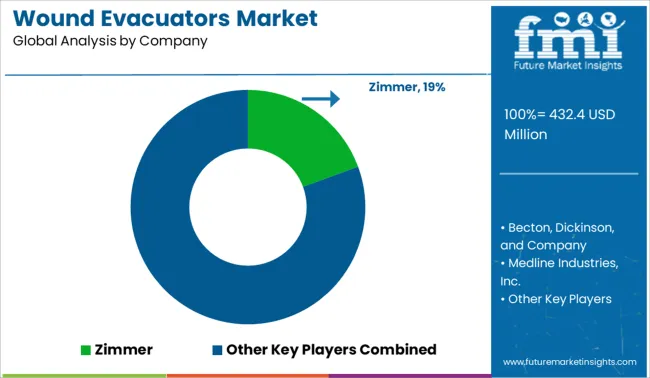
Some of the key wound evacuator manufacturers include Zimmer, Medline Industries, Inc., C. R. Bard, Inc., Redax, Aspen Surgical (sub. Hill-Rom Company), Argon Medical Devices, Inc., and Plasti-med Medikal Ürünler San. Tic. Ltd. among others. These leading players are continuously adopting strategies such as new product launches, mergers, acquisitions, collaborations, and mergers to gain a competitive edge in the global wound evacuators market.

  • In December 2020, Zimmer Biomet completed the acquisition of A&E Medical Corporation to expand its product offerings.
  • In May 2019, Argon Medical Devices, a global manufacturer of specialty medical devices used in interventional procedures, acquired Mana-Tech, Ltd. To expand its commercial reach in the United Kingdom Ireland, and other European countries.

Report Scope

Report Attribute Details
Growth Rate CAGR of 4.1% from 2022 to 2032
Market Value in 2022 US$ 383.3 Million
Market Value in 2032 US$ 593.6 Million
Base Year for Estimation 2021
Forecast Period 2022 to 2032
Quantitative Units Revenue in US$ Million and CAGR from 2022 to 2032
Report Coverage Revenue Forecast, Company Ranking, Competitive Landscape, Growth Factors, Trends, and Pricing Analysis
Segments Covered
  • Product Type
  • Wound Type
  • End User
  • Region
Regions Covered
  • North America
  • Latin America
  • Europe
  • Asia Pacific
  • Middle East and Africa
Key Countries Profiled
  • United States of America
  • Canada
  • Brazil
  • Mexico
  • Germany
  • United Kingdom
  • France
  • Spain
  • Italy
  • China
  • Japan
  • South Korea
  • Malaysia
  • Singapore
  • Australia
  • GCC Countries
  • South Africa
  • Israel
Key Companies Profiled
  • Zimmer
  • Medline Industries, Inc.
  • C. R. Bard, Inc.
  • Redax
  • Aspen Surgical (sub. Hill-Rom Company)
  • Argon Medical Devices, Inc.
  • Plasti-med Medikal Ürünler San. Tic. Ltd.
Customization Available Upon Request

Key Segments Covered in the Wound Evacuators Industry Survey

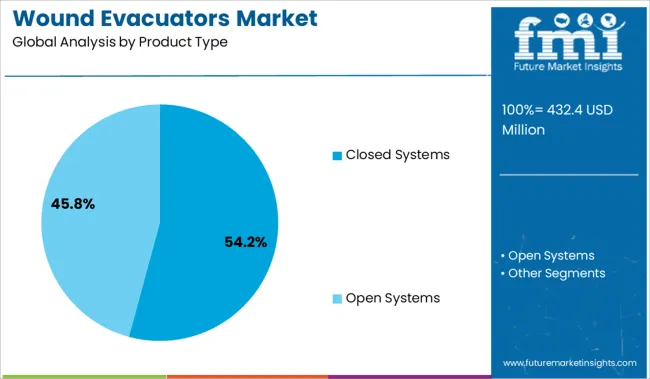
By Product Type:

  • Open Systems
  • Closed Systems

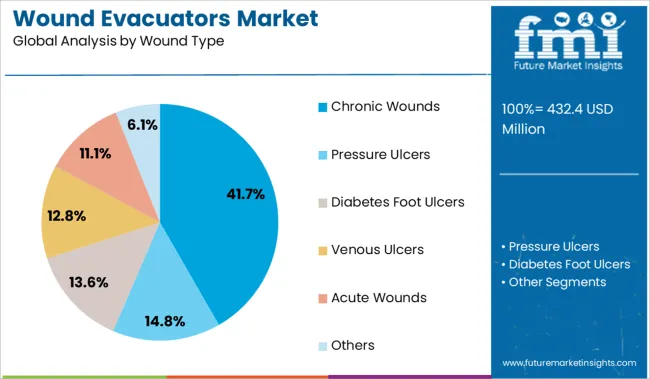
By Wound Type:

  • Chronic Wounds
  • Pressure Ulcers
  • Diabetes Foot Ulcers
  • Venous Ulcers
  • Acute Wounds
  • Others

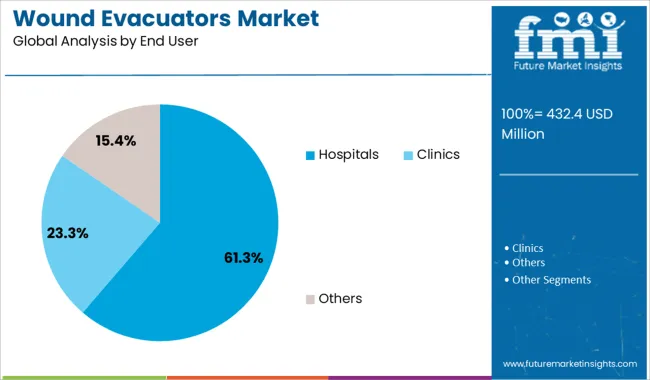
By End User:

  • Hospitals
  • Clinics
  • Others

By Region:

  • North America
  • Latin America
  • Western Europe
  • Eastern Europe
  • Asia Pacific
  • Japan
  • Middle East and Africa

Frequently Asked Questions

What is the current wound evacuator market size?

As per FMI, the global wound evacuators market size is estimated to reach US$ 383.3Million in 2022

What is the demand outlook for the global wound evacuators market?

Demand in the global wound evacuators market is expected to grow at a CAGR of 4.1% through 2032

What is the projected market valuation for wound evacuators market by 2032?

The global wound evacuators market is projected to reach a valuation of US$ 593.3 Million by 2032

Which regions dominate the global wound evacuators market?

North America dominates the global wound evacuators market with a share of around 33.9%.

Table of Content

1. Executive Summary | Wound Evacuators Market

    1.1. Global Market Outlook

    1.2. Demand-side Trends

    1.3. Supply-side Trends

    1.4. Technology Roadmap Analysis

    1.5. Analysis and Recommendations

2. Market Overview

    2.1. Market Coverage / Taxonomy

    2.2. Market Definition / Scope / Limitations

3. Market Background

    3.1. Market Dynamics

        3.1.1. Drivers

        3.1.2. Restraints

        3.1.3. Opportunity

        3.1.4. Trends

    3.2. Scenario Forecast

        3.2.1. Demand in Optimistic Scenario

        3.2.2. Demand in Likely Scenario

        3.2.3. Demand in Conservative Scenario

    3.3. Opportunity Map Analysis

    3.4. Investment Feasibility Matrix

    3.5. PESTLE and Porter’s Analysis

    3.6. Regulatory Landscape

        3.6.1. By Key Regions

        3.6.2. By Key Countries

    3.7. Regional Parent Market Outlook

4. Global Analysis 2017 to 2021 and Forecast, 2022 to 2032

    4.1. Historical Market Size Value (US$ Million) Analysis, 2017 to 2021

    4.2. Current and Future Market Size Value (US$ Million) Projections, 2022 to 2032

        4.2.1. Y-o-Y Growth Trend Analysis

        4.2.2. Absolute $ Opportunity Analysis

5. Global Analysis 2017 to 2021 and Forecast 2022 to 2032, By Product Type

    5.1. Introduction / Key Findings

    5.2. Historical Market Size Value (US$ Million) Analysis By Product Type, 2017 to 2021

    5.3. Current and Future Market Size Value (US$ Million) Analysis and Forecast By Product Type, 2022 to 2032

        5.3.1. Open System

        5.3.2. Closed System

    5.4. Y-o-Y Growth Trend Analysis By Product Type, 2017 to 2021

    5.5. Absolute $ Opportunity Analysis By Product Type, 2022 to 2032

6. Global Analysis 2017 to 2021 and Forecast 2022 to 2032, By Wound Type

    6.1. Introduction / Key Findings

    6.2. Historical Market Size Value (US$ Million) Analysis By Wound Type, 2017 to 2021

    6.3. Current and Future Market Size Value (US$ Million) Analysis and Forecast By Wound Type, 2022 to 2032

        6.3.1. Chronic Wounds

        6.3.2. Pressure Ulcers

        6.3.3. Diabetes Foot Ulcers

        6.3.4. Venous Ulcers

        6.3.5. Acute Wounds

        6.3.6. Other Wound Types

    6.4. Y-o-Y Growth Trend Analysis By Wound Type, 2017 to 2021

    6.5. Absolute $ Opportunity Analysis By Wound Type, 2022 to 2032

7. Global Analysis 2017 to 2021 and Forecast 2022 to 2032, By End User

    7.1. Introduction / Key Findings

    7.2. Historical Market Size Value (US$ Million) Analysis By End User, 2017 to 2021

    7.3. Current and Future Market Size Value (US$ Million) Analysis and Forecast By End User, 2022 to 2032

        7.3.1. Hospitals

        7.3.2. Clinics

        7.3.3. Others

    7.4. Y-o-Y Growth Trend Analysis By End User, 2017 to 2021

    7.5. Absolute $ Opportunity Analysis By End User, 2022 to 2032

8. Global Analysis 2017 to 2021 and Forecast 2022 to 2032, By Region

    8.1. Introduction

    8.2. Historical Market Size Value (US$ Million) Analysis By Region, 2017 to 2021

    8.3. Current Market Size Value (US$ Million) Analysis and Forecast By Region, 2022 to 2032

        8.3.1. North America

        8.3.2. Latin America

        8.3.3. Europe

        8.3.4. Asia Pacific

        8.3.5. Middle East and Africa

    8.4. Market Attractiveness Analysis By Region

9. North America Analysis 2017 to 2021 and Forecast 2022 to 2032, By Country

    9.1. Historical Market Size Value (US$ Million) Trend Analysis By Market Taxonomy, 2017 to 2021

    9.2. Market Size Value (US$ Million) Forecast By Market Taxonomy, 2022 to 2032

        9.2.1. By Country

            9.2.1.1. United States of America
            9.2.1.2. Canada         9.2.2. By Product Type         9.2.3. By Wound Type         9.2.4. By End User     9.3. Market Attractiveness Analysis         9.3.1. By Country         9.3.2. By Product Type         9.3.3. By Wound Type         9.3.4. By End User     9.4. Key Takeaways 10. Latin America Analysis 2017 to 2021 and Forecast 2022 to 2032, By Country     10.1. Historical Market Size Value (US$ Million) Trend Analysis By Market Taxonomy, 2017 to 2021     10.2. Market Size Value (US$ Million) Forecast By Market Taxonomy, 2022 to 2032         10.2.1. By Country             10.2.1.1. Brazil             10.2.1.2. Mexico             10.2.1.3. Rest of Latin America         10.2.2. By Product Type         10.2.3. By Wound Type         10.2.4. By End User     10.3. Market Attractiveness Analysis         10.3.1. By Country         10.3.2. By Product Type         10.3.3. By Wound Type         10.3.4. By End User     10.4. Key Takeaways 11. Europe Analysis 2017 to 2021 and Forecast 2022 to 2032, By Country     11.1. Historical Market Size Value (US$ Million) Trend Analysis By Market Taxonomy, 2017 to 2021     11.2. Market Size Value (US$ Million) Forecast By Market Taxonomy, 2022 to 2032         11.2.1. By Country             11.2.1.1. Germany             11.2.1.2. United Kingdom
            11.2.1.3. France             11.2.1.4. Spain             11.2.1.5. Italy             11.2.1.6. Rest of Europe         11.2.2. By Product Type         11.2.3. By Wound Type         11.2.4. By End User     11.3. Market Attractiveness Analysis         11.3.1. By Country         11.3.2. By Product Type         11.3.3. By Wound Type         11.3.4. By End User     11.4. Key Takeaways 12. Asia Pacific Analysis 2017 to 2021 and Forecast 2022 to 2032, By Country     12.1. Historical Market Size Value (US$ Million) Trend Analysis By Market Taxonomy, 2017 to 2021     12.2. Market Size Value (US$ Million) Forecast By Market Taxonomy, 2022 to 2032         12.2.1. By Country             12.2.1.1. China             12.2.1.2. Japan             12.2.1.3. South Korea             12.2.1.4. India             12.2.1.5. Malaysia             12.2.1.6. Singapore             12.2.1.7. Australia             12.2.1.8. New Zealand             12.2.1.9. Rest of Asia-Pacific         12.2.2. By Product Type         12.2.3. By Wound Type         12.2.4. By End User     12.3. Market Attractiveness Analysis         12.3.1. By Country         12.3.2. By Product Type         12.3.3. By Wound Type         12.3.4. By End User     12.4. Key Takeaways 13. Middle East and Africa Analysis 2017 to 2021 and Forecast 2022 to 2032, By Country     13.1. Historical Market Size Value (US$ Million) Trend Analysis By Market Taxonomy, 2017 to 2021     13.2. Market Size Value (US$ Million) Forecast By Market Taxonomy, 2022 to 2032         13.2.1. By Country             13.2.1.1. GCC Countries             13.2.1.2. South Africa             13.2.1.3. Israel             13.2.1.4. Rest of Middle East and Africa         13.2.2. By Product Type         13.2.3. By Wound Type         13.2.4. By End User     13.3. Market Attractiveness Analysis         13.3.1. By Country         13.3.2. By Product Type         13.3.3. By Wound Type         13.3.4. By End User     13.4. Key Takeaways 14. Key Countries Analysis     14.1. United States of America
        14.1.1. Pricing Analysis         14.1.2. Market Share Analysis, 2021             14.1.2.1. By Product Type             14.1.2.2. By Wound Type             14.1.2.3. By End User     14.2. Canada         14.2.1. Pricing Analysis         14.2.2. Market Share Analysis, 2021             14.2.2.1. By Product Type             14.2.2.2. By Wound Type             14.2.2.3. By End User     14.3. Brazil         14.3.1. Pricing Analysis         14.3.2. Market Share Analysis, 2021             14.3.2.1. By Product Type             14.3.2.2. By Wound Type             14.3.2.3. By End User     14.4. Mexico         14.4.1. Pricing Analysis         14.4.2. Market Share Analysis, 2021             14.4.2.1. By Product Type             14.4.2.2. By Wound Type             14.4.2.3. By End User     14.5. Germany         14.5.1. Pricing Analysis         14.5.2. Market Share Analysis, 2021             14.5.2.1. By Product Type             14.5.2.2. By Wound Type             14.5.2.3. By End User     14.6. United Kingdom
        14.6.1. Pricing Analysis         14.6.2. Market Share Analysis, 2021             14.6.2.1. By Product Type             14.6.2.2. By Wound Type             14.6.2.3. By End User     14.7. France         14.7.1. Pricing Analysis         14.7.2. Market Share Analysis, 2021             14.7.2.1. By Product Type             14.7.2.2. By Wound Type             14.7.2.3. By End User     14.8. Spain         14.8.1. Pricing Analysis         14.8.2. Market Share Analysis, 2021             14.8.2.1. By Product Type             14.8.2.2. By Wound Type             14.8.2.3. By End User     14.9. Italy         14.9.1. Pricing Analysis         14.9.2. Market Share Analysis, 2021             14.9.2.1. By Product Type             14.9.2.2. By Wound Type             14.9.2.3. By End User     14.10. China         14.10.1. Pricing Analysis         14.10.2. Market Share Analysis, 2021             14.10.2.1. By Product Type             14.10.2.2. By Wound Type             14.10.2.3. By End User     14.11. Japan         14.11.1. Pricing Analysis         14.11.2. Market Share Analysis, 2021             14.11.2.1. By Product Type             14.11.2.2. By Wound Type             14.11.2.3. By End User     14.12. South Korea         14.12.1. Pricing Analysis         14.12.2. Market Share Analysis, 2021             14.12.2.1. By Product Type             14.12.2.2. By Wound Type             14.12.2.3. By End User     14.13. Malaysia         14.13.1. Pricing Analysis         14.13.2. Market Share Analysis, 2021             14.13.2.1. By Product Type             14.13.2.2. By Wound Type             14.13.2.3. By End User     14.14. Singapore         14.14.1. Pricing Analysis         14.14.2. Market Share Analysis, 2021             14.14.2.1. By Product Type             14.14.2.2. By Wound Type             14.14.2.3. By End User     14.15. Australia         14.15.1. Pricing Analysis         14.15.2. Market Share Analysis, 2021             14.15.2.1. By Product Type             14.15.2.2. By Wound Type             14.15.2.3. By End User     14.16. New Zealand         14.16.1. Pricing Analysis         14.16.2. Market Share Analysis, 2021             14.16.2.1. By Product Type             14.16.2.2. By Wound Type             14.16.2.3. By End User     14.17. GCC Countries         14.17.1. Pricing Analysis         14.17.2. Market Share Analysis, 2021             14.17.2.1. By Product Type             14.17.2.2. By Wound Type             14.17.2.3. By End User     14.18. South Africa         14.18.1. Pricing Analysis         14.18.2. Market Share Analysis, 2021             14.18.2.1. By Product Type             14.18.2.2. By Wound Type             14.18.2.3. By End User     14.19. Israel         14.19.1. Pricing Analysis         14.19.2. Market Share Analysis, 2021             14.19.2.1. By Product Type             14.19.2.2. By Wound Type             14.19.2.3. By End User 15. Market Structure Analysis     15.1. Competition Dashboard     15.2. Competition Benchmarking     15.3. Market Share Analysis of Top Players         15.3.1. By Regional         15.3.2. By Product Type         15.3.3. By Wound Type         15.3.4. By End User 16. Competition Analysis     16.1. Competition Deep Dive         16.1.1. Zimmer             16.1.1.1. Overview             16.1.1.2. Product Portfolio             16.1.1.3. Profitability by Market Segments             16.1.1.4. Sales Footprint             16.1.1.5. Strategy Overview                 16.1.1.5.1. Marketing Strategy         16.1.2. Becton, Dickinson, and Company             16.1.2.1. Overview             16.1.2.2. Product Portfolio             16.1.2.3. Profitability by Market Segments             16.1.2.4. Sales Footprint             16.1.2.5. Strategy Overview                 16.1.2.5.1. Marketing Strategy         16.1.3. Medline Industries, Inc.             16.1.3.1. Overview             16.1.3.2. Product Portfolio             16.1.3.3. Profitability by Market Segments             16.1.3.4. Sales Footprint             16.1.3.5. Strategy Overview                 16.1.3.5.1. Marketing Strategy         16.1.4. Aspen Surgical             16.1.4.1. Overview             16.1.4.2. Product Portfolio             16.1.4.3. Profitability by Market Segments             16.1.4.4. Sales Footprint             16.1.4.5. Strategy Overview                 16.1.4.5.1. Marketing Strategy         16.1.5. Redax             16.1.5.1. Overview             16.1.5.2. Product Portfolio             16.1.5.3. Profitability by Market Segments             16.1.5.4. Sales Footprint             16.1.5.5. Strategy Overview                 16.1.5.5.1. Marketing Strategy         16.1.6. Argon Medical Devices, Inc.             16.1.6.1. Overview             16.1.6.2. Product Portfolio             16.1.6.3. Profitability by Market Segments             16.1.6.4. Sales Footprint             16.1.6.5. Strategy Overview                 16.1.6.5.1. Marketing Strategy         16.1.7. Plasti-med Medikal Ürünler San. Tic. Ltd.             16.1.7.1. Overview             16.1.7.2. Product Portfolio             16.1.7.3. Profitability by Market Segments             16.1.7.4. Sales Footprint             16.1.7.5. Strategy Overview                 16.1.7.5.1. Marketing Strategy         16.1.8. Baxter International             16.1.8.1. Overview             16.1.8.2. Product Portfolio             16.1.8.3. Profitability by Market Segments             16.1.8.4. Sales Footprint             16.1.8.5. Strategy Overview                 16.1.8.5.1. Marketing Strategy         16.1.9. Medtronic             16.1.9.1. Overview             16.1.9.2. Product Portfolio             16.1.9.3. Profitability by Market Segments             16.1.9.4. Sales Footprint             16.1.9.5. Strategy Overview                 16.1.9.5.1. Marketing Strategy         16.1.10. ConvaTec Group PLC             16.1.10.1. Overview             16.1.10.2. Product Portfolio             16.1.10.3. Profitability by Market Segments             16.1.10.4. Sales Footprint             16.1.10.5. Strategy Overview                 16.1.10.5.1. Marketing Strategy 17. Assumptions & Acronyms Used 18. Research Methodology

List of Tables

Table 1: Global Market Value (US$ Million) Forecast by Region, 2017 to 2032

Table 2: Global Market Value (US$ Million) Forecast by Product Type, 2017 to 2032

Table 3: Global Market Value (US$ Million) Forecast by Wound Type, 2017 to 2032

Table 4: Global Market Value (US$ Million) Forecast by End User, 2017 to 2032

Table 5: North America Market Value (US$ Million) Forecast by Country, 2017 to 2032

Table 6: North America Market Value (US$ Million) Forecast by Product Type, 2017 to 2032

Table 7: North America Market Value (US$ Million) Forecast by Wound Type, 2017 to 2032

Table 8: North America Market Value (US$ Million) Forecast by End User, 2017 to 2032

Table 9: Latin America Market Value (US$ Million) Forecast by Country, 2017 to 2032

Table 10: Latin America Market Value (US$ Million) Forecast by Product Type, 2017 to 2032

Table 11: Latin America Market Value (US$ Million) Forecast by Wound Type, 2017 to 2032

Table 12: Latin America Market Value (US$ Million) Forecast by End User, 2017 to 2032

Table 13: Europe Market Value (US$ Million) Forecast by Country, 2017 to 2032

Table 14: Europe Market Value (US$ Million) Forecast by Product Type, 2017 to 2032

Table 15: Europe Market Value (US$ Million) Forecast by Wound Type, 2017 to 2032

Table 16: Europe Market Value (US$ Million) Forecast by End User, 2017 to 2032

Table 17: Asia Pacific Market Value (US$ Million) Forecast by Country, 2017 to 2032

Table 18: Asia Pacific Market Value (US$ Million) Forecast by Product Type, 2017 to 2032

Table 19: Asia Pacific Market Value (US$ Million) Forecast by Wound Type, 2017 to 2032

Table 20: Asia Pacific Market Value (US$ Million) Forecast by End User, 2017 to 2032

Table 21: Middle East and Africa Market Value (US$ Million) Forecast by Country, 2017 to 2032

Table 22: Middle East and Africa Market Value (US$ Million) Forecast by Product Type, 2017 to 2032

Table 23: Middle East and Africa Market Value (US$ Million) Forecast by Wound Type, 2017 to 2032

Table 24: Middle East and Africa Market Value (US$ Million) Forecast by End User, 2017 to 2032

List of Charts

Figure 1: Global Market Value (US$ Million) by Product Type, 2022 to 2032

Figure 2: Global Market Value (US$ Million) by Wound Type, 2022 to 2032

Figure 3: Global Market Value (US$ Million) by End User, 2022 to 2032

Figure 4: Global Market Value (US$ Million) by Region, 2022 to 2032

Figure 5: Global Market Value (US$ Million) Analysis by Region, 2017 to 2032

Figure 6: Global Market Value Share (%) and BPS Analysis by Region, 2022 to 2032

Figure 7: Global Market Y-o-Y Growth (%) Projections by Region, 2022 to 2032

Figure 8: Global Market Value (US$ Million) Analysis by Product Type, 2017 to 2032

Figure 9: Global Market Value Share (%) and BPS Analysis by Product Type, 2022 to 2032

Figure 10: Global Market Y-o-Y Growth (%) Projections by Product Type, 2022 to 2032

Figure 11: Global Market Value (US$ Million) Analysis by Wound Type, 2017 to 2032

Figure 12: Global Market Value Share (%) and BPS Analysis by Wound Type, 2022 to 2032

Figure 13: Global Market Y-o-Y Growth (%) Projections by Wound Type, 2022 to 2032

Figure 14: Global Market Value (US$ Million) Analysis by End User, 2017 to 2032

Figure 15: Global Market Value Share (%) and BPS Analysis by End User, 2022 to 2032

Figure 16: Global Market Y-o-Y Growth (%) Projections by End User, 2022 to 2032

Figure 17: Global Market Attractiveness by Product Type, 2022 to 2032

Figure 18: Global Market Attractiveness by Wound Type, 2022 to 2032

Figure 19: Global Market Attractiveness by End User, 2022 to 2032

Figure 20: Global Market Attractiveness by Region, 2022 to 2032

Figure 21: North America Market Value (US$ Million) by Product Type, 2022 to 2032

Figure 22: North America Market Value (US$ Million) by Wound Type, 2022 to 2032

Figure 23: North America Market Value (US$ Million) by End User, 2022 to 2032

Figure 24: North America Market Value (US$ Million) by Country, 2022 to 2032

Figure 25: North America Market Value (US$ Million) Analysis by Country, 2017 to 2032

Figure 26: North America Market Value Share (%) and BPS Analysis by Country, 2022 to 2032

Figure 27: North America Market Y-o-Y Growth (%) Projections by Country, 2022 to 2032

Figure 28: North America Market Value (US$ Million) Analysis by Product Type, 2017 to 2032

Figure 29: North America Market Value Share (%) and BPS Analysis by Product Type, 2022 to 2032

Figure 30: North America Market Y-o-Y Growth (%) Projections by Product Type, 2022 to 2032

Figure 31: North America Market Value (US$ Million) Analysis by Wound Type, 2017 to 2032

Figure 32: North America Market Value Share (%) and BPS Analysis by Wound Type, 2022 to 2032

Figure 33: North America Market Y-o-Y Growth (%) Projections by Wound Type, 2022 to 2032

Figure 34: North America Market Value (US$ Million) Analysis by End User, 2017 to 2032

Figure 35: North America Market Value Share (%) and BPS Analysis by End User, 2022 to 2032

Figure 36: North America Market Y-o-Y Growth (%) Projections by End User, 2022 to 2032

Figure 37: North America Market Attractiveness by Product Type, 2022 to 2032

Figure 38: North America Market Attractiveness by Wound Type, 2022 to 2032

Figure 39: North America Market Attractiveness by End User, 2022 to 2032

Figure 40: North America Market Attractiveness by Country, 2022 to 2032

Figure 41: Latin America Market Value (US$ Million) by Product Type, 2022 to 2032

Figure 42: Latin America Market Value (US$ Million) by Wound Type, 2022 to 2032

Figure 43: Latin America Market Value (US$ Million) by End User, 2022 to 2032

Figure 44: Latin America Market Value (US$ Million) by Country, 2022 to 2032

Figure 45: Latin America Market Value (US$ Million) Analysis by Country, 2017 to 2032

Figure 46: Latin America Market Value Share (%) and BPS Analysis by Country, 2022 to 2032

Figure 47: Latin America Market Y-o-Y Growth (%) Projections by Country, 2022 to 2032

Figure 48: Latin America Market Value (US$ Million) Analysis by Product Type, 2017 to 2032

Figure 49: Latin America Market Value Share (%) and BPS Analysis by Product Type, 2022 to 2032

Figure 50: Latin America Market Y-o-Y Growth (%) Projections by Product Type, 2022 to 2032

Figure 51: Latin America Market Value (US$ Million) Analysis by Wound Type, 2017 to 2032

Figure 52: Latin America Market Value Share (%) and BPS Analysis by Wound Type, 2022 to 2032

Figure 53: Latin America Market Y-o-Y Growth (%) Projections by Wound Type, 2022 to 2032

Figure 54: Latin America Market Value (US$ Million) Analysis by End User, 2017 to 2032

Figure 55: Latin America Market Value Share (%) and BPS Analysis by End User, 2022 to 2032

Figure 56: Latin America Market Y-o-Y Growth (%) Projections by End User, 2022 to 2032

Figure 57: Latin America Market Attractiveness by Product Type, 2022 to 2032

Figure 58: Latin America Market Attractiveness by Wound Type, 2022 to 2032

Figure 59: Latin America Market Attractiveness by End User, 2022 to 2032

Figure 60: Latin America Market Attractiveness by Country, 2022 to 2032

Figure 61: Europe Market Value (US$ Million) by Product Type, 2022 to 2032

Figure 62: Europe Market Value (US$ Million) by Wound Type, 2022 to 2032

Figure 63: Europe Market Value (US$ Million) by End User, 2022 to 2032

Figure 64: Europe Market Value (US$ Million) by Country, 2022 to 2032

Figure 65: Europe Market Value (US$ Million) Analysis by Country, 2017 to 2032

Figure 66: Europe Market Value Share (%) and BPS Analysis by Country, 2022 to 2032

Figure 67: Europe Market Y-o-Y Growth (%) Projections by Country, 2022 to 2032

Figure 68: Europe Market Value (US$ Million) Analysis by Product Type, 2017 to 2032

Figure 69: Europe Market Value Share (%) and BPS Analysis by Product Type, 2022 to 2032

Figure 70: Europe Market Y-o-Y Growth (%) Projections by Product Type, 2022 to 2032

Figure 71: Europe Market Value (US$ Million) Analysis by Wound Type, 2017 to 2032

Figure 72: Europe Market Value Share (%) and BPS Analysis by Wound Type, 2022 to 2032

Figure 73: Europe Market Y-o-Y Growth (%) Projections by Wound Type, 2022 to 2032

Figure 74: Europe Market Value (US$ Million) Analysis by End User, 2017 to 2032

Figure 75: Europe Market Value Share (%) and BPS Analysis by End User, 2022 to 2032

Figure 76: Europe Market Y-o-Y Growth (%) Projections by End User, 2022 to 2032

Figure 77: Europe Market Attractiveness by Product Type, 2022 to 2032

Figure 78: Europe Market Attractiveness by Wound Type, 2022 to 2032

Figure 79: Europe Market Attractiveness by End User, 2022 to 2032

Figure 80: Europe Market Attractiveness by Country, 2022 to 2032

Figure 81: Asia Pacific Market Value (US$ Million) by Product Type, 2022 to 2032

Figure 82: Asia Pacific Market Value (US$ Million) by Wound Type, 2022 to 2032

Figure 83: Asia Pacific Market Value (US$ Million) by End User, 2022 to 2032

Figure 84: Asia Pacific Market Value (US$ Million) by Country, 2022 to 2032

Figure 85: Asia Pacific Market Value (US$ Million) Analysis by Country, 2017 to 2032

Figure 86: Asia Pacific Market Value Share (%) and BPS Analysis by Country, 2022 to 2032

Figure 87: Asia Pacific Market Y-o-Y Growth (%) Projections by Country, 2022 to 2032

Figure 88: Asia Pacific Market Value (US$ Million) Analysis by Product Type, 2017 to 2032

Figure 89: Asia Pacific Market Value Share (%) and BPS Analysis by Product Type, 2022 to 2032

Figure 90: Asia Pacific Market Y-o-Y Growth (%) Projections by Product Type, 2022 to 2032

Figure 91: Asia Pacific Market Value (US$ Million) Analysis by Wound Type, 2017 to 2032

Figure 92: Asia Pacific Market Value Share (%) and BPS Analysis by Wound Type, 2022 to 2032

Figure 93: Asia Pacific Market Y-o-Y Growth (%) Projections by Wound Type, 2022 to 2032

Figure 94: Asia Pacific Market Value (US$ Million) Analysis by End User, 2017 to 2032

Figure 95: Asia Pacific Market Value Share (%) and BPS Analysis by End User, 2022 to 2032

Figure 96: Asia Pacific Market Y-o-Y Growth (%) Projections by End User, 2022 to 2032

Figure 97: Asia Pacific Market Attractiveness by Product Type, 2022 to 2032

Figure 98: Asia Pacific Market Attractiveness by Wound Type, 2022 to 2032

Figure 99: Asia Pacific Market Attractiveness by End User, 2022 to 2032

Figure 100: Asia Pacific Market Attractiveness by Country, 2022 to 2032

Figure 101: Middle East and Africa Market Value (US$ Million) by Product Type, 2022 to 2032

Figure 102: Middle East and Africa Market Value (US$ Million) by Wound Type, 2022 to 2032

Figure 103: Middle East and Africa Market Value (US$ Million) by End User, 2022 to 2032

Figure 104: Middle East and Africa Market Value (US$ Million) by Country, 2022 to 2032

Figure 105: Middle East and Africa Market Value (US$ Million) Analysis by Country, 2017 to 2032

Figure 106: Middle East and Africa Market Value Share (%) and BPS Analysis by Country, 2022 to 2032

Figure 107: Middle East and Africa Market Y-o-Y Growth (%) Projections by Country, 2022 to 2032

Figure 108: Middle East and Africa Market Value (US$ Million) Analysis by Product Type, 2017 to 2032

Figure 109: Middle East and Africa Market Value Share (%) and BPS Analysis by Product Type, 2022 to 2032

Figure 110: Middle East and Africa Market Y-o-Y Growth (%) Projections by Product Type, 2022 to 2032

Figure 111: Middle East and Africa Market Value (US$ Million) Analysis by Wound Type, 2017 to 2032

Figure 112: Middle East and Africa Market Value Share (%) and BPS Analysis by Wound Type, 2022 to 2032

Figure 113: Middle East and Africa Market Y-o-Y Growth (%) Projections by Wound Type, 2022 to 2032

Figure 114: Middle East and Africa Market Value (US$ Million) Analysis by End User, 2017 to 2032

Figure 115: Middle East and Africa Market Value Share (%) and BPS Analysis by End User, 2022 to 2032

Figure 116: Middle East and Africa Market Y-o-Y Growth (%) Projections by End User, 2022 to 2032

Figure 117: Middle East and Africa Market Attractiveness by Product Type, 2022 to 2032

Figure 118: Middle East and Africa Market Attractiveness by Wound Type, 2022 to 2032

Figure 119: Middle East and Africa Market Attractiveness by End User, 2022 to 2032

Figure 120: Middle East and Africa Market Attractiveness by Country, 2022 to 2032

Recommendations

Healthcare

Advance Wound Care Market

Published : December 2023

Healthcare

Wound Irrigation Systems Market

Published : September 2023

Healthcare

Wound Debridement Products Market

Published : August 2023

Explore Healthcare Insights

View Reports