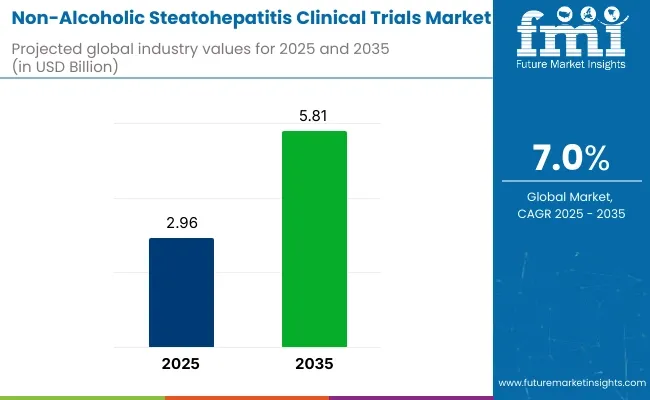
The non-alcoholic steatohepatitis (NASH) clinical trials market is estimated to generate a market size of USD 2.96 billion in 2025 and is expected to reach USD 5.81 billion by 2035, reflecting a compound annual growth rate (CAGR) of 7.0% during the forecast period.
NASH, a progressive liver disease often associated with obesity, diabetes, and metabolic syndrome, is gaining increasing attention due to its growing prevalence and potential for severe complications such as cirrhosis and liver failure. The rising number of clinical trials aimed at finding effective treatments for NASH is a key factor in driving the market's expansion.
One of the main drivers of the market's growth is the increasing awareness of NASH and its potential health impacts. With the rising global burden of obesity and type 2 diabetes, NASH has become a critical area of focus for pharmaceutical companies and researchers.
As the condition can progress without clear symptoms until advanced stages, there is a growing need for earlier diagnosis and effective therapeutic interventions, which is fueling demand for clinical trials. The growing investment in NASH research by both public and private sectors is contributing to the rapid development of novel treatments.
Recent developments in the NASH clinical trials market have seen significant advancements in drug discovery and regulatory support. Several pharmaceutical companies are focusing on developing drugs that target the underlying mechanisms of NASH, including fibrosis, inflammation, and lipid metabolism.
The introduction of promising therapies, such as antifibrotic and anti-inflammatory treatments, is accelerating the number of clinical trials and driving further market growth. Moreover, regulatory agencies like the USA Food and Drug Administration (FDA) are providing more guidance on the approval of NASH treatments, boosting confidence in the market and encouraging more investment.

| Attribute | Value |
|---|---|
| Market Size in 2025 | USD 2.96 billion |
| Market Size in 2035 | USD 5.81 billion |
| CAGR (2025 to 2035) | 7.0% |
Viking Therapeutics' VK2809 was found to be Promising in NASH treatment. On November 20, 2024, Viking Therapeutics presented data from its Phase 2b trial of VK2809 at the American Association for the Study of Liver Diseases conference.
The results demonstrated significant improvements in liver fibrosis and resolution of metabolic dysfunction-associated steatohepatitis (MASH) across all doses, with no substantial adverse events reported. This was officially announced in the company's press release.
As the NASH clinical trials market continues to expand, ongoing advancements in drug discovery, diagnostics, and patient recruitment strategies will contribute to the overall growth of the market, positioning it as a critical segment of the broader liver disease treatment landscape.
The global non-alcoholic steatohepatitis clinical trials market's compound annual growth rate (CAGR) for the first half of 2024 and 2025 is compared in the table below. This analysis provides important insights into the performance of the industry by highlighting significant shifts and trends in revenue generation.
The first half (H1) is the period from January to June, and the second half (H2) is July to December. In the first half (H1) of the decade from 2024 to 2034, the business is predicted to surge at a CAGR of 8.0%, followed by a slightly lower growth rate of 7.6% in the second half (H2) of the same decade.
| Particular | Value CAGR |
|---|---|
| H1 (2024 to 2034) | 8.0% |
| H2 (2024 to 2034) | 7.6% |
| H1 (2025 to 2035) | 7.0% |
| H2 (2025 to 2035) | 6.7% |
Moving into the subsequent period, from H1 2025 to H2 2035, the CAGR is projected to decrease slightly to 7.0% in the first half and remain relatively moderate at 6.7% in the second half. In the first half (H1) the industry witnessed a decrease of 100 BPS while in the second half (H2), the industry witnessed a decrease of 90 BPS.
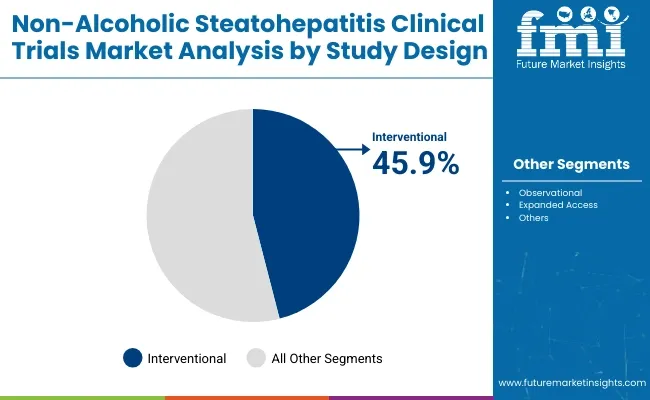
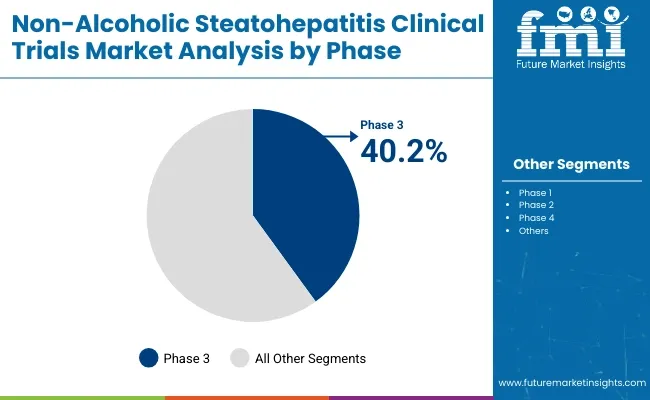
The global non-alcoholic steatohepatitis (NASH) clinical trials market is set to grow steadily from 2025 to 2035, fueled by increasing NASH prevalence, unmet therapeutic needs, and expanding drug pipelines. In 2025, interventional trials are projected to hold 45.9% of the study design segment, while phase 3 trials are expected to account for 40.2% of the phase segment. Key players include Gilead Sciences, Intercept Pharmaceuticals, and Madrigal Pharmaceuticals.
The interventional trials segment is projected to capture 45.9% of the market share in 2025. As pharmaceutical companies intensify efforts to bring effective NASH treatments to market, interventional trials-where drugs or therapies are actively tested-remain at the forefront of clinical research. These trials are essential for evaluating safety, efficacy, and optimal dosing of new drug candidates targeting liver fibrosis and inflammation caused by NASH.

Gilead Sciences and Novo Nordisk are leading sponsors of large-scale interventional trials investigating both monotherapies and combination treatments, including FXR agonists, GLP-1 receptor agonists, and THR-β agonists.
Regulatory agencies such as the FDA and EMA are also providing fast-track designations and breakthrough therapy approvals to accelerate interventional trial timelines. With growing global awareness of NASH and its potential progression to cirrhosis or liver cancer, the push for innovative therapies is intensifying. This makes interventional trial activity a major focus area for biopharma R&D, attracting continued investment and collaboration across academia and industry.
The phase 3 trials segment is expected to account for 40.2% of the phase segment market share in 2025. As the final step before regulatory approval, phase 3 trials play a pivotal role in validating the efficacy and long-term safety of drug candidates. Given the complexity of NASH, these trials often require large patient populations, extended follow-up periods, and rigorous biomarker assessments.

Companies such as Madrigal Pharmaceuticals and Intercept Pharmaceuticals are advancing late-stage candidates with promising outcomes targeting liver fibrosis reversal and metabolic regulation. The segment is seeing growing interest from global CROs, which are streamlining trial logistics and patient recruitment across high-prevalence regions like North America and Europe.
Furthermore, the use of non-invasive diagnostic endpoints and digital health tools is helping to enhance the efficiency of phase 3 trial execution. As NASH becomes a priority area in liver disease therapeutics, the expansion of phase 3 pipelines underscores the market’s shift toward commercialization and imminent product launches.
Rising prevalence of NASH is driving the market growth
A gradually increasing prevalence of non-alcoholic steatohepatitis propels the growth in the NASH clinical trials market. Accordingly, the growing incidence of NASH is strongly associated with an increasing spread of the sedentary life style that augments obesity, type 2 diabetes, and metabolic syndrome.
While the prevalence of obesity has nearly tripled from that in 1975, the prevalence of type 2 diabetes and metabolic syndrome has drawn millions into its fold, especially in both developed and developing economies.
The growing disease burden has installed a need for active therapeutic interventions, thereby fueling need for the conduction of clinical trials for testing novel treatments.
NASH is often asymptomatic in its initial stages and progresses silently via liver fibrosis to cirrhosis or liver cancer. Therefore, an increasing prevalence underlines an urgent requirement for the development of novel treatments; hence, it places NASH to the front row of the research pipeline of pharmaceutical and biotech companies.
This has also accelerated patient recruitment for trials because trials have to be representative in order to enable assessment of efficacy and safety of treatments in a variety of populations.
Therefore, an increasing patient pool, coupled with huge demand to find a cure for the burgeoning health concern, is driving the growth of the NASH clinical trials market.
Lack of approved therapies is driving the industry growth
The lack of approved drugs with respect to NASH makes it one of the strong drivers toward growing the NASH clinical trials market. Not a single FDA-approved drug for this disease's treatment is yet to be recorded, and such diseases are foreseen to create an increased trend in NASH, thereby gradually progressing into such severe conditions such as fibrosis, cirrhosis, and hepatocellular carcinoma.
Such a therapeutic gap is fostering an intensely competitive environment among several pharmaceutical and biotech companies, making substantial investments in the development of innovative drugs.
The majority of companies are competing to be the first to market with effective solutions, given that there are no established therapies available currently and NASH represents a high-priority area for research and innovation.
The urgent need for drugs, acknowledged by the regulatory bodies, has motivated the conferral of fast-track designations, breakthrough therapy status, and orphan drug designations to encourage investment by offsetting timelines for development and hastening the approval for clinical trials.
The absence of approved therapies further accelerates patient enrollment in trials, as patients with NASH continue self-searching for options through experimental treatments. This forces a continuous stream of clinical trials to be set up in unmet need, hence hastening the steps toward improvement in the NASH therapeutic landscape.
Increased investments in NASH research by governments and private organizations creates further growth opportunity
Government and private funding is a great avenue of opportunity to increase growth in the NASH clinical trials market. Since the global burden of NASH has grown with severe health implications, governments and private organizations have enhanced investment in R&D to expedite the process of finding an effective treatment.
Public funding will, in all probability, succeed in giving a push to innovation in collaboration with different stakeholders like academic institutions, research organizations, and pharmaceutical companies in most countries that are well developed.
A lot of the fund covers preclinical research-based studies, biomarker development, and clinical trials; this decreases the financial burden on researchers and brings promising drug candidates into the limelight.
Private organizations also play a significant role in financing the latest research in NASH by venture capital firms and philanthropic organizations. This helps bridge the financing gap that often occurs for early-phase clinical trials critical to de-risking drug development.
This increase in financial backing quickens the pace of clinical trials, fostering innovation in trial design and execution, which allows the development of more sophisticated approaches: combination therapies and precision medicine. Increased funding is likely to further enhance the overall competitiveness and growth of the NASH clinical trials market.
High cost of clinical trials may restrict market growth
The treatment of NASH is highly expensive since it is a complicated disease and its progression is a challenge. Generally, longer study durations are needed for endpoints such as the regression of liver fibrosis or the development of cirrhosis while assessing the efficacy and safety of treatments in NASH trials.
This extends the operational costs related to patient recruitment, monitoring, and data collection. The specialized diagnostic requirements of liver biopsies and other advanced imaging have also increased the costs. Because of the heterogeneity of NASH, large and diverse populations are in demand, inflating the costs of recruitment.
High drop-out rates, possibly due to either the invasive nature of the procedure or the length of the time commitment involved in the trials, further complicate the financial burden by requiring even more recruitments.
These costs are huge entry barriers for smaller biotech and greatly reduce innovative activities in this space. Further, high attrition rates of NASH drug development pose high financial risks on larger pharmaceutical companies.
The economic challenges in NASH force requirements for cost-effectively designed trials and, most importantly, funding alternatives to assure sustainable clinical research in this therapeutic area.
Tier 1 companies are the industry leaders with 56.3% of the global industry. These companies stand out for having a large product portfolio and a high production capacity.
These industry leaders also stand out for having a wide geographic reach, a strong customer base, and substantial experience in manufacturing and having enough financial resources, which enables them to enhance their research and development efforts and expand into new industries.
The companies within tier 1 have a good reputation and high brand value. These companies frequently get involved in strategies such as acquisition and product launches. Prominent companies within tier 1 include Pfizer Inc., Novartis AG and Icon Plc.
Tier 2 companies are relatively smaller as compared with tier 1 players. The tier 2 companies hold a market share of 31.7% worldwide. These firms may not have cutting-edge technology or a broad global reach, but they do ensure regulatory compliance and have good technology.
The players are more competitive when it comes to pricing and target niche markets. Key Companies under this category include AbbVie Inc., F. Hoffmann-La Roche Ltd, Eli Lilly and GSK plc.
Compared to Tiers 1 and 2, Tier 3 companies offer non-alcoholic steatohepatitis clinical trials, but with smaller revenue spouts and less influence. These companies mostly operate in one or two countries and have limited customer base.
The companies such as Novo Nordisk, Gilead Sciences Inc., Viking Therapeutics and Others, and others falls under tier 3 category. They specialize in specific products and cater to niche markets, adding diversity to the industry.
The market analysis for non-alcoholic steatohepatitis clinical trials in various nations is covered in the section below. An analysis of important nations in North America, Latin America, Western Europe, Eastern Europe, East Asia, South Asia & Pacific, and Middle East & Africa of the world has been mentioned below.
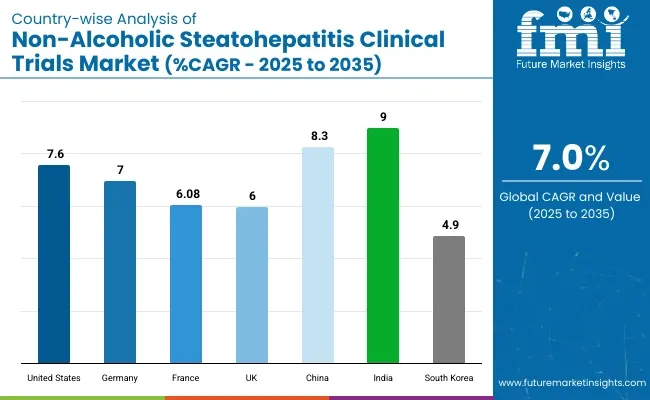
It is projected that the United States will maintain its leading position in North America through 2035, holding a value share of 88.9%. By 2035, China is expected to experience a CAGR of 8.3% in the Asia-Pacific region.
| Countries | Value CAGR (2025 to 2035) |
|---|---|
| United States | 7.6% |
| Germany | 7.0% |
| France | 6.8% |
| UK | 6.0% |
| China | 8.3% |
| India | 9.0% |
| South Korea | 4.9% |

Germany’s non-alcoholic steatohepatitis clinical trials market is poised to exhibit a CAGR of 7.0% between 2025 and 2035. The Germany holds highest market share in European market.
Prevalence and awareness for screening of NASH, along with other factors, are some of the factors that promise a bright future for the clinical trial industry in Germany. Awareness about NASH, especially its relation to obesity, type 2 diabetes, and metabolic syndrome, is created by campaigns for public health and healthcare organization initiatives.
The very high prevalence of these conditions in the country, with over 23% of adults falling in the category of obesity and nearly 10% diagnosed with diabetes, calls for early detection and intervention.
It enables the identification of patients with NASH in screening programs and supports it with advanced diagnostic means such as non-invasive biomarkers and imaging techniques. Considering the very good infrastructure within the German healthcare system, since most people can have access to preventative care, the pool of participants increases in number.
Besides, some pharmaceutical companies and academic institutions in Germany are leveraging the increasing awareness to facilitate and streamline patient recruitment. This proactive approach will help enhance trial efficiency, reduce timelines of recruitment, and thereby support the overall expansion of NASH clinical research in the country.
United States is anticipated to show a CAGR of 7.6% between 2025 and 2035.
One of the highest rates of obesity is seen in the country, with almost 40% of its adult population classified under obesity, while more than 10% of the population is reported to suffer from type 2 diabetes.
In addition to these, metabolic syndrome affects about 34% of the adult population of the USA, increasing the burden on NASH. As these are major risk factors for NASH, their prevalence is directly proportional to the disease's incidence rate.
This vast pool of patients has generated enormous demand for clinical trials in this quest for appropriate treatments for NASH. The pharmaceutical industry increases investment in the research and development of drugs against the unmet medical need since effective therapies have to be sought for liver diseases.
In addition, the USA has a mature healthcare infrastructure for easy access by diagnostic tools as well as by patient recruitment networks, making this location ideal for NASH clinical trials. In this regard, the trend fuels innovative therapies' development and therefore propels growth in the market.
China is anticipated to show a CAGR of 8.3% between 2025 and 2035.
High burden of NASH is believed to be supported by growing obesity, diabetes, and metabolic syndrome within the country. The well-recognized pharmaceutical firms have been looking forward to the successful execution of the efficient clinical trials to put an end to these fast-growing health crises.
Pharmaceutical companies, academic institutions, and CROs showed keen interest in various collaborations aimed at accelerating the development of researches.
Such collaboration enhances trial efficiency due to the pooling of resources, expertise, and technology. The academic institutions bring a deep understanding of NASH pathophysiology, while CROs develop the operational know-how related to patient recruitment, regulatory compliance, and data management for trials. Furthermore, pharmaceutical firms enjoy the advantage of China's large population to recruit greater numbers from a broader section of demographics more quickly.
This has been further helped by the supportive regulatory environment in China, with policies aimed at attracting foreign investments and smoothing the approval process for clinical trials. The synergy between stakeholders accelerates the development of NASH therapies and, consequently, the rapid growth of the clinical trials market in China.
The non-alcoholic steatohepatitis clinical trials industry faces a high competition as there are large number of companies conducting clinical trials for non-alcoholic steatohepatitis. These manufacturers are focused on constantly innovating and improving their product portfolio.
Prominent producers of Non-Alcoholic Steatohepatitis Clinical Trials are concentrating on growing internationally in order to increase their revenue and increase the size of their sales footprint in developing nations through the acquisition of regional small players.
Manufacturers utilize various key strategies such as agreements, product launches, research sponsorship, and strategic collaborations to boost product sales and establish their market presence.
Recent Industry Developments in Non-Alcoholic Steatohepatitis Clinical Trials Market
| Report Attributes | Details |
|---|---|
| Current Total Market Size (2025) | USD 2.96 billion |
| Projected Market Size (2035) | USD 5.81 billion |
| CAGR (2025 to 2035) | 7.0% |
| Base Year for Estimation | 2024 |
| Historical Period | 2020 to 2024 |
| Projections Period | 2025 to 2035 |
| Quantitative Units | USD billion for dollar sales |
| Study Design Types Analyzed (Segment 1) | Interventional, Observational, Expanded Access |
| Phases Analyzed (Segment 2) | Phase 1, Phase 2, Phase 3, Phase 4 |
| Regions Covered | North America, Latin America, East Asia, South Asia & Pacific, Western Europe, Eastern Europe, Middle East and Africa (MEA) |
| Countries Covered | United States, Canada, Mexico, Brazil, Argentina, Germany, France, United Kingdom, Italy, Spain, Netherlands, China, India, Japan, South Korea, ANZ, GCC Countries, South Africa |
| Key Players influencing the Non-Alcoholic Steatohepatitis Clinical Trials Market | Pfizer Inc., Novartis AG, Icon Plc, AbbVie Inc., F. Hoffmann-La Roche Ltd, Eli Lilly, GSK plc., Novo Nordisk, Gilead Sciences Inc., Viking Therapeutics, Others |
| Additional Attributes | dollar sales, CAGR trends, study design segmentation, phase-based growth, competitor dollar sales & market share, regional adoption patterns |
| Report Attributes | Details |
|---|---|
| Current Total Market Size (2025) | USD 2.96 billion |
| Projected Market Size (2035) | USD 5.81 billion |
| CAGR (2025 to 2035) | 7.0% |
| Base Year for Estimation | 2024 |
| Historical Period | 2020 to 2024 |
| Projections Period | 2025 to 2035 |
| Quantitative Units | USD million for value |
| Study Designs Analyzed (Segment 1) | Interventional, Observational, Expanded Access |
| Phases Covered (Segment 2) | Phase 1, Phase 2, Phase 3, Phase 4 |
| Regions Covered | North America; Europe; Asia-Pacific; Latin America; Middle East & Africa |
| Key Players Influencing the Market | Pfizer Inc., Novartis AG, Icon Plc, AbbVie Inc., F. Hoffmann-La Roche Ltd, Eli Lilly, GSK plc., Novo Nordisk, Gilead Sciences Inc., Viking Therapeutics |
| Additional Attributes | Dollar sales by study design and phase, regulatory focus on Phase 3 trials, growing number of advanced-stage candidates, contract research organization trends |
| Customization and Pricing | Customization and Pricing Available on Request |
In terms of study design, the industry is divided into Interventional, observational and expanded access.
In terms of phase, the industry is segregated into phase 1, phase 2, phase 3, and phase 4.
Key countries of North America, Latin America, East Asia, South Asia & Pacific, Western Europe, Eastern Europe and Middle East and Africa (MEA) have been covered in the report.
The global non-alcoholic steatohepatitis clinical trials industry is projected to witness CAGR of 7.0% between 2025 and 2035.
The global non-alcoholic steatohepatitis clinical trials industry stood at USD 2,829.5 million in 2024.
The global non-alcoholic steatohepatitis clinical trials industry is anticipated to reach USD 5.81 billion by 2035 end.
China is expected to show a CAGR of 8.3% in the assessment period.
The key players operating in the global non-alcoholic steatohepatitis clinical trials industry Pfizer Inc., Novartis AG, Icon Plc, AbbVie Inc., F. Hoffmann-La Roche Ltd, Eli Lilly, GSK plc., Novo Nordisk, Gilead Sciences Inc., Viking Therapeutics and Others.


Full Research Suite comprises of:
Market outlook & trends analysis
Interviews & case studies
Strategic recommendations
Vendor profiles & capabilities analysis
5-year forecasts
8 regions and 60+ country-level data splits
Market segment data splits
12 months of continuous data updates
DELIVERED AS:
PDF EXCEL ONLINE
Non-alcoholic Steatohepatitis Drugs Pipeline Market Outlook 2025 to 2035
Clinical Chairs Market Size and Share Forecast Outlook 2025 to 2035
Clinical Avian Nutrition Market Analysis - Size, Share, and Forecast Outlook 2025 to 2035
Clinical Workflow Solution Market Size and Share Forecast Outlook 2025 to 2035
Clinical Research Organization Market Size and Share Forecast Outlook 2025 to 2035
Clinical Trial Packaging Market Size and Share Forecast Outlook 2025 to 2035
Clinical Mobility Market Size and Share Forecast Outlook 2025 to 2035
Clinical Immunodiagnostics Market Size and Share Forecast Outlook 2025 to 2035
Clinical Communication and Collaboration Market Size and Share Forecast Outlook 2025 to 2035
Clinical Oncology Next-generation Sequencing Market Analysis - Size, Share, and Forecast 2025 to 2035
Clinical Decision Support Systems Market Size and Share Forecast Outlook 2025 to 2035
Clinical Refractometer Market Size and Share Forecast Outlook 2025 to 2035
Clinical Next-Generation Sequencing (NGS) Data Analysis Market Analysis by Solution and Services, Technology, End User, and Region through 2035
Clinical Hand Hygiene Products Market – Trends, Growth & Forecast 2025 to 2035
The Clinical Alarm Management Market is segmented by component, deployment mode and end user from 2025 to 2035
Clinical Nutrition Market Insights – Trends & Forecast 2025 to 2035
Clinical Diagnostics Market Insights – Size, Share & Forecast 2025 to 2035
Clinical Information System Market Analysis - Growth & Forecast 2024 to 2034
Clinical Chemistry Analyzers Market Trends – Demand & Forecast 2024 to 2034
Clinical Communication & Collaboration Software Market Trends – Forecast through 2034

Thank you!
You will receive an email from our Business Development Manager. Please be sure to check your SPAM/JUNK folder too.
Chat With
MaRIA