Clinical Research Organization Market Analysis Size and Share Forecast Outlook 2023 to 2033

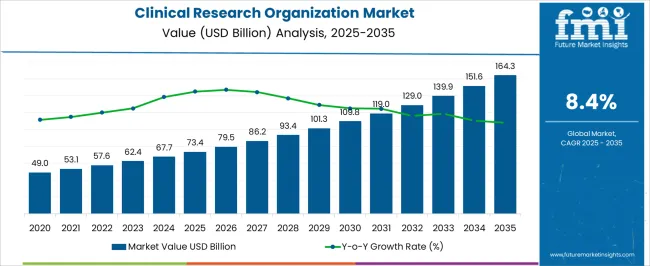
According to Future Market Insights (FMI) analysis in a recent market survey, the global clinical research organization market was valued at USD 58.0 Billion in 2022 and is expected to reach USD 139.6 Billion by 2033.

Market Outlook:

Data Points Market Insights
Market Value 2022 USD 58.02 Billion
Market Value 2023 USD 62.43 Billion
Market Value 2033 USD 139.56 Billion
CAGR 2023 to 2033 8.4%
Share of Top 5 Countries 63.4%
Key Players The key players in the market are Charles River Laboratories, Laboratory Corporation of America Holdings, IQVIA Inc, Parexel International Corporation, ICON plc., Medpace, Syneos Health, CTI Clinical Trial and Consulting Services, Neuroservices Alliance, QPS Neuropharmacology, MD Biosciences, EphyX Neuroscience.

The Clinical Research Organization (CRO) market refers to the industry segment companies and organizations providing clinical research services to pharmaceutical, biotechnology, and medical device companies. It encompasses the commercial activities and financial transactions associated with outsourcing clinical trials and research studies.

The market is driven by the increasing demand for efficient and cost-effective drug development processes. Pharmaceutical and biotech companies often outsource clinical research activities to CROs to leverage their specialized expertise, infrastructure, and resources. This allows the companies to focus on their core competencies, such as drug discovery and marketing, while relying on CROs for the execution of clinical trials.

2018 to 2022 Clinical Research Organization Sales Outlook Compared to Forecast from 2023 to 2033

Sales of the market grew at a CAGR of 6.4% between 2018 to 2022.

With a historical forecast of stable growth, the clinical research organization (CRO) industry has seen significant growth in recent years. The rise in demand for outsourced clinical trials from pharmaceutical, biotechnology, and medical device businesses is what is causing this surge.

The clinical research organization (CRO) market is anticipated to maintain its growth trajectory in the upcoming years, according to the projection. The expansion of the CRO market is anticipated to be fueled by an increase in clinical trials, a rise in the need for personalized medication, and the prevalence of chronic diseases. Various clinical trial processes, including patient recruiting and retention, data analysis, and medication discovery, are using these technologies.

Considering this, FMI expects the global clinical research organization market to grow at a CAGR of 8.4% through the forecasted years.

Opportunities Transforming the CRO Market Landscape

CROs can provide specialized services for carrying out clinical studies in this field as personalized medicine and targeted medicines gain popularity. This covers the identification of biomarkers, patient screening, and customized trial planning. CROs now have more potential due to the use of real-world data and virtual trials.

Companies with expertise in these fields can provide pharma/biotech firms with specialized services and assistance for real-world research as well as for virtual studies, which can shorten the trial duration and expense. It can also include telemedicine and digital health technology in clinical trials to raise study compliance, increase patient participation, and offer ongoing monitoring. CROs can be assisted in adopting these technologies and incorporating them into clinical trial designs by businesses offering specialised services.

They are now also able to provide specialized services in data analytics and machine learning due to the increased availability of real-time data in clinical trials. To do this, one can employ predictive analytics to foresee dangers, spot trends, and improve study design, which thereby helps in the growth of the global market.

Challenges Impacting the Clinical Research Organization Industry

Ensuring compliance with regulatory regulations is one of the biggest issues for CRO businesses. Navigating through each nation's unique legislation can be time-consuming and expensive. To make sure that all applicable regulations are followed, CROs must have a strong regulatory staff.

Companies in the pharma and biotech industries are increasingly looking for CROs that can offer services at a low cost without sacrificing quality or timeliness. To remain competitive, CROs may need to modify their pricing strategies and business models in response to margin concerns.

Large-scale multicenter trials might be difficult to finance since there is sometimes a lack of funding for clinical trials. To maximize the cost-effectiveness of clinical studies, sponsors, researchers, and CROs must collaborate due to the high cost of drug development and growing cost constraints.

The capabilities of CROs may also be constrained by a lack of highly skilled workers, including researchers, data administrators, and statisticians. Lack of qualified personnel may cause inefficiencies, delays in hiring and retaining staff, and a general decline in the quality of project outputs.
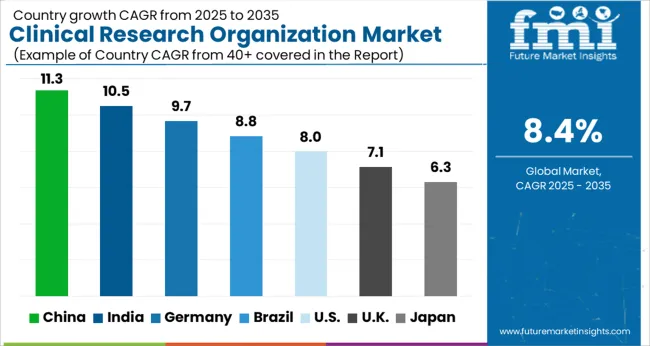
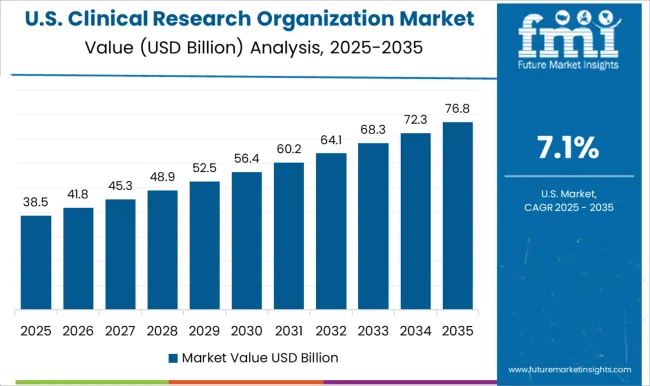
Country-wise Insights into the CRO Sector

What Makes the USA the Dominating Country in the Clinical Research Organization Market?

The USA clinical research organization market is expected to register 32.0% in the global market in 2022.

There are several life science businesses in the United States, and these businesses are embracing innovations in clinical research. CROs that offer these services are in demand as technological innovations like telemedicine and virtual trials are used more frequently. Drug development efforts by biotech and pharmaceutical firms are increasing in the USA These businesses are turning more and more to CROs for assistance, including access to facilities and programs for current patients, enrollment and recruiting information, personalized protocol design, higher trial completion rates, and lower costs.

Why is China considered a Lucrative Market for Clinical Research Organization Services?

China accounted for around 9.3% market share in 2022 globally.

The clinical research organization (CRO) market in China is expanding due to several factors. The rapidly ageing and expanding Chinese population is a significant contributing element, which has raised demand for cutting-edge medical cures and treatments. Furthermore, recent reforms and laws adopted by the Chinese government have made it simpler to conduct clinical trials and research there.

The government has put in place many steps to hasten the regulatory approval procedure for novel pharmaceuticals and therapies, luring multinational companies to locate their research and development operations in the nation. Additionally, the development of healthcare and rising income levels in China have raised the demand for advanced healthcare services, such as clinical research and triage.

What Makes India an Emerging Market for Clinical Research Organization?

India holds a 7.4% value share in the global market in 2022.

The clinical research organization (CRO) market is expanding in India for a variety of reasons. Large and diversified patient populations are a significant contributing element, which makes India a desirable location for carrying out clinical studies. Due to the country's accessible healthcare services and cheaper cost of living, clinical trials in India are also more economical than in many other nations.

The supportive regulatory environment created by the Indian government, which promotes clinical research activities by streamlining the approval procedure for clinical trials and cutting the time needed to secure regulatory approvals, is another important aspect. More foreign money has also been invested in India's clinical research sector as a result of the rise in medical tourism there.

Category-wise Breakdown of Clinical Research Organization Services

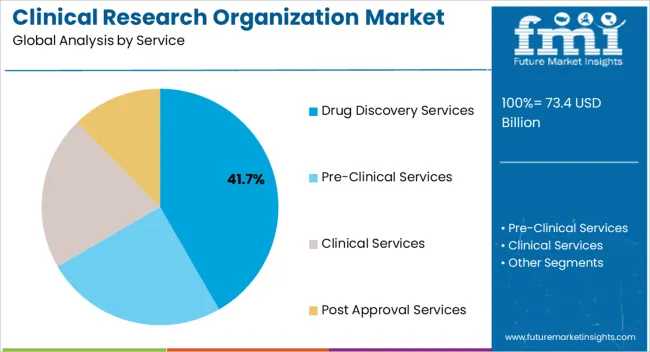
Which Service Is Largely Adopted for Clinical Research Organizations?

The post-approval services segment held the major chunk of about 45.7% of the global market by the end of 2022.

A key factor in the expansion of the clinical research organization (CRO) market is post-approval services. Post-approval services are the actions taken after regulatory bodies or authorities have given their clearance for the use of a product or therapy. These services are essential for maintaining the product's safety and effectiveness as well as for carrying out additional studies that could increase the product or therapy's effectiveness.

In order to diversify their service portfolio and give their clients value-added services, several CROs offer post-approval services. Pharmacovigilance, medical monitoring, safety monitoring, data management, statistical analysis, quality assurance, and regulatory compliance are a few examples of the services that may be provided.

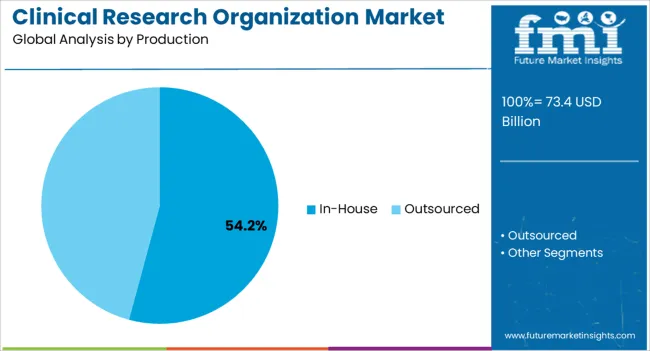
Which production type is largely preferred for the clinical research organization market?

The In-house production segment contribute 58.3% share of the global market in 2022.

The term in-house describes a method of conducting all phases of clinical research within a single organization, often comprising study design, data management, monitoring, and statistical analysis. Clinical research organizations (CRO) market development is still mostly fueled by internal clinical research conducted by pharmaceutical and biotech corporations. The in-house methodology has several benefits, including more control over studies, quicker decision-making, and reduced reliance on outside suppliers.

A pharmaceutical or biotech company's ability to quickly and efficiently react to any noteworthy events or changes in the study protocol can be facilitated by in-house clinical research, which provides better control over study data and technological competence.

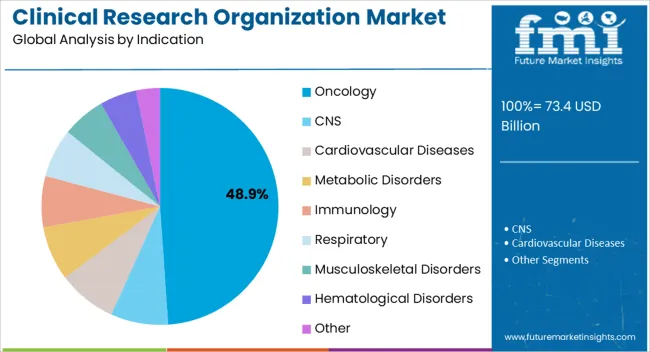
Which Indication Dominates the Global Market in 2022?

The oncology by indication segment accounted for a revenue share of 23.4% in the global market at the end of 2022.

One of the markets for clinical research organizations (CROs) that is expanding the quickest is oncology, which has had a big impact on the development of the sector. Cancer research is an appealing subject for CROs to concentrate their attention on because it is a complex and fast-developing field of medicine that calls for a high degree of knowledge and resources.

Many variables, such as the rising cancer burden globally, developments in molecular biology and genomics, and the creation of more advanced and novel immuno-oncology medicines, all contribute to the expansion of oncology research and the CRO business. The need for more advanced oncology therapies that can address patients' complicated requirements is growing as cancer rates are expected to keep rising.

Which End User Segment Propels the Market Growth?

The pharmaceutical and biotechnology companies hold a share of 45.6% of the global market in 2022.

The market for clinical research organizations (CROs) is expanding mostly due to the efforts of the pharmaceutical and biotechnology industries. These businesses invest a lot of money in the discovery of novel treatments and medications, and they frequently contract out some or all of the clinical research work to CROs to increase productivity and access to funding.

A great deal of financing for clinical research studies-particularly those involving new medicinal compounds-comes from pharmaceutical and biotech corporations. These businesses frequently look to collaborate with CROs who can offer specialized knowledge in research design, data administration, and general project management.

Pharmaceutical and biotech companies can shorten the time it takes to develop new drugs by outsourcing clinical trial efforts to CROs and concentrating internal resources on core research and development tasks.
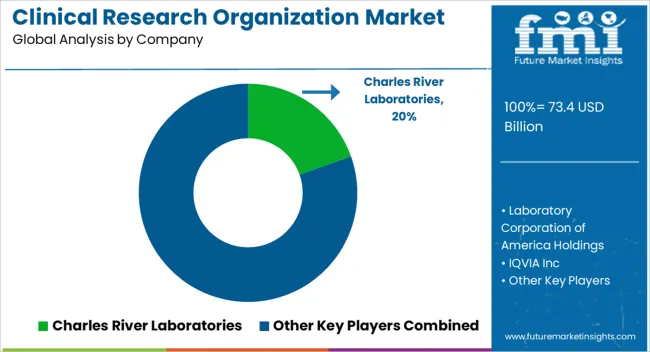
Competitive Landscape in the Clinical Research Organization Market

The market's key vendors are concentrating on diversifying their product offerings to strengthen their market share in clinical research organizations and to broaden their presence in developing nations. Pricing strategies, market strategies, technology improvements, regulatory compliance, and acquisition and distribution agreements with other companies to extend their business are the main tactics used by manufacturers to acquire a competitive edge in the market.

For instance:

  • In January 2020, Charles River announced a scientific collaboration with Takeda Pharmaceutical Company Limited in order to focus on drug discovery in the four core therapeutic areas that Takeda works on. These four therapeutic areas include oncology, gastroenterology, neuroscience, and rare disease. This collaboration focuses on delivering preclinical candidates.
  • In July 2022, Labcorp launched a new test called the neurofilament light chain (NfL) blood test, which will help in the identification and confirmation of neurodegenerative diseases like multiple sclerosis, Alzheimer’s disease, Parkinson’s disease, and others.

Similarly, recent developments have been tracked by the team at Future Market Insights related to companies in the clinical research organization market space, which are available in the full report

Scope of the Clinical Research Organization Market Report

Attribute Details
Forecast Period 2023 to 2033
Historical Data Available for 2018 to 2022
Market Analysis USD Million for Value
Key Regions Covered North America; Latin America; Europe; South Asia; East Asia; Oceania; Middle East; and Africa (MEA)
Key Countries Covered USA, Canada, Brazil, Mexico, Argentina, Germany, UK, France, Italy, Spain, Russia, BENELUX, Nordics, China, Japan, South Korea, India, Thailand, Indonesia, Malaysia, Philippines, Vietnam, Australia, New Zealand, Türkiye, South Africa, North Africa, and GCC Countries
Key Segments Covered Service, Production, Indication, End User, and Region
Key Companies Profiled Charles River Laboratories; Laboratory Corporation of America Holdings; IQVIA Inc; Parexel International Corporation; ICON plc.; Medpace, Syneos Health; CTI Clinical Trial and Consulting Services; Neuroservices Alliance; QPS Neuropharmacology; MD Biosciences; EphyX Neuroscience
Report Coverage Market Forecast, Competition Intelligence, DROT Analysis, Market Dynamics and Challenges, Strategic Growth Initiatives
Customization & Pricing Available upon Request

Top Investment Segments in the CRO Industry

By Service:

  • Drug discovery Services
  • Pre-clinical Services
  • Clinical Services
  • Post Approval Services

By Production:

  • In-house
  • Outsourced

By Indication:

  • Oncology
  • CNS
  • Cardiovascular Diseases
  • Metabolic Disorders
  • Immunology
  • Respiratory
  • Musculoskeletal Disorders
  • Hematological Disorders
  • Other

By End User:

  • Pharmaceutical & Biotechnology Companies
  • Medical Device Companies
  • Governments & Private Firms
  • Academic Institutions
  • Others

By Region:

  • North America
  • Latin America
  • Europe
  • South Asia
  • East Asia
  • Oceania
  • Middle East and Africa (MEA)

Table of Content

  • 1. Global Market - Executive Summary
  • 2. Market Overview
  • 3. Key Market Trends
  • 4. Value-Added Insights
  • 5. Market Background
  • 6. COVID-19 Crisis Analysis
  • 7. Global Market Demand (in Value USD Million) Analysis 2018 to 2022 and Forecast, 2023 to 2033
  • 8. Global Market Analysis 2018 to 2022 and Forecast 2023 to 2033, by Service
    • 8.1. Drug Discovery Services
    • 8.2. Pre-clinical Services
    • 8.3. Clinical Services
    • 8.4. Post Approval Services
  • 9. Global Market Analysis 2018 to 2022 and Forecast 2023 to 2033, by Production
    • 9.1. In-house
    • 9.2. Outsourced
  • 10. Global Market Analysis 2018 to 2022 and Forecast 2023 to 2033, By Indication
    • 10.1. Oncology
    • 10.2. CNS
    • 10.3. Cardiovascular Diseases
    • 10.4. Metabolic Disorders
    • 10.5. Immunology
    • 10.6. Respiratory
    • 10.7. Musculoskeletal Disorders
    • 10.8. Hematological Disorders
    • 10.9. Others
  • 11. Global Market Analysis 2018 to 2022 and Forecast 2023 to 2033, By End User
    • 11.1. Medical Device Companies
    • 11.2. Governments & Private Firms
    • 11.3. Academic Institutions
  • 12. Global Market Analysis 2018 to 2022 and Forecast 2023 to 2033, by Region
    • 12.1. North America
    • 12.2. Latin America
    • 12.3. Europe
    • 12.4. South Asia
    • 12.5. East Asia
    • 12.6. Oceania
    • 12.7. Middle East & Africa (MEA)
  • 13. North America Market Analysis 2018 to 2022 and Forecast 2023 to 2033
  • 14. Latin America Market Analysis 2018 to 2022 and Forecast 2023 to 2033
  • 15. Europe Market Analysis 2018 to 2022 and Forecast 2023 to 2033
  • 16. South Asia Market Analysis 2018 to 2022 and Forecast 2023 to 2033
  • 17. East Asia Market Analysis 2018 to 2022 and Forecast 2023 to 2033
  • 18. Oceania Market Analysis 2018 to 2022 and Forecast 2023 to 2033
  • 19. Middle East & Africa Market Analysis 2018 to 2022 and Forecast 2023 to 2033
  • 20. Competition Analysis
    • 20.1. Charles River Laboratories
    • 20.2. Laboratory Corporation of America Holdings
    • 20.3. IQVIA Inc
    • 20.4. Parexel International Corporation
    • 20.5. ICON plc
    • 20.6. Medpace, Syneos Health
    • 20.7. CTI Clinical Trial and Consulting Services
    • 20.8. Neuro Services Alliance
    • 20.9. QPS Neuropharmacology
    • 20.10. MD Biosciences
    • 20.11. EphyX Neuroscience
  • 21. Assumptions and Acronyms Used
  • 22. Research Methodology

List of Tables

Table 01: Global Market Size (US$ Million) Analysis 2018 to 2022 and Forecast 2023 to 2033, By Production

Table 02: Global Market Size (US$ Million) Analysis 2018 to 2022 and Forecast 2023 to 2033, By Production

Table 03: Global Market Size (US$ Million) Analysis 2018 to 2022 and Forecast 2023 to 2033, By Production

Table 04: Global Market Size (US$ Million) Analysis 2018 to 2022 and Forecast 2023 to 2033, By Production

Table 05: Global Market Size (US$ Million) Analysis 2018 to 2022 and Forecast 2023 to 2033, By Service

Table 06: Global Market Size (US$ Million) Analysis 2018 to 2022 and Forecast 2023 to 2033, By Service

Table 07: Global Market Size (US$ Million) Analysis 2018 to 2022 and Forecast 2023 to 2033, By Indication

Table 08: Global Market Size (US$ Million) Analysis 2018 to 2022 and Forecast 2023 to 2033, By Indication

Table 09: Global Market Size (US$ Million) Analysis 2018 to 2022 and Forecast 2023 to 2033, By End User

Table 10: Global Market Size (US$ Million) Analysis 2018 to 2022 and Forecast 2023 to 2033, By End User

Table 11: Global Market Size (US$ Million) Analysis 2018 to 2022 and Forecast 2023 to 2033, By Region

Table 12: Global Market Size (US$ Million) Analysis 2018 to 2022 and Forecast 2023 to 2033, By Region

Table 13: North America Market Size (US$ Million) Analysis 2018 to 2022 and Forecast 2023 to 2033, By Country

Table 14: North America Market Size (US$ Million) Analysis 2018 to 2022 and Forecast 2023 to 2033, By Country

Table 15: North America Market Size (US$ Million) Analysis 2018 to 2022 and Forecast 2023 to 2033, By Production

Table 16: North America Market Size (US$ Million) Analysis 2018 to 2022 and Forecast 2023 to 2033, By Production

Table 17: North America Market Size (US$ Million) Analysis 2018 to 2022 and Forecast 2023 to 2033, By Production

Table 18: North America Market Size (US$ Million) Analysis 2018 to 2022 and Forecast 2023 to 2033, By Production

Table 19: North America Market Size (US$ Million) Analysis 2018 to 2022 and Forecast 2023 to 2033, By Service

Table 20: North America Market Size (US$ Million) Analysis 2018 to 2022 and Forecast 2023 to 2033, By Service

Table 21: North America Market Size (US$ Million) Analysis 2018 to 2022 and Forecast 2023 to 2033, By Indication

Table 22: North America Market Size (US$ Million) Analysis 2018 to 2022 and Forecast 2023 to 2033, By Indication

Table 23: North America Market Size (US$ Million) Analysis 2018 to 2022 and Forecast 2023 to 2033, By End User

Table 24: North America Market Size (US$ Million) Analysis 2018 to 2022 and Forecast 2023 to 2033, By End User

Table 25: Latin America Market Size (US$ Million) Analysis 2018 to 2022 and Forecast 2023 to 2033, By Country

Table 26: Latin America Market Size (US$ Million) Analysis 2018 to 2022 and Forecast 2023 to 2033, By Country

Table 27: Latin America Market Size (US$ Million) Analysis 2018 to 2022 and Forecast 2023 to 2033, By Production

Table 28: Latin America Market Size (US$ Million) Analysis 2018 to 2022 and Forecast 2023 to 2033, By Production

Table 29: Latin America Market Size (US$ Million) Analysis 2018 to 2022 and Forecast 2023 to 2033, By Production

Table 30: Latin America Market Size (US$ Million) Analysis 2018 to 2022 and Forecast 2023 to 2033, By Production

Table 31: Latin America Market Size (US$ Million) Analysis 2018 to 2022 and Forecast 2023 to 2033, By Service

Table 32: Latin America Market Size (US$ Million) Analysis 2018 to 2022 and Forecast 2023 to 2033, By Service

Table 33: Latin America Market Size (US$ Million) Analysis 2018 to 2022 and Forecast 2023 to 2033, By Indication

Table 34: Latin America Market Size (US$ Million) Analysis 2018 to 2022 and Forecast 2023 to 2033, By Indication

Table 35: Latin America Market Size (US$ Million) Analysis 2018 to 2022 and Forecast 2023 to 2033, By End User

Table 36: Latin America Market Size (US$ Million) Analysis 2018 to 2022 and Forecast 2023 to 2033, By End User

Table 37: Europe Market Size (US$ Million) Analysis 2018 to 2022 and Forecast 2023 to 2033, By Country

Table 38: Europe Market Size (US$ Million) Analysis 2018 to 2022 and Forecast 2023 to 2033, By Country

Table 39: Europe Market Size (US$ Million) Analysis 2018 to 2022 and Forecast 2023 to 2033, By Production

Table 40: Europe Market Size (US$ Million) Analysis 2018 to 2022 and Forecast 2023 to 2033, By Production

Table 41: Europe Market Size (US$ Million) Analysis 2018 to 2022 and Forecast 2023 to 2033, By Production

Table 42: Europe Market Size (US$ Million) Analysis 2018 to 2022 and Forecast 2023 to 2033, By Production

Table 43: Europe Market Size (US$ Million) Analysis 2018 to 2022 and Forecast 2023 to 2033, By Service

Table 44: Europe Market Size (US$ Million) Analysis 2018 to 2022 and Forecast 2023 to 2033, By Service

Table 45: Europe Market Size (US$ Million) Analysis 2018 to 2022 and Forecast 2023 to 2033, By Indication

Table 46: Europe Market Size (US$ Million) Analysis 2018 to 2022 and Forecast 2023 to 2033, By Indication

Table 47: Europe Market Size (US$ Million) Analysis 2018 to 2022 and Forecast 2023 to 2033, By End User

Table 48: Europe Market Size (US$ Million) Analysis 2018 to 2022 and Forecast 2023 to 2033, By End User

Table 49: South Asia Market Size (US$ Million) Analysis 2018 to 2022 and Forecast 2023 to 2033, By Country

Table 50: South Asia Market Size (US$ Million) Analysis 2018 to 2022 and Forecast 2023 to 2033, By Country

Table 51: South Asia Market Size (US$ Million) Analysis 2018 to 2022 and Forecast 2023 to 2033, By Production

Table 52: South Asia Market Size (US$ Million) Analysis 2018 to 2022 and Forecast 2023 to 2033, By Production

Table 53: South Asia Market Size (US$ Million) Analysis 2018 to 2022 and Forecast 2023 to 2033, By Production

Table 54: South Asia Market Size (US$ Million) Analysis 2018 to 2022 and Forecast 2023 to 2033, By Production

Table 55: South Asia Market Size (US$ Million) Analysis 2018 to 2022 and Forecast 2023 to 2033, By Service

Table 56: South Asia Market Size (US$ Million) Analysis 2018 to 2022 and Forecast 2023 to 2033, By Service

Table 57: South Asia Market Size (US$ Million) Analysis 2018 to 2022 and Forecast 2023 to 2033, By Indication

Table 58: South Asia Market Size (US$ Million) Analysis 2018 to 2022 and Forecast 2023 to 2033, By Indication

Table 59: South Asia Market Size (US$ Million) Analysis 2018 to 2022 and Forecast 2023 to 2033, By End User

Table 60: South Asia Market Size (US$ Million) Analysis 2018 to 2022 and Forecast 2023 to 2033, By End User

Table 61: East Asia Market Size (US$ Million) Analysis 2018 to 2022 and Forecast 2023 to 2033, By Country

Table 62: East Asia Market Size (US$ Million) Analysis 2018 to 2022 and Forecast 2023 to 2033, By Country

Table 63: East Asia Market Size (US$ Million) Analysis 2018 to 2022 and Forecast 2023 to 2033, By Production

Table 64: East Asia Market Size (US$ Million) Analysis 2018 to 2022 and Forecast 2023 to 2033, By Production

Table 65: East Asia Market Size (US$ Million) Analysis 2018 to 2022 and Forecast 2023 to 2033, By Production

Table 66: East Asia Market Size (US$ Million) Analysis 2018 to 2022 and Forecast 2023 to 2033, By Production

Table 67: East Asia Market Size (US$ Million) Analysis 2018 to 2022 and Forecast 2023 to 2033, By Service

Table 68: East Asia Market Size (US$ Million) Analysis 2018 to 2022 and Forecast 2023 to 2033, By Service

Table 69: East Asia Market Size (US$ Million) Analysis 2018 to 2022 and Forecast 2023 to 2033, By Indication

Table 70: East Asia Market Size (US$ Million) Analysis 2018 to 2022 and Forecast 2023 to 2033, By Indication

Table 71: East Asia Market Size (US$ Million) Analysis 2018 to 2022 and Forecast 2023 to 2033, By End User

Table 72: East Asia Market Size (US$ Million) Analysis 2018 to 2022 and Forecast 2023 to 2033, By End User

Table 73: Oceania Market Size (US$ Million) Analysis 2018 to 2022 and Forecast 2023 to 2033, By Country

Table 74: Oceania Market Size (US$ Million) Analysis 2018 to 2022 and Forecast 2023 to 2033, By Country

Table 75: Oceania Market Size (US$ Million) Analysis 2018 to 2022 and Forecast 2023 to 2033, By Production

Table 76: Oceania Market Size (US$ Million) Analysis 2018 to 2022 and Forecast 2023 to 2033, By Production

Table 77: Oceania Market Size (US$ Million) Analysis 2018 to 2022 and Forecast 2023 to 2033, By Production

Table 78: Oceania Market Size (US$ Million) Analysis 2018 to 2022 and Forecast 2023 to 2033, By Production

Table 79: Oceania Market Size (US$ Million) Analysis 2018 to 2022 and Forecast 2023 to 2033, By Service

Table 80: Oceania Market Size (US$ Million) Analysis 2018 to 2022 and Forecast 2023 to 2033, By Service

Table 81: Oceania Market Size (US$ Million) Analysis 2018 to 2022 and Forecast 2023 to 2033, By Indication

Table 82: Oceania Market Size (US$ Million) Analysis 2018 to 2022 and Forecast 2023 to 2033, By Indication

Table 83: Oceania Market Size (US$ Million) Analysis 2018 to 2022 and Forecast 2023 to 2033, By End User

Table 84: Oceania Market Size (US$ Million) Analysis 2018 to 2022 and Forecast 2023 to 2033, By End User

Table 85: Middle East and Africa Market Size (US$ Million) Analysis 2018 to 2022 and Forecast 2023 to 2033, By Country

Table 86: Middle East and Africa Market Size (US$ Million) Analysis 2018 to 2022 and Forecast 2023 to 2033, By Country

Table 87: Middle East & Africa Market Size (US$ Million) Analysis 2018 to 2022 and Forecast 2023 to 2033, By Production

Table 88: Middle East & Africa Market Size (US$ Million) Analysis 2018 to 2022 and Forecast 2023 to 2033, By Production

Table 89: Middle East & Africa Market Size (US$ Million) Analysis 2018 to 2022 and Forecast 2023 to 2033, By Production

Table 90: Middle East & Africa Market Size (US$ Million) Analysis 2018 to 2022 and Forecast 2023 to 2033, By Production

Table 91: Middle East & Africa Market Size (US$ Million) Analysis 2018 to 2022 and Forecast 2023 to 2033, By Service

Table 92: Middle East & Africa Market Size (US$ Million) Analysis 2018 to 2022 and Forecast 2023 to 2033, By Service

Table 93: Middle East & Africa Market Size (US$ Million) Analysis 2018 to 2022 and Forecast 2023 to 2033, By Indication

Table 94: Middle East & Africa Market Size (US$ Million) Analysis 2018 to 2022 and Forecast 2023 to 2033, By Indication

Table 95: Middle East & Africa Market Size (US$ Million) Analysis 2018 to 2022 and Forecast 2023 to 2033, By End User

Table 96: Middle East & Africa Market Size (US$ Million) Analysis 2018 to 2022 and Forecast 2023 to 2033, By End User

List of Figures

Figure 1: Global Market Size (US$ Million) Analysis, 2018 to 2022

Figure 2: Global Market Size (US$ Million) & Y-o-Y Growth (%) Analysis, 2023 to 2033

Figure 3: Global Market Absolute $ Opportunity Analysis, 2022 to 2033

Figure 4: Global Market Analysis By Production -2022 & 2033

Figure 5: Global Market Y-o-Y Growth Projections By Production, 2023 to 2033

Figure 6: Global Market Attractiveness, By Production, 2023 to 2033

Figure 7: Global Market Analysis By Service 2022 & 2033

Figure 8: Global Market Y-o-Y Growth Projections By Service, 2023 to 2033

Figure 9: Global Market Attractiveness, By Service, 2023 to 2033

Figure 10: Global Market Analysis by Indication -2022 & 2033

Figure 11: Global Market Y-o-Y Growth Projections by Indication, 2023 to 2033

Figure 12: Global Market Attractiveness, by Indication, 2023 to 2033

Figure 13: Global Market Analysis By End User-2022 & 2033

Figure 14: Global Market Y-o-Y Growth Projections By End User, 2023 to 2033

Figure 15: Global Market Attractiveness, By End User, 2023 to 2033

Figure 16: Global Market Analysis by Region-2022 & 2033

Figure 17: Global Market Y-o-Y Growth Projections by Region, 2023 to 2033

Figure 18: Global Market Attractiveness, By Region, 2023 to 2033

Figure 19: North America Market Value Share, By Production 2023 (E)

Figure 20: North America Market Value Share, By Service 2023 (E)

Figure 21: North America Market Value Share, by Indication 2023 (E)

Figure 22: North America Market Value Share, by End User 2023 (E)

Figure 23: North America Market Value Share, by Country 2023 (E)

Figure 24: North America Market Size (US$ Million) Analysis, 2018 to 2022

Figure 25: North America Market Size (US$ Million) & Y-o-Y Growth (%) Analysis, 2023 to 2033

Figure 26: North America Market Attractiveness Analysis, by Country

Figure 27: North America Market Attractiveness Analysis, By Production

Figure 28: North America Market Attractiveness Analysis, By Service

Figure 29: North America Market Attractiveness Analysis, by Indication

Figure 30: North America Market Attractiveness Analysis, By End User

Figure 31: USA Market Value Proportion Analysis, 2022

Figure 32: Global Vs. USA Growth Comparison, 2022 to 2033

Figure 33: USA Market Share Analysis (%), By Production, 2022 & 2033

Figure 34: USA Market Share Analysis (%), By Service, 2022 & 2033

Figure 35: USA Market Share Analysis (%), By Indication, 2022 & 2033

Figure 36: USA Market Share Analysis (%), By End User, 2022 & 2033

Figure 37: Canada Market Value Proportion Analysis, 2022

Figure 38: Global Vs. Canada Growth Comparison, 2022 to 2033

Figure 39: Canada Market Share Analysis (%), By Production, 2022 & 2033

Figure 40: Canada Market Share Analysis (%), By Service, 2022 & 2033

Figure 41: Canada Market Share Analysis (%), By Indication, 2022 & 2033

Figure 42: Canada Market Share Analysis (%), By End User, 2022 & 2033

Figure 43: Latin America Market Value Share, By Production 2023 (E)

Figure 44: Latin America Market Value Share, By Service 2023 (E)

Figure 45: Latin America Market Value Share, by Indication 2023 (E)

Figure 46: Latin America Market Value Share, by End User 2023 (E)

Figure 47: Latin America Market Value Share, by Country 2023 (E)

Figure 48: Latin America Market Size (US$ Million) Analysis, 2018 to 2022

Figure 49: Latin America Market Size (US$ Million) & Y-o-Y Growth (%) Analysis, 2023 to 2033

Figure 50: Latin America Market Attractiveness Analysis, by Country

Figure 51: Latin America Market Attractiveness Analysis, By Production

Figure 52: Latin America Market Attractiveness Analysis, By Service

Figure 53: Latin America Market Attractiveness Analysis, by Indication

Figure 54: Latin America Market Attractiveness Analysis, By End User

Figure 55: Brazil Market Value Proportion Analysis, 2022

Figure 56: Global Vs. Brazil Growth Comparison, 2022 to 2033

Figure 57: Brazil Market Share Analysis (%), By Production, 2022 & 2033

Figure 58: Brazil Market Share Analysis (%), By Service, 2022 & 2033

Figure 59: Brazil Market Share Analysis (%), By Indication, 2022 & 2033

Figure 60: Brazil Market Share Analysis (%), By End User, 2022 & 2033

Figure 61: Mexico Market Value Proportion Analysis, 2022

Figure 62: Global Vs. Mexico Growth Comparison, 2022 to 2033

Figure 63: Mexico Market Share Analysis (%), By Production, 2022 & 2033

Figure 64: Mexico Market Share Analysis (%), By Service, 2022 & 2033

Figure 65: Mexico Market Share Analysis (%), By Indication, 2022 & 2033

Figure 66: Mexico Market Share Analysis (%), By End User, 2022 & 2033

Figure 67: Argentina Market Value Proportion Analysis, 2022

Figure 68: Global Vs. Argentina Growth Comparison, 2022 to 2033

Figure 69: Argentina Market Share Analysis (%), By Production, 2022 & 2033

Figure 70: Argentina Market Share Analysis (%), By Service, 2022 & 2033

Figure 71: Argentina Market Share Analysis (%), By Indication, 2022 & 2033

Figure 72: Argentina Market Share Analysis (%), By End User, 2022 & 2033

Figure 73: Europe Market Value Share, By Production 2023 (E)

Figure 74: Europe Market Value Share, By Service 2023 (E)

Figure 75: Europe Market Value Share, by Indication 2023 (E)

Figure 76: Europe Market Value Share, by End User 2023 (E)

Figure 77: Europe Market Value Share, by Country 2023 (E)

Figure 78: Europe Market Size (US$ Million) Analysis, 2018 to 2022

Figure 79: Europe Market Size (US$ Million) & Y-o-Y Growth (%) Analysis, 2023 to 2033

Figure 80: Europe Market Attractiveness Analysis, by Country

Figure 81: Europe Market Attractiveness Analysis, By Production

Figure 82: Europe Market Attractiveness Analysis, By Service

Figure 83: Europe Market Attractiveness Analysis, By Indication

Figure 84: Europe Market Attractiveness Analysis, By End User

Figure 85: Germany Market Value Proportion Analysis, 2022

Figure 86: Global Vs. Germany Growth Comparison, 2022 to 2033

Figure 87: Germany Market Share Analysis (%), By Production, 2022 & 2033

Figure 88: Germany Market Share Analysis (%), By Service, 2022 & 2033

Figure 89: Germany Market Share Analysis (%), By Indication, 2022 & 2033

Figure 90: Germany Market Share Analysis (%), By End User, 2022 & 2033

Figure 91: Italy Market Value Proportion Analysis, 2022

Figure 92: Global Vs. Italy Growth Comparison, 2022 to 2033

Figure 93: Italy Market Share Analysis (%), By Production, 2022 & 2033

Figure 94: Italy Market Share Analysis (%), By Service, 2022 & 2033

Figure 95: Italy Market Share Analysis (%), By Indication, 2022 & 2033

Figure 96: Italy Market Share Analysis (%), By End User, 2022 & 2033

Figure 97: France Market Value Proportion Analysis, 2022

Figure 98: Global Vs. France Growth Comparison, 2022 to 2033

Figure 99: France Market Share Analysis (%), By Production, 2022 & 2033

Figure 100: France Market Share Analysis (%), By Service, 2022 & 2033

Figure 101: France Market Share Analysis (%), By Indication, 2022 & 2033

Figure 102: France Market Share Analysis (%), By End User, 2022 & 2033

Figure 103: UK Market Value Proportion Analysis, 2022

Figure 104: Global Vs. UK Growth Comparison, 2022 to 2033

Figure 105: UK Market Share Analysis (%), By Production, 2022 & 2033

Figure 106: UK Market Share Analysis (%), By Service, 2022 & 2033

Figure 107: UK Market Share Analysis (%), By Indication, 2022 & 2033

Figure 108: UK Market Share Analysis (%), By End User, 2022 & 2033

Figure 109: Spain Market Value Proportion Analysis, 2022

Figure 110: Global Vs. Spain Growth Comparison, 2022 to 2033

Figure 111: Spain Market Share Analysis (%), By Production, 2022 & 2033

Figure 112: Spain Market Share Analysis (%), By Service, 2022 & 2033

Figure 113: Spain Market Share Analysis (%), By Indication, 2022 & 2033

Figure 114: Spain Market Share Analysis (%), By End User, 2022 & 2033

Figure 115: BENELUX Market Value Proportion Analysis, 2022

Figure 116: Global Vs. BENELUX Growth Comparison, 2022 to 2033

Figure 117: BENELUX Market Share Analysis (%), By Production, 2022 & 2033

Figure 118: BENELUX Market Share Analysis (%), By Service, 2022 & 2033

Figure 119: BENELUX Market Share Analysis (%), By Indication, 2022 & 2033

Figure 120: BENELUX Market Share Analysis (%), By End User, 2022 & 2033

Figure 121: Nordic Countries Market Value Proportion Analysis, 2022

Figure 122: Global Vs. Nordic Countries Growth Comparison, 2022 to 2033

Figure 123: Nordic Countries Market Share Analysis (%), By Production, 2022 & 2033

Figure 124: Nordic Countries Market Share Analysis (%), By Service, 2022 & 2033

Figure 125: Nordic Countries Market Share Analysis (%), By Indication, 2022 & 2033

Figure 126: Nordic Countries Market Share Analysis (%), By End User, 2022 & 2033

Figure 127: Russia Market Value Proportion Analysis, 2022

Figure 128: Global Vs. Russia Growth Comparison, 2022 to 2033

Figure 129: Russia Market Share Analysis (%), By Production, 2022 & 2033

Figure 130: Russia Market Share Analysis (%), By Service, 2022 & 2033

Figure 131: Russia Market Share Analysis (%), By Indication, 2022 & 2033

Figure 132: Russia Market Share Analysis (%), By End User, 2022 & 2033

Figure 133: South Asia Market Value Share, By Production 2023 (E)

Figure 134: South Asia Market Value Share, By Service 2023 (E)

Figure 135: South Asia Market Value Share, by Indication 2023 (E)

Figure 136: South Asia Market Value Share, by End User 2023 (E)

Figure 137: South Asia Market Value Share, by Country 2023 (E)

Figure 138: South Asia Market Size (US$ Million) Analysis, 2018 to 2022

Figure 139: South Asia Market Size (US$ Million) & Y-o-Y Growth (%) Analysis, 2023 to 2033

Figure 140: South Asia Market Attractiveness Analysis, by Country

Figure 141: South Asia Market Attractiveness Analysis, By Production

Figure 142: South Asia Market Attractiveness Analysis, By Service

Figure 143: South Asia Market Attractiveness Analysis, by Indication

Figure 144: South Asia Market Attractiveness Analysis, By End User

Figure 145: India Market Value Proportion Analysis, 2022

Figure 146: Global Vs. India Growth Comparison, 2022 to 2033

Figure 147: India Market Share Analysis (%), By Production, 2022 & 2033

Figure 148: India Market Share Analysis (%), By Service, 2022 & 2033

Figure 149: India Market Share Analysis (%), By Indication, 2022 & 2033

Figure 150: India Market Share Analysis (%), By End User, 2022 & 2033

Figure 151: Thailand Market Value Proportion Analysis, 2022

Figure 152: Global Vs. Thailand Growth Comparison, 2022 to 2033

Figure 153: Thailand Market Share Analysis (%), By Production, 2022 & 2033

Figure 154: Thailand Market Share Analysis (%), By Service, 2022 & 2033

Figure 155: Thailand Market Share Analysis (%), By Indication, 2022 & 2033

Figure 156: Thailand Market Share Analysis (%), By End User, 2022 & 2033

Figure 157: Indonesia Market Value Proportion Analysis, 2022

Figure 158: Global Vs. Indonesia Growth Comparison, 2022 to 2033

Figure 159: Indonesia Market Share Analysis (%), By Production, 2022 & 2033

Figure 160: Indonesia Market Share Analysis (%), By Service, 2022 & 2033

Figure 161: Indonesia Market Share Analysis (%), By Indication, 2022 & 2033

Figure 162: Indonesia Market Share Analysis (%), By End User, 2022 & 2033

Figure 163: Malaysia Market Value Proportion Analysis, 2022

Figure 164: Global Vs. Malaysia Growth Comparison, 2022 to 2033

Figure 165: Malaysia Market Share Analysis (%), By Production, 2022 & 2033

Figure 166: Malaysia Market Share Analysis (%), By Service, 2022 & 2033

Figure 167: Malaysia Market Share Analysis (%), By Indication, 2022 & 2033

Figure 168: Malaysia Market Share Analysis (%), By End User, 2022 & 2033

Figure 169: Philippines Market Value Proportion Analysis, 2022

Figure 170: Global Vs. Philippines Growth Comparison, 2022 to 2033

Figure 171: Philippines Market Share Analysis (%), By Production, 2022 & 2033

Figure 172: Philippines Market Share Analysis (%), By Service, 2022 & 2033

Figure 173: Philippines Market Share Analysis (%), By Indication, 2022 & 2033

Figure 174: Philippines Market Share Analysis (%), By End User, 2022 & 2033

Figure 175: Vietnam Market Value Proportion Analysis, 2022

Figure 176: Global Vs. Vietnam Growth Comparison, 2022 to 2033

Figure 177: Vietnam Market Share Analysis (%), By Production, 2022 & 2033

Figure 178: Vietnam Market Share Analysis (%), By Service, 2022 & 2033

Figure 179: Vietnam Market Share Analysis (%), By Indication, 2022 & 2033

Figure 180: Vietnam Market Share Analysis (%), By End User, 2022 & 2033

Figure 181: East Asia Market Value Share, By Production 2023 (E)

Figure 182: East Asia Market Value Share, By Service 2023 (E)

Figure 183: East Asia Market Value Share, by Indication 2023 (E)

Figure 184: East Asia Market Value Share, by End User 2023 (E)

Figure 185: East Asia Market Value Share, by Country 2023 (E)

Figure 186: East Asia Market Size (US$ Million) Analysis, 2018 to 2022

Figure 187: East Asia Market Size (US$ Million) & Y-o-Y Growth (%) Analysis, 2023 to 2033

Figure 188: East Asia Market Attractiveness Analysis, by Country

Figure 189: East Asia Market Attractiveness Analysis, By Production

Figure 190: East Asia Market Attractiveness, By Service

Figure 191: East Asia Market Attractiveness Analysis, by Indication

Figure 192: East Asia Market Attractiveness Analysis, By End User

Figure 193: China Market Value Proportion Analysis, 2022

Figure 194: Global Vs. China Growth Comparison, 2022 to 2033

Figure 195: China Market Share Analysis (%), By Production, 2022 & 2033

Figure 196: China Market Share Analysis (%), By Service, 2022 & 2033

Figure 197: China Market Share Analysis (%), By Indication, 2022 & 2033

Figure 198: China Market Share Analysis (%), By End User, 2022 & 2033

Figure 199: Japan Market Value Proportion Analysis, 2022

Figure 200: Global Vs. Japan Growth Comparison, 2022 to 2033

Figure 201: Japan Market Share Analysis (%), By Production, 2022 & 2033

Figure 202: Japan Market Share Analysis (%), By Service, 2022 & 2033

Figure 203: Japan Market Share Analysis (%), By Indication, 2022 & 2033

Figure 204: Japan Market Share Analysis (%), By End User, 2022 & 2033

Figure 205: South Korea Market Value Proportion Analysis, 2022

Figure 206: Global Vs. South Korea Growth Comparison, 2022 to 2033

Figure 207: South Korea Market Share Analysis (%), By Production, 2022 & 2033

Figure 208: South Korea Market Share Analysis (%), By Service, 2022 & 2033

Figure 209: South Korea Market Share Analysis (%), By Indication, 2022 & 2033

Figure 210: South Korea Market Share Analysis (%), By End User, 2022 & 2033

Figure 211: Oceania Market Value Share, By Production 2023 (E)

Figure 212: Oceania Market Value Share, By Service 2023 (E)

Figure 213: Oceania Market Value Share, by Indication 2023 (E)

Figure 214: Oceania Market Value Share, by End User 2023 (E)

Figure 215: Oceania Market Value Share, by Country 2023 (E)

Figure 216: Oceania Market Size (US$ Million) Analysis, 2018 to 2022

Figure 217: Oceania Market Size (US$ Million) & Y-o-Y Growth (%) Analysis, 2023 to 2033

Figure 218: Oceania Market Attractiveness Analysis, by Country

Figure 219: Oceania Market Attractiveness Analysis, By Production

Figure 220: Oceania Market Attractiveness, By Service

Figure 221: Oceania Market Attractiveness Analysis, by Indication

Figure 222: Oceania Market Attractiveness Analysis, By End User

Figure 223: Australia Market Value Proportion Analysis, 2022

Figure 224: Global Vs. Australia Growth Comparison, 2022 to 2033

Figure 225: Australia Market Share Analysis (%), By Production, 2022 & 2033

Figure 226: Australia Market Share Analysis (%), By Service, 2022 & 2033

Figure 227: Australia Market Share Analysis (%), By Indication, 2022 & 2033

Figure 228: Australia Market Share Analysis (%), By End User, 2022 & 2033

Figure 229: New Zealand Market Value Proportion Analysis, 2022

Figure 230: Global Vs. New Zealand Growth Comparison, 2022 to 2033

Figure 231: New Zealand Market Share Analysis (%), By Production, 2022 & 2033

Figure 232: New Zealand Market Share Analysis (%), By Service, 2022 & 2033

Figure 233: New Zealand Market Share Analysis (%), By Indication, 2022 & 2033

Figure 234: New Zealand Market Share Analysis (%), By End User, 2022 & 2033

Figure 235: Middle East & Africa Market Value Share, By Production 2023 (E)

Figure 236: Middle East & Africa Market Value Share, By Service 2023 (E)

Figure 237: Middle East & Africa Market Value Share, by Indication 2023 (E)

Figure 238: Middle East & Africa Market Value Share, by End User 2023 (E)

Figure 239: Middle East & Africa Market Value Share, by Country 2023 (E)

Figure 240: Middle East & Africa Market Size (US$ Million) Analysis, 2018 to 2022

Figure 241: Middle East & Africa Market Size (US$ Million) & Y-o-Y Growth (%) Analysis, 2023 to 2033

Figure 242: Middle East & Africa Market Attractiveness Analysis, by Country

Figure 243: Middle East & Africa Market Attractiveness Analysis, By Production

Figure 244: Middle East & Africa Market Attractiveness Analysis, By Service

Figure 245: Middle East & Africa Market Attractiveness Analysis, by Indication

Figure 246: Middle East & Africa Market Attractiveness Analysis, By End User

Figure 247: GCC Countries Market Value Proportion Analysis, 2022

Figure 248: Global Vs. GCC Countries Growth Comparison, 2022 to 2033

Figure 249: GCC Countries Market Share Analysis (%), By Production, 2022 & 2033

Figure 250: GCC Countries Market Share Analysis (%), By Service, 2022 & 2033

Figure 251: GCC Countries Market Share Analysis (%), By Indication, 2022 & 2033

Figure 252: GCC Countries Market Share Analysis (%), By End User, 2022 & 2033

Figure 253: Türkiye Market Value Proportion Analysis, 2022

Figure 254: Global Vs. Türkiye Growth Comparison, 2022 to 2033

Figure 255: Türkiye Market Share Analysis (%), By Production, 2022 & 2033

Figure 256: Türkiye Market Share Analysis (%), By Service, 2022 & 2033

Figure 257: Türkiye Market Share Analysis (%), By Indication, 2022 & 2033

Figure 258: Türkiye Market Share Analysis (%), By End User, 2022 & 2033

Figure 259: South Africa Market Value Proportion Analysis, 2022

Figure 260: Global Vs. South Africa Growth Comparison, 2022 to 2033

Figure 261: South Africa Market Share Analysis (%), By Production, 2022 & 2033

Figure 262: South Africa Market Share Analysis (%), By Service, 2022 & 2033

Figure 263: South Africa Market Share Analysis (%), By Indication, 2022 & 2033

Figure 264: South Africa Market Share Analysis (%), By End User, 2022 & 2033

Figure 265: North Africa Market Value Proportion Analysis, 2022

Figure 266: Global Vs. North Africa Growth Comparison, 2022 to 2033

Figure 267: North Africa Market Share Analysis (%), By Production, 2022 & 2033

Figure 268: North Africa Market Share Analysis (%), By Service, 2022 & 2033

Figure 269: North Africa Market Share Analysis (%), By Indication, 2022 & 2033

Figure 270: North Africa Market Share Analysis (%), By End User, 2022 & 2033

Frequently Asked Questions

How Big is the Clinical Research Organization Market?

The clinical research organization market is slated to attain USD 62.43 billion in 2023.

What Might be the Market’s Size by 2033?

The market is expected to attain a value of USD 139.56 billion by 2033.

Which Opportunities are Emerging in the Market?

Increasing popularity of targeted medicines and personalized medicines are creating opportunities for key players.

Which Factors Pull Back the Market Growth?

Strict regulatory regulations and lack of funding for clinical trials are pulling back the market’s growth.

Who are the Key Players in the CRO Industry?

IQVIA Inc, Parexel International Corporation, and ICON plc. are the key players in the CRO industry.

Explore Healthcare Services Insights

Future Market Insights

Clinical Research Organization Market