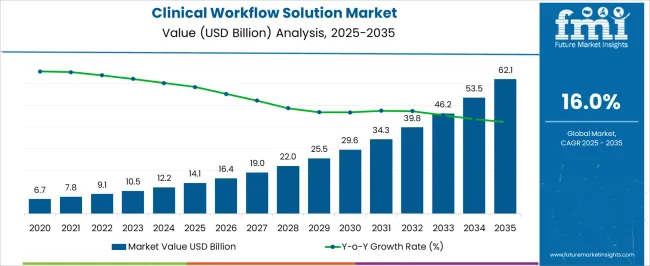
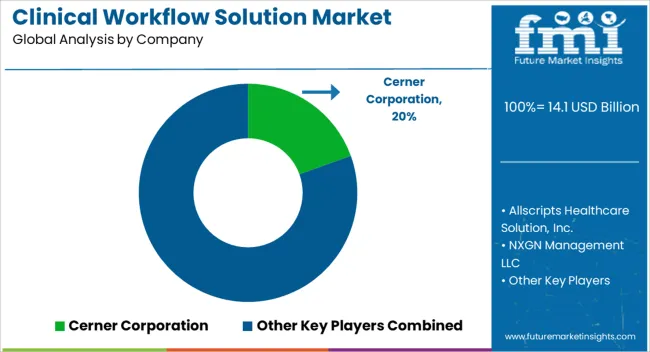
The Clinical Workflow Solution Market is estimated to be valued at USD 14.1 billion in 2025 and is projected to reach USD 62.1 billion by 2035, registering a compound annual growth rate (CAGR) of 16.0% over the forecast period.
| Metric | Value |
|---|---|
| Clinical Workflow Solution Market Estimated Value in (2025 E) | USD 14.1 billion |
| Clinical Workflow Solution Market Forecast Value in (2035 F) | USD 62.1 billion |
| Forecast CAGR (2025 to 2035) | 16.0% |
The clinical workflow solution market is experiencing strong growth. Increasing demand for healthcare digitization, operational efficiency, and patient-centered care is driving adoption across healthcare institutions. Current market dynamics are shaped by the integration of advanced software solutions with existing hospital information systems, rising focus on reducing administrative burden, and regulatory encouragement for digital health solutions.
Challenges such as interoperability and data security are being addressed through standards-based frameworks and enhanced cybersecurity measures. The future outlook is characterized by expanding healthcare infrastructure, rising patient volumes, and continued investment in automation technologies, which are expected to further accelerate market penetration.
Growth rationale is based on the proven ability of clinical workflow solutions to streamline administrative processes, optimize resource allocation, and improve clinical outcomes Continuous technological enhancements, including AI-driven analytics and automated reporting, coupled with strategic deployment in key healthcare facilities, are expected to sustain long-term adoption and reinforce market expansion globally.
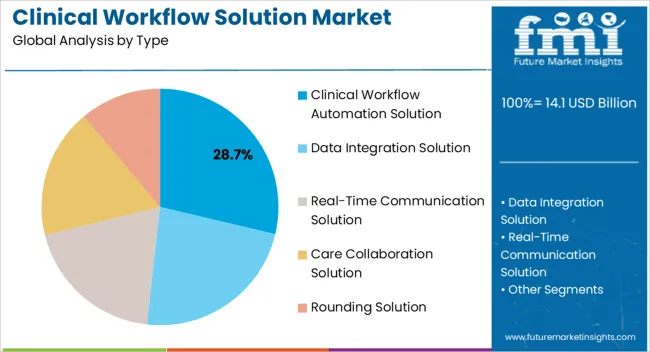
The clinical workflow automation solution segment, representing 28.70% of the type category, has been leading due to its capacity to optimize administrative and operational tasks in healthcare settings. Its adoption has been supported by integration with electronic health records and hospital information systems, enabling real-time task management and efficient patient flow.
The segment’s market share is reinforced by the reduction in manual errors and improved compliance with clinical protocols. Continuous technological refinements, including predictive analytics and AI-based process optimization, have enhanced efficiency and usability.
Strategic partnerships with healthcare providers and technology vendors have expanded deployment, while ongoing focus on system interoperability ensures seamless integration across departments These factors collectively support sustained market leadership and continued growth within the clinical workflow solution segment.
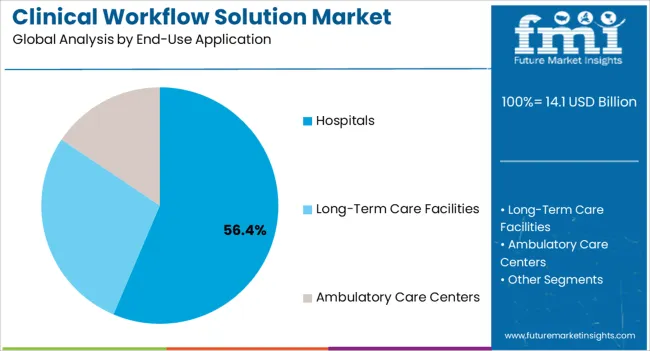
The hospitals segment, holding 56.40% of the end-use application category, has emerged as the primary adopter due to the scale of patient care operations and complexity of administrative workflows. Adoption has been driven by the need to improve patient throughput, reduce operational costs, and enhance clinical decision-making.
Implementation of clinical workflow solutions has supported efficient scheduling, task automation, and optimized resource utilization. The segment’s market share has been reinforced by increasing digitization initiatives, institutional investment in healthcare IT infrastructure, and the prioritization of patient safety and quality care standards.
Ongoing technological enhancements and integration with existing hospital systems are expected to sustain adoption growth, ensuring that hospitals continue to dominate the end-use segment in the clinical workflow solution market.
| Attributes | Details |
|---|---|
| Clinical Workflow Solution Market Size (2020) | USD 4,828.42 million |
| Clinical Workflow Solution Market Size (2025) | USD 8,986.2 million |
The market valuation of clinical workflow solution increased from USD 4,828.42 million in 2020 to USD 8,986.2 million in 2025. Presently, it stands at a valuation of USD 10,352.1 million and is projected to arrive at USD 49,056.3 million by 2035, as per latest market study by FMI analysts. Key factors behind the rising market size are as follows:
| Segment | Data Integration Solution |
|---|---|
| Market Share % (2025) | 27.4% |
The data integration solution segment is projected to occupy a market share of 27.4% in 2025. The growth of this segment is driven by the surging preference of healthcare providers for this solution to manage surging data volumes and the requirement for integration to cut down on wasteful expenses.
This system also allows caregivers to access patient data throughout their entire continuum of care. As a result, more and more caregivers are investing in this unified system.
Some other factors that are supporting the expansion of this segment:
| Segment | Hospitals |
|---|---|
| Market Share % (2025) | 42.2% |
The hospitals sector is predicted to seize a value share of 42.2% in the entire market in 2025. The growth of this segment can be attributed to the increase in the number of healthcare institutions and their related data that requires suitable administration and privacy.
The category is predicted to heavily invest in clinical workflow solutions due to surging government efforts to elevate the healthcare sector and streamline the enormous data in hospitals.
Additional factors that are propelling the category’s growth include:
| Country | The United States |
|---|---|
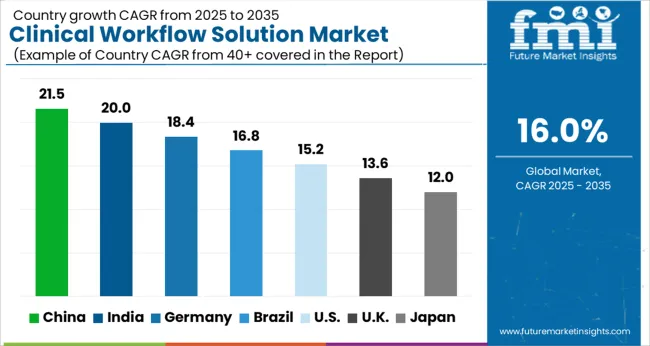
| Forecast CAGR % (2025 to 2035) | 8.1% |
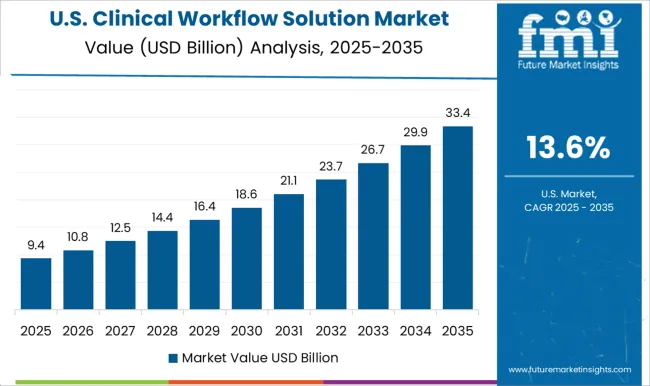
The United States clinical workflow solution market is predicted to expand at a CAGR of 8.1% through 2035. Key factors that are impelling the market growth include:
| Country | The United Kingdom |
|---|---|
| Forecast CAGR % (2025 to 2035) | 7.4% |
In Europe, the United Kingdom is a significant market for clinical workflow solution. The country is set to experience a 7.4% CAGR over the forecast period. Following factors back the market growth in the United Kingdom:
| Country | China |
|---|---|
| Forecast CAGR % (2025 to 2035) | 22.5% |
The clinical workflow solution market in China is anticipated to expand at an exceptional CAGR of 22.5% throughout the next decade. Mentioned below are the leading factors that are facilitating the increase in market size:
| Country | India |
|---|---|
| Forecast CAGR % (2025 to 2035) | 20.5% |
After China, India is the go-to market for clinical workflow solution market players. Over the forecast period, the country is set to register a robust CAGR of 20.5% through 2035. Given below are the core factors pushing the sales of clinical workflow solution in India:
| Country | Japan |
|---|---|
| Forecast CAGR % (2025 to 2035) | 17.5% |
Japan is forecast to register a CAGR of 17.5% through 2035. In the following years, the market is predicted to expand due to the given factors:
| Report Attribute | Details |
|---|---|
| Growth Rate | CAGR of 16.0% from 2025 to 2035 |
| Base Year for Estimation | 2025 |
| Historical Data | 2020 to 2025 |
| Forecast Period | 2025 to 2035 |
| Quantitative Units | Revenue in USD million and CAGR from 2025 to 2035 |
| Report Coverage | Revenue Forecast, Volume Forecast, Company Ranking, Competitive Landscape, Growth Factors, Trends and Pricing Analysis |
| Segments Covered | Type, End Use Application, Region |
| Regions Covered | North America; Latin America; Western Europe; Easter Europe; Asia Pacific; Middle East and Africa |
| Key Countries Profiled | The United States, Canada, Brazil, Argentina, Germany, The United Kingdom, France, Spain, Italy, Nordics, BENELUX, Australia and New Zealand, China, India, ASEAN, GCC, South Africa |
| Key Companies Profiled | Allscripts Healthcare Solution, Inc.; Cerner Corporation; NXGN Management LLC; McKesson Corporation; Koninklijke Philips N.V.; Hill-Rom Services, Inc.; Cisco; General Electric; Stanley Healthcare; Vocera Communications; ASCOM; Atenahealth Inc.; Others |
| Customization | Available Upon Request |
The market is fragmented and is categorized by intense competition. Players in the market are focusing on the quality of their offerings to retain their positions. Apart from this, hospitals and healthcare providers are renewing or negotiating license agreements with IT solution providers to utilize their market-ready technologies. Thus, fueling the market growth.
To sustain the market competition, key players are following a list of strategies, including:
Key Developments Taking Place in the Clinical Workflow Solution Market
The global clinical workflow solution market is estimated to be valued at USD 14.1 billion in 2025.
The market size for the clinical workflow solution market is projected to reach USD 62.1 billion by 2035.
The clinical workflow solution market is expected to grow at a 16.0% CAGR between 2025 and 2035.
The key product types in clinical workflow solution market are clinical workflow automation solution, _patient flow management solution, _nursing and staff scheduling solution, data integration solution, _emr integration solution, _medical image integration solution, real-time communication solution, _nurse call alert systems, _unified communication solution, care collaboration solution, _medication administration solution, _perinatal care management solution and rounding solution.
In terms of end-use application, hospitals segment to command 56.4% share in the clinical workflow solution market in 2025.


Full Research Suite comprises of:
Market outlook & trends analysis
Interviews & case studies
Strategic recommendations
Vendor profiles & capabilities analysis
5-year forecasts
8 regions and 60+ country-level data splits
Market segment data splits
12 months of continuous data updates
DELIVERED AS:
PDF EXCEL ONLINE
Clinical Chairs Market Size and Share Forecast Outlook 2025 to 2035
Clinical Avian Nutrition Market Analysis - Size, Share, and Forecast Outlook 2025 to 2035
Clinical Research Organization Market Size and Share Forecast Outlook 2025 to 2035
Clinical Trial Packaging Market Size and Share Forecast Outlook 2025 to 2035
Clinical Mobility Market Size and Share Forecast Outlook 2025 to 2035
Clinical Immunodiagnostics Market Size and Share Forecast Outlook 2025 to 2035
Clinical Communication and Collaboration Market Size and Share Forecast Outlook 2025 to 2035
Clinical Oncology Next-generation Sequencing Market Analysis - Size, Share, and Forecast 2025 to 2035
Clinical Decision Support Systems Market Size and Share Forecast Outlook 2025 to 2035
Clinical Trials Market Analysis - Size, Share, and Forecast 2025 to 2035
Clinical Refractometer Market Size and Share Forecast Outlook 2025 to 2035
Clinical Next-Generation Sequencing (NGS) Data Analysis Market Analysis by Solution and Services, Technology, End User, and Region through 2035
Clinical Hand Hygiene Products Market – Trends, Growth & Forecast 2025 to 2035
The Clinical Alarm Management Market is segmented by component, deployment mode and end user from 2025 to 2035
Clinical Nutrition Market Insights – Trends & Forecast 2025 to 2035
Clinical Diagnostics Market Insights – Size, Share & Forecast 2025 to 2035
Clinical Information System Market Analysis - Growth & Forecast 2024 to 2034
Clinical Chemistry Analyzers Market Trends – Demand & Forecast 2024 to 2034
Clinical Communication & Collaboration Software Market Trends – Forecast through 2034
Clinical Decision Support App Market – AI-Powered Insights 2034

Thank you!
You will receive an email from our Business Development Manager. Please be sure to check your SPAM/JUNK folder too.
Chat With
MaRIA