Global Clinical Immunodiagnostics Market Size and Share Forecast Snapshot for 2023 to 2033

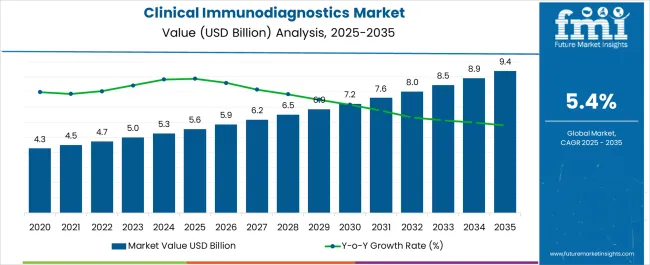
The global clinical immunodiagnostics market was valued at USD 4.8 Billion in 2022 and is expected to reach USD 8.4 Billion by 2033. The immunoassay kits & reagents segment with a market share of more than 67.0% has topped the global market within the product category and is expected to grow at a CAGR of close to 5.4% over the forecast period (2023 to 2033).

Market Outlook:

Data Points Market Insights
Clinical Immunodiagnostics Market Value 2022 USD 4.8 Billion
Market Value 2023 USD 5.0 Billion
Market Value 2033 USD 8.4 Billion
CAGR 2023 to 2033 5.4%
Market Share of Top 5 Countries (2022) 58.0%

Clinical immunodiagnostics refers to the diagnostic tests and technologies that utilize immunodiagnostic techniques to detect and measure specific antibodies, antigens, or immune markers in patient samples. Immunodiagnostics involves the interaction between antigens and antibodies, forming an immune complex that is then detected and quantified to provide diagnostic information.

Clinical immunodiagnostics plays a crucial role in diagnosing various diseases and conditions, monitoring treatment efficacy, and assessing immune system function. These tests are commonly used in clinical laboratories, hospitals, and research institutions to identify and measure immune markers associated with infectious diseases, autoimmune disorders, allergies, cancer, and other medical conditions.

Sales Analysis of the Clinical Immunodiagnostics Market (2017–2022) vs Outlook for 2023 to 2033

The global market for clinical immunodiagnostics was around 3.7% of the overall USD 128.2 Billion of the global in vitro diagnostics market in 2022.

The market has experienced significant growth over the years. The increasing prevalence of infectious diseases, autoimmune disorders, and cancer, coupled with advancements in immunodiagnostic technologies, has contributed to the expansion of the market.

The introduction of novel assays improved the sensitivity and specificity of tests, and the adoption of automated platforms has played a key role in the historic growth of the clinical immunodiagnostics market. The global burden of infectious diseases, chronic diseases, and conditions related to the immune system is expected to rise continuously in the coming years.

  • Major chronic diseases were predicted by the World health organization (WHO) to account for 60% of the global burden of disease and 73% of all fatalities in 2020.

This will drive the demand for accurate and reliable diagnostic tests, including clinical immunodiagnostics. Also, the need for early disease detection, personalized medicine, and effective monitoring of treatment outcomes will fuel market growth.

Ongoing advancements in immunodiagnostic technologies, such as multiplex assays, high-sensitivity detection methods, and point-of-care testing, are expected to enhance the performance and accessibility of clinical immunodiagnostics. These technological advancements will enable rapid and accurate diagnosis, resulting in increased adoption and market growth.

Owed to the above factors, the global market is projected to grow at a CAGR of 5.4% in the forecasted period.

Key Opportunities Driving Innovation in Clinical Immunodiagnostic Product Development

Clinical Immunodiagnostics are essential in personalized medicine because it helps in facilitating the diagnosis and monitoring of diseases at an individual level. As the demand for personalized treatment options continues to rise, clinical immunodiagnostics product manufacturers have an opportunity to develop innovative assays that enable targeted therapies and precision medicine.

The integration of clinical immunodiagnostics with therapeutics, particularly in oncology, presents opportunities for manufacturers. As targeted therapies become more prevalent, the demand for companion diagnostics is likely to grow. Developing tests that identify patients who will respond positively to specific treatments can enhance the effectiveness of therapies and reduce healthcare costs. Manufacturers can collaborate with pharmaceutical companies to develop companion diagnostic assays that enhance treatment selection and personalized patient care. This would present numerous opportunities for the growth of this market.

Restraining Factors Affecting the Demand for Clinical Immunodiagnostics Across Key Markets

Clinical immunodiagnostics can involve high costs, including the development and production of assays, instruments, and reagents. The high costs associated with immunodiagnostic tests can limit their accessibility and affordability, particularly in resource-constrained settings or regions with limited healthcare budgets. Cost considerations can impact the demand for clinical immunodiagnostics.

Apart from this, clinical immunodiagnostics faces competition from alternative diagnostic technologies, such as molecular diagnostics, imaging techniques, and other non-immunological assays. These alternative technologies may offer advantages in terms of sensitivity, specificity, multiplexing capabilities, or cost-effectiveness in certain applications. The availability of alternative diagnostic options can limit the demand for clinical immunodiagnostics.
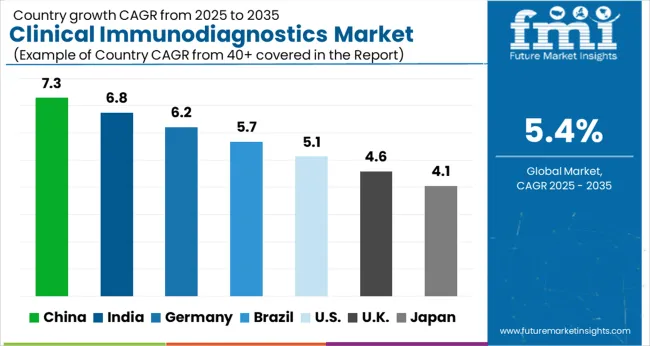
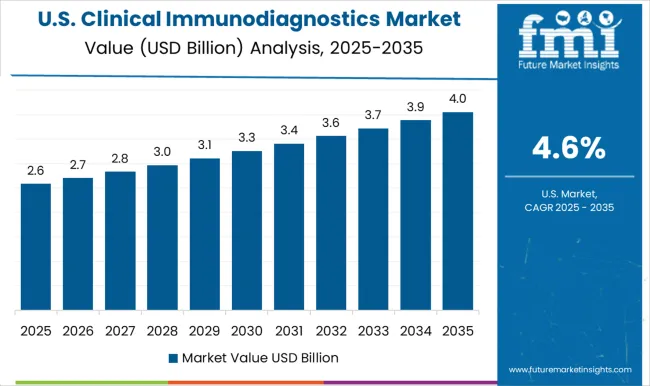
Analysis of Top Countries Enhancing Clinical Immunodiagnostics Access and Usage

Why is the USA a Prominent Market for Clinical Immunodiagnostics?

The USA occupies 91.1% of the North America market in 2022. Reimbursement policies play an important role in the adoption of medical technologies. In the USA, favorable reimbursement policies for clinical immunodiagnostics testing have supported market growth. Reimbursement coverage by government programs like Medicare and private insurance companies has incentivized healthcare providers to offer clinical immunodiagnostic-based diagnostics.
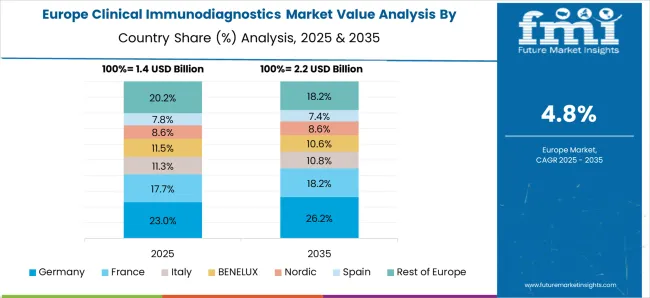
What Makes Germany a Highly Lucrative Market for Clinical Immunodiagnostics?

Germany’s expenditure in clinical immunodiagnostics in 2022 was USD 310.6 Million. Personalized medicine, which involves tailoring medical treatment to individual patients based on their genetic profile, is gaining prominence in this region. Germany, known for its strong healthcare and research infrastructure, is actively participating in personalized medicine initiatives. Clinical immunodiagnostics being essential in identifying specific biomarkers for personalized medicine drives the demand for various kits and reagents in the country.

What Makes China a Large Market for Clinical Immunodiagnostics?

In 2022, China held a significant share of the East Asia market and is expected to grow at a CAGR of close to 6.4% over the forecast period. Chinese clinical immunodiagnostics manufacturers are increasingly collaborating with international companies, leveraging expertise, technologies, and market access. These collaborations help in technology transfer, product development, and expanding the market reach of clinical immunodiagnostics in China. Also, partnerships with healthcare providers and research institutions contribute to the growth of the clinical immunodiagnostics market in China.

Clinical Immunodiagnostics Market Insights by Test Type and Application Category

Which Product is Predicted to Expand Rapidly Between 2023 and 2033?

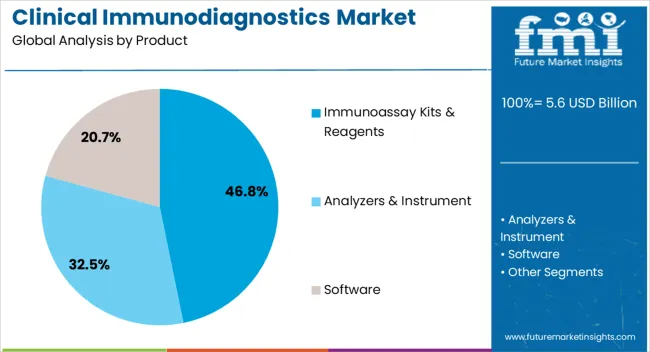
By product, immunoassay kits & reagents held 67.8% market share in the world in 2022 and are expected to expand rapidly with a CAGR of 5.4% from 2023 to 2033. Immunoassay kits and reagents have a broad range of applications in clinical immunodiagnostics, covering various disease areas, including infectious diseases, autoimmune disorders, oncology, cardiovascular diseases, and endocrinology. Their versatility and adaptability to different analytes make them essential tools for diagnosing and monitoring a diverse set of medical conditions.

Which Sample Type is Preferred Prominently in Clinical Immunodiagnostics?

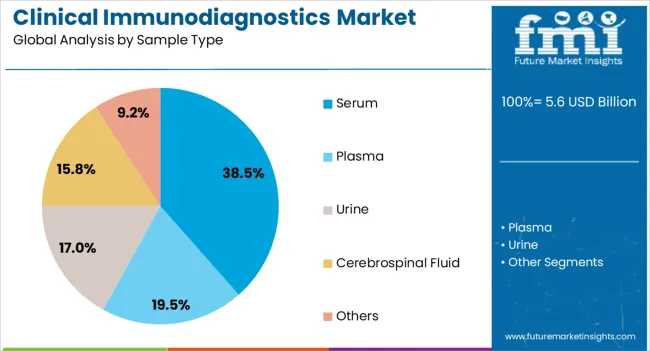
The market value of serum sample type was USD 1.7 Billion, representing a sizable 35.4% market share in 2022. Serum samples are readily available and routinely used in clinical practice. Healthcare facilities and laboratories can easily collect serum samples from patients for diagnostic testing, making them a convenient and accessible source of biomaterial for immunodiagnostics.

Which Application Has Garnered a Significant Value Share in 2022?

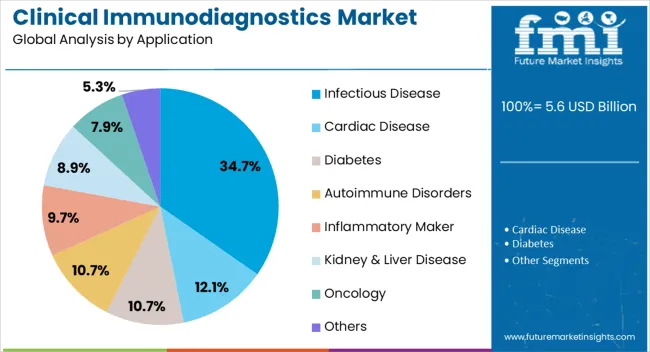
By application, infectious disease accounted for a prominent share of the global market, with a revenue share of 20.7% in 2022. Infectious diseases are widespread and continue to pose a significant global health burden. The high prevalence of infectious diseases, such as influenza, HIV/AIDS, hepatitis, tuberculosis, and various respiratory infections, drives the demand for diagnostic tests based on immunodiagnostics.

Which End User is Benefiting the Global Market?

With a 26.1% value share in 2022 and a strong CAGR of 6.4% over the projected period, the hospital has a sizable position in this market. Hospitals cater to a large number of patients with diverse medical conditions. As a result, they have a substantial demand for diagnostic testing, including clinical immunodiagnostics. Hospitals frequently utilize immunodiagnostic tests to aid in the diagnosis and inspection of various diseases.
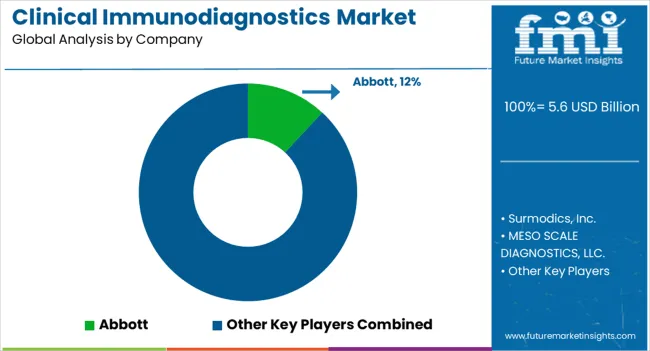
Competitive Landscape of the Global Clinical Immunodiagnostics Industry – Company Strategies and Market Share

Collaborations with medical professionals, academic institutions, and IT companies can promote creativity and speed up clinical immunodiagnostics. Also, collaboration in research, development, and commercialization can result in new applications and a larger market. The market for clinical immunodiagnostics is dominated by multiple sizable businesses. The important advances of the major companies in this market are illustrated by the following examples:

  • In October 2022, to facilitate patient selection and monitoring in immunotherapy trials, a new partnership added two Telix experimental PET imaging radiotracers to GE Healthcare's immuno-diagnostic portfolio.
  • In July 2021, in order to market and provide Thermo Scientific Qc and QA Technology to be utilized with Orthopedic Clinical Diagnostics VITROS analyzers, Thermo Fisher Scientific, a global leader in servicing research, announced a partnership with Ortho Clinical Diagnostics.

Similarly, recent developments related to the companies, manufacturing the clinical immunodiagnostics products have been tracked by the team at Future Market Insights, which are available in the full report.

Report Scope Based on Clinical Immunodiagnostics Market Segmentation and Research Parameters

Report Attributes Details
Forecast Period 2023 to 2033
Historical Data Available for 2017 to 2022
Market Analysis USD Million for Value, Units for Volume
Key Regions Covered North America; Latin America; Europe; East Asia; South Asia; Oceania; Middle East and Africa (MEA)
Key Countries Covered USA, Canada, Brazil, Mexico, Argentina, United Kingdom, Germany, Italy, France, Spain, BENELUX, Russia, China, Japan, South Korea, India, Indonesia, Thailand, Malaysia, Australia, New Zealand, GCC Countries, Türkiye, South Africa and Northern Africa
Key Market Segments Covered Product, Sample Type, Application, End User, and Region
Key Companies Profiled Surmodics, Inc.; MESO SCALE DIAGNOSTICS, LLC.; Abbott; Siemens Healthineers; PerkinElmer Inc.; Becton, Dickinson and Company; Thermo Fisher Scientific Inc.; Zoetis Inc.; Promega Corporation; F. Hoffmann-La Roche; BIOMÉRIEUX SA; Elabscience Biotechnology Inc.; Innovative Research, Inc.; QIAGEN N.V.; Merck KGaA; Bio-Rad Laboratories, Inc.; Creative Diagnostics; Cell Signaling Technology (CST); NEW HORIZONS DIAGNOSTIC CORPORATION; DiaSorin S.p.A.; H.U. Group Holdings Inc; IDEXX Laboratories Inc.; Randox Laboratories Ltd.; Biopanda Reagents Ltd.; Shenzhen Bioeasy Biotechnology Co., Ltd.; Quidel Corporation; Advnt Biotechnologies.; RESPONSE BIOMEDICAL.; Danaher Corporation
Report Coverage Market Forecast, Competition Intelligence, DROT Analysis, Market Dynamics and Challenges, Strategic Growth Initiatives
Pricing Available upon Request

Key Market Segments Covered in the Clinical Immunodiagnostics Industry Research by Product Type, End User, and Test Application

By Product:

  • Immunoassay Kits & Reagents
  • Analyzers & Instrument
  • Software

By Sample Type:

  • Serum
  • Plasma
  • Urine
  • Cerebrospinal Fluid
  • Others

By Application:

  • Infectious Disease
  • Cardiac Disease
  • Diabetes
  • Autoimmune Disorders
  • Inflammatory Maker
  • Kidney & Liver Disease
  • Oncology
  • Others

By End User:

  • Hospital
  • Specialty Clinics
  • Academic and Research Institute
  • Diagnostics Laboratories
  • Reference Laboratories
  • Cancer Research Institutes
  • Veterinary Hospitals
  • Blood Banks

By Region:

  • North America
  • Latin America
  • Europe
  • South Asia
  • East Asia
  • Oceania
  • Middle East and Africa (MEA)

Table of Content

  • 1. Executive Summary
  • 2. Market Overview
  • 3. Key Market Trends
  • 4. Value-Added Insights
  • 5. Market Background
  • 6. Global Market Demand in Volume (Units) Analysis 2017 to 2022 and Forecast, 2023 to 2033
  • 7. Global Market - Pricing Analysis
  • 8. Global Market Demand (in Value or Size in USD Million) Analysis 2017 to 2022 and Forecast, 2023 to 2033
  • 9. Global Market Analysis 2017 to 2022 and Forecast 2023 to 2033, By Product
    • 9.1. Immunoassay Kits & Reagents
    • 9.2. Analyzers & Instrument
    • 9.3. Software
  • 10. Global Market Analysis 2017 to 2022 and Forecast 2023 to 2033, By Sample Type
    • 10.1. Serum
    • 10.2. Plasma
    • 10.3. Urine
    • 10.4. Cerebrospinal Fluid
    • 10.5. Others
  • 11. Global Market Analysis 2017 to 2022 and Forecast 2023 to 2033, By Application
    • 11.1. Infectious Disease
    • 11.2. Cardiac Disease
    • 11.3. Diabetes
    • 11.4. Autoimmune Disorders
    • 11.5. Inflammatory Marker
    • 11.6. Kidney & Liver Disease
    • 11.7. Oncology
    • 11.8. Others
  • 12. Global Market Analysis 2017 to 2022 and Forecast 2023 to 2033, By End User
    • 12.1. Hospital
    • 12.2. Specialty Clinics
    • 12.3. Academic and Research Institute
    • 12.4. Diagnostics Laboratories
    • 12.5. Reference Laboratories
    • 12.6. Cancer Research Institutes
    • 12.7. Veterinary Hospitals
    • 12.8. Blood Banks
  • 13. Global Market Analysis 2017 to 2022 and Forecast 2023 to 2033, By Region
    • 13.1. North America
    • 13.2. Latin America
    • 13.3. Europe
    • 13.4. East Asia
    • 13.5. South Asia
    • 13.6. Oceania
    • 13.7. Middle East & Africa
  • 14. North America Market Analysis 2017 to 2022 and Forecast 2023 to 2033
  • 15. Latin America Market Analysis 2017 to 2022 and Forecast 2023 to 2033
  • 16. Europe Market Analysis 2017 to 2022 and Forecast 2023 to 2033
  • 17. East Asia Market Analysis 2017 to 2022 and Forecast 2023 to 2033
  • 18. South Asia Market Analysis 2017 to 2022 and Forecast 2023 to 2033
  • 19. Oceania Market Analysis 2017 to 2022 and Forecast 2023 to 2033
  • 20. Middle East & Africa (MEA) Market Analysis 2017 to 2022 and Forecast 2023 to 2033
  • 21. Market Structure Analysis
  • 22. Competition Analysis
    • 22.1. Surmodics, Inc.
    • 22.2. MESO SCALE DIAGNOSTICS, LLC.
    • 22.3. Abbott
    • 22.4. Siemens Healthineers
    • 22.5. PerkinElmer Inc.
    • 22.6. Becton, Dickinson and Company
    • 22.7. Thermo Fisher Scientific Inc.
    • 22.8. Zoetis Inc.
    • 22.9. Promega Corporation
    • 22.10. F. Hoffmann-La Roche
    • 22.11. BIOMÉRIEUX SA
    • 22.12. Elabscience Biotechnology Inc.
    • 22.13. Innovative Research, Inc.
    • 22.14. QIAGEN N.V.
    • 22.15. Merck KGaA
    • 22.16. Bio-Rad Laboratories, Inc.
    • 22.17. Creative Diagnostics
    • 22.18. Cell Signaling Technology (CST)
    • 22.19. NEW HORIZONS DIAGNOSTIC CORPORATION
    • 22.20. DiaSorin S.p.A.
    • 22.21. H.U. Group Holdings Inc
    • 22.22. IDEXX Laboratories Inc.
    • 22.23. Randox Laboratories Ltd.
    • 22.24. Biopanda Reagents Ltd.
    • 22.25. Shenzhen Bioeasy Biotechnology Co., Ltd.
    • 22.26. Quidel Corporation
    • 22.27. Advnt Biotechnologies
    • 22.28. RESPONSE BIOMEDICAL
    • 22.29. Danaher Corporation
  • 23. Assumptions and Acronyms Used
  • 24. Research Methodology

List of Tables

Table 01: Global Market Value (US$ Million) Analysis and Forecast 2017 to 2033, by Product

Table 02: Global Market Volume (Units) Analysis and Forecast 2017 to 2033, by Product

Table 03: Global Market Value (US$ Million) Analysis and Forecast 2017 to 2033, by Sample Type

Table 04: Global Market Value (US$ Million) Analysis and Forecast 2017 to 2033, by Application

Table 05: Global Market Value (US$ Million) Analysis and Forecast 2017 to 2033, by End User

Table 06: Global Market Value (US$ Million) Analysis and Forecast 2017 to 2033, by Region

Table 07: North America Market Value (US$ Million) Analysis 2017 to 2022 and Forecast 2023 to 2033, by Country

Table 08: North America Market Value (US$ Million) Analysis and Forecast 2017 to 2033, by Product

Table 09: North America Market Volume (Units) Analysis and Forecast 2017 to 2033, by Product

Table 10: North America Market Value (US$ Million) Analysis and Forecast 2017 to 2033, by Sample Type

Table 11: North America Market Value (US$ Million) Analysis and Forecast 2017 to 2033, by Application

Table 12: North America Market Value (US$ Million) Analysis and Forecast 2017 to 2033, by End User

Table 13: Latin America Market Value (US$ Million) Analysis 2017 to 2022 and Forecast 2023 to 2033, by Country

Table 14: Latin America Market Value (US$ Million) Analysis and Forecast 2017 to 2033, by Product

Table 15: Latin America Market Volume (Units) Analysis and Forecast 2017 to 2033, by Product

Table 16: Latin America Market Value (US$ Million) Analysis and Forecast 2017 to 2033, by Sample Type

Table 17: Latin America Market Value (US$ Million) Analysis and Forecast 2017 to 2033, by Application

Table 18: Latin America Market Value (US$ Million) Analysis and Forecast 2017 to 2033, by End User

Table 19: Europe Market Value (US$ Million) Analysis 2017 to 2022 and Forecast 2023 to 2033, by Country

Table 20: Europe Market Value (US$ Million) Analysis and Forecast 2017 to 2033, by Product

Table 21: Europe Market Volume (Units) Analysis and Forecast 2017 to 2033, by Product

Table 22: Europe Market Value (US$ Million) Analysis and Forecast 2017 to 2033, by Sample Type

Table 23: Europe Market Value (US$ Million) Analysis and Forecast 2017 to 2033, by Application

Table 24: Europe Market Value (US$ Million) Analysis and Forecast 2017 to 2033, by End User

Table 25: East Asia Market Value (US$ Million) Analysis 2017 to 2022 and Forecast 2023 to 2033, by Country

Table 26: East Asia Market Value (US$ Million) Analysis and Forecast 2017 to 2033, by Product

Table 27: East Asia Market Volume (Units) Analysis and Forecast 2017 to 2033, by Product

Table 28: East Asia Market Value (US$ Million) Analysis and Forecast 2017 to 2033, by Sample Type

Table 29: East Asia Market Value (US$ Million) Analysis and Forecast 2017 to 2033, by Application

Table 30: East Asia Market Value (US$ Million) Analysis and Forecast 2017 to 2033, by End User

Table 31: South Asia Market Value (US$ Million) Analysis 2017 to 2022 and Forecast 2023 to 2033, by Country

Table 32: South Asia Market Value (US$ Million) Analysis and Forecast 2017 to 2033, by Product

Table 33: South Asia Market Volume (Units) Analysis and Forecast 2017 to 2033, by Product

Table 34: South Asia Market Value (US$ Million) Analysis and Forecast 2017 to 2033, by Sample Type

Table 35: South Asia Market Value (US$ Million) Analysis and Forecast 2017 to 2033, by Application

Table 36: South Asia Market Value (US$ Million) Analysis and Forecast 2017 to 2033, by End User

Table 37: Oceania Market Value (US$ Million) Analysis 2017 to 2022 and Forecast 2023 to 2033, by Country

Table 38: Oceania Market Value (US$ Million) Analysis and Forecast 2017 to 2033, by Product

Table 39: Oceania Market Volume (Units) Analysis and Forecast 2017 to 2033, by Product

Table 40: Oceania Market Value (US$ Million) Analysis and Forecast 2017 to 2033, by Sample Type

Table 41: Oceania Market Value (US$ Million) Analysis and Forecast 2017 to 2033, by Application

Table 42: Oceania Market Value (US$ Million) Analysis and Forecast 2017 to 2033, by End User

Table 43: Middle East & Africa Market Value (US$ Million) Analysis 2017 to 2022 and Forecast 2023 to 2033, by Country

Table 44: Middle East & Africa Market Value (US$ Million) Analysis and Forecast 2017 to 2033, by Product

Table 45: Middle East & Africa Market Volume (Units) Analysis and Forecast 2017 to 2033, by Product

Table 46: Middle East & Africa Market Value (US$ Million) Analysis and Forecast 2017 to 2033, by Sample Type

Table 47: Middle East & Africa Market Value (US$ Million) Analysis and Forecast 2017 to 2033, by Application

Table 48: Middle East & Africa Market Value (US$ Million) Analysis and Forecast 2017 to 2033, by End User

List of Figures

Figure 01: Global Market Volume (Units), 2017 to 2022

Figure 02: Global Market Volume (Units) & Y-o-Y Growth (%) Analysis, 2023 to 2033

Figure 03: Clinical Immunodiagnostic Product, Pricing Analysis per unit (US$), in 2022

Figure 04: Clinical Immunodiagnostic Product, Pricing Forecast per unit (US$), in 2033

Figure 05: Global Market Value (US$ Million) Analysis, 2017 to 2022

Figure 06: Global Market Forecast & Y-o-Y Growth, 2023 to 2033

Figure 07: Global Market Absolute $ Opportunity (US$ Million) Analysis, 2022 to 2033

Figure 08: Global Market Value Share (%) Analysis 2023 and 2033, by Product

Figure 09: Global Market Y-o-Y Growth (%) Analysis 2022-2033, by Product

Figure 10: Global Market Attractiveness Analysis 2023 to 2033, by Product

Figure 11: Global Market Value Share (%) Analysis 2023 and 2033, by Sample Type

Figure 12: Global Market Y-o-Y Growth (%) Analysis 2022-2033, by Sample Type

Figure 13: Global Market Attractiveness Analysis 2023 to 2033, by Sample Type

Figure 14: Global Market Value Share (%) Analysis 2023 and 2033, by Application

Figure 15: Global Market Y-o-Y Growth (%) Analysis 2022-2033, by Application

Figure 16: Global Market Attractiveness Analysis 2023 to 2033, by Application

Figure 17: Global Market Value Share (%) Analysis 2023 and 2033, by End User

Figure 18: Global Market Y-o-Y Growth (%) Analysis 2022-2033, by End User

Figure 19: Global Market Attractiveness Analysis 2023 to 2033, by End User

Figure 20: Global Market Value Share (%) Analysis 2023 and 2033, by Region

Figure 21: Global Market Y-o-Y Growth (%) Analysis 2022-2033, by Region

Figure 22: Global Market Attractiveness Analysis 2023 to 2033, by Region

Figure 23: North America Market Value (US$ Million) Analysis, 2017 to 2022

Figure 24: North America Market Value (US$ Million) Forecast, 2023 to 2033

Figure 25: North America Market Value Share, by Product (2023 E)

Figure 26: North America Market Value Share, by Sample Type (2023 E)

Figure 27: North America Market Value Share, by Application (2023 E)

Figure 28: North America Market Value Share, by End User (2023 E)

Figure 29: North America Market Value Share, by Country (2023 E)

Figure 30: North America Market Attractiveness Analysis by Product, 2023 to 2033

Figure 31: North America Market Attractiveness Analysis by Sample Type, 2023 to 2033

Figure 32: North America Market Attractiveness Analysis by Application, 2023 to 2033

Figure 33: North America Market Attractiveness Analysis by End User, 2023 to 2033

Figure 34: North America Market Attractiveness Analysis by Country, 2023 to 2033

Figure 35: USA. Market Value Proportion Analysis, 2022

Figure 36: Global Vs. USA. Growth Comparison

Figure 37: USA. Market Share Analysis (%) by Product, 2022 & 2033

Figure 38: USA. Market Share Analysis (%) by Sample Type, 2022 & 2033

Figure 39: USA. Market Share Analysis (%) by Application, 2022 & 2033

Figure 40: USA. Market Share Analysis (%) by End User, 2022 & 2033

Figure 41: Canada Market Value Proportion Analysis, 2022

Figure 42: Global Vs. Canada. Growth Comparison

Figure 43: Canada Market Share Analysis (%) by Product, 2022 & 2033

Figure 44: Canada Market Share Analysis (%) by Sample Type, 2022 & 2033

Figure 45: Canada Market Share Analysis (%) by Application, 2022 & 2033

Figure 46: Canada Market Share Analysis (%) by End User, 2022 & 2033

Figure 47: Latin America Market Value (US$ Million) Analysis, 2017 to 2022

Figure 48: Latin America Market Value (US$ Million) Forecast, 2023 to 2033

Figure 49: Latin America Market Value Share, by Product (2023 E)

Figure 50: Latin America Market Value Share, by Sample Type (2023 E)

Figure 51: Latin America Market Value Share, by Application (2023 E)

Figure 52: Latin America Market Value Share, by End User (2023 E)

Figure 53: Latin America Market Value Share, by Country (2023 E)

Figure 54: Latin America Market Attractiveness Analysis by Product, 2023 to 2033

Figure 55: Latin America Market Attractiveness Analysis by Sample Type, 2023 to 2033

Figure 56: Latin America Market Attractiveness Analysis by Application, 2023 to 2033

Figure 57: Latin America Market Attractiveness Analysis by End User, 2023 to 2033

Figure 58: Latin America Market Attractiveness Analysis by Country, 2023 to 2033

Figure 59: Mexico Market Value Proportion Analysis, 2022

Figure 60: Global Vs Mexico Growth Comparison

Figure 61: Mexico Market Share Analysis (%) by Product, 2022 & 2033

Figure 62: Mexico Market Share Analysis (%) by Sample Type, 2022 & 2033

Figure 63: Mexico Market Share Analysis (%) by Application, 2022 & 2033

Figure 64: Mexico Market Share Analysis (%) by End User, 2022 & 2033

Figure 65: Brazil Market Value Proportion Analysis, 2022

Figure 66: Global Vs. Brazil. Growth Comparison

Figure 67: Brazil Market Share Analysis (%) by Product, 2022 & 2033

Figure 68: Brazil Market Share Analysis (%) by Sample Type, 2022 & 2033

Figure 69: Brazil Market Share Analysis (%) by Application, 2022 & 2033

Figure 70: Brazil Market Share Analysis (%) by End User, 2022 & 2033

Figure 71: Argentina Market Value Proportion Analysis, 2022

Figure 72: Global Vs Argentina Growth Comparison

Figure 73: Argentina Market Share Analysis (%) by Product, 2022 & 2033

Figure 74: Argentina Market Share Analysis (%) by Sample Type, 2022 & 2033

Figure 75: Argentina Market Share Analysis (%) by Application, 2022 & 2033

Figure 76: Argentina Market Share Analysis (%) by End User, 2022 & 2033

Figure 77: Europe Market Value (US$ Million) Analysis, 2017 to 2022

Figure 78: Europe Market Value (US$ Million) Forecast, 2023 to 2033

Figure 79: Europe Market Value Share, by Product (2023 E)

Figure 80: Europe Market Value Share, by Sample Type (2023 E)

Figure 81: Europe Market Value Share, by Application (2023 E)

Figure 82: Europe Market Value Share, by End User (2023 E)

Figure 83: Europe Market Value Share, by Country (2023 E)

Figure 84: Europe Market Attractiveness Analysis by Product, 2023 to 2033

Figure 85: Europe Market Attractiveness Analysis by Sample Type, 2023 to 2033

Figure 86: Europe Market Attractiveness Analysis by Application, 2023 to 2033

Figure 87: Europe Market Attractiveness Analysis by End User, 2023 to 2033

Figure 88: Europe Market Attractiveness Analysis by Country, 2023 to 2033

Figure 89: United Kingdom. Market Value Proportion Analysis, 2022

Figure 90: Global Vs. United Kingdom. Growth Comparison

Figure 91: United Kingdom. Market Share Analysis (%) by Product, 2022 & 2033

Figure 92: United Kingdom. Market Share Analysis (%) by Sample Type, 2022 & 2033

Figure 93: United Kingdom. Market Share Analysis (%) by Application, 2022 & 2033

Figure 94: United Kingdom. Market Share Analysis (%) by End User, 2022 & 2033

Figure 95: Germany Market Value Proportion Analysis, 2022

Figure 96: Global Vs. Germany Growth Comparison

Figure 97: Germany Market Share Analysis (%) by Product, 2022 & 2033

Figure 98: Germany Market Share Analysis (%) by Sample Type, 2022 & 2033

Figure 99: Germany Market Share Analysis (%) by Application, 2022 & 2033

Figure 100: Germany Market Share Analysis (%) by End User, 2022 & 2033

Figure 101: Italy Market Value Proportion Analysis, 2022

Figure 102: Global Vs. Italy Growth Comparison

Figure 103: Italy Market Share Analysis (%) by Product, 2022 & 2033

Figure 104: Italy Market Share Analysis (%) by Sample Type, 2022 & 2033

Figure 105: Italy Market Share Analysis (%) by Application, 2022 & 2033

Figure 106: Italy Market Share Analysis (%) by End User, 2022 & 2033

Figure 107: France Market Value Proportion Analysis, 2022

Figure 108: Global Vs France Growth Comparison

Figure 109: France Market Share Analysis (%) by Product, 2022 & 2033

Figure 110: France Market Share Analysis (%) by Sample Type, 2022 & 2033

Figure 111: France Market Share Analysis (%) by Application, 2022 & 2033

Figure 112: France Market Share Analysis (%) by End User, 2022 & 2033

Figure 113: Spain Market Value Proportion Analysis, 2022

Figure 114: Global Vs Spain Growth Comparison

Figure 115: Spain Market Share Analysis (%) by Product, 2022 & 2033

Figure 116: Spain Market Share Analysis (%) by Sample Type, 2022 & 2033

Figure 117: Spain Market Share Analysis (%) by Application, 2022 & 2033

Figure 118: Spain Market Share Analysis (%) by End User, 2022 & 2033

Figure 119: Russia Market Value Proportion Analysis, 2022

Figure 120: Global Vs Russia Growth Comparison

Figure 121: Russia Market Share Analysis (%) by Product, 2022 & 2033

Figure 122: Russia Market Share Analysis (%) by Sample Type, 2022 & 2033

Figure 123: Russia Market Share Analysis (%) by Application, 2022 & 2033

Figure 124: Russia Market Share Analysis (%) by End User, 2022 & 2033

Figure 125: BENELUX Market Value Proportion Analysis, 2022

Figure 126: Global Vs BENELUX Growth Comparison

Figure 127: BENELUX Market Share Analysis (%) by Product, 2022 & 2033

Figure 128: BENELUX Market Share Analysis (%) by Sample Type, 2022 & 2033

Figure 129: BENELUX Market Share Analysis (%) by Application, 2022 & 2033

Figure 130: BENELUX Market Share Analysis (%) by End User, 2022 & 2033

Figure 131: East Asia Market Value (US$ Million) Analysis, 2017 to 2022

Figure 132: East Asia Market Value (US$ Million) Forecast, 2023 to 2033

Figure 133: East Asia Market Value Share, by Product (2023 E)

Figure 134: East Asia Market Value Share, by Sample Type (2023 E)

Figure 135: East Asia Market Value Share, by Application (2023 E)

Figure 136: East Asia Market Value Share, by End User (2023 E)

Figure 137: East Asia Market Value Share, by Country (2023 E)

Figure 138: East Asia Market Attractiveness Analysis by Product, 2023 to 2033

Figure 139: East Asia Market Attractiveness Analysis by Sample Type, 2023 to 2033

Figure 140: East Asia Market Attractiveness Analysis by Application, 2023 to 2033

Figure 141: East Asia Market Attractiveness Analysis by End User, 2023 to 2033

Figure 142: East Asia Market Attractiveness Analysis by Country, 2023 to 2033

Figure 143: China Market Value Proportion Analysis, 2022

Figure 144: Global Vs. China Growth Comparison

Figure 145: China Market Share Analysis (%) by Product, 2022 & 2033

Figure 146: China Market Share Analysis (%) by Sample Type, 2022 & 2033

Figure 147: China Market Share Analysis (%) by Application, 2022 & 2033

Figure 148: China Market Share Analysis (%) by End User, 2022 & 2033

Figure 149: Japan Market Value Proportion Analysis, 2022

Figure 150: Global Vs. Japan Growth Comparison

Figure 151: Japan Market Share Analysis (%) by Product, 2022 & 2033

Figure 152: Japan Market Share Analysis (%) by Sample Type, 2022 & 2033

Figure 153: Japan Market Share Analysis (%) by Application, 2022 & 2033

Figure 154: Japan Market Share Analysis (%) by End User, 2022 & 2033

Figure 155: South Korea Market Value Proportion Analysis, 2022

Figure 156: Global Vs South Korea Growth Comparison

Figure 157: South Korea Market Share Analysis (%) by Product, 2022 & 2033

Figure 158: South Korea Market Share Analysis (%) by Sample Type, 2022 & 2033

Figure 159: South Korea Market Share Analysis (%) by Application, 2022 & 2033

Figure 160: South Korea Market Share Analysis (%) by End User, 2022 & 2033

Figure 161: South Asia Market Value (US$ Million) Analysis, 2017 to 2022

Figure 162: South Asia Market Value (US$ Million) Forecast, 2023 to 2033

Figure 163: South Asia Market Value Share, by Product (2023 E)

Figure 164: South Asia Market Value Share, by Sample Type (2023 E)

Figure 165: South Asia Market Value Share, by Application (2023 E)

Figure 166: South Asia Market Value Share, by End User (2023 E)

Figure 167: South Asia Market Value Share, by Country (2023 E)

Figure 168: South Asia Market Attractiveness Analysis by Product, 2023 to 2033

Figure 169: South Asia Market Attractiveness Analysis by Sample Type, 2023 to 2033

Figure 170: South Asia Market Attractiveness Analysis by Application, 2023 to 2033

Figure 171: South Asia Market Attractiveness Analysis by End User, 2023 to 2033

Figure 172: South Asia Market Attractiveness Analysis by Country, 2023 to 2033

Figure 173: India Market Value Proportion Analysis, 2022

Figure 174: Global Vs. India Growth Comparison

Figure 175: India Market Share Analysis (%) by Product, 2022 & 2033

Figure 176: India Market Share Analysis (%) by Sample Type, 2022 & 2033

Figure 177: India Market Share Analysis (%) by Application, 2022 & 2033

Figure 178: India Market Share Analysis (%) by End User, 2022 & 2033

Figure 179: Indonesia Market Value Proportion Analysis, 2022

Figure 180: Global Vs. Indonesia Growth Comparison

Figure 181: Indonesia Market Share Analysis (%) by Product, 2022 & 2033

Figure 182: Indonesia Market Share Analysis (%) by Sample Type, 2022 & 2033

Figure 183: Indonesia Market Share Analysis (%) by Application, 2022 & 2033

Figure 184: Indonesia Market Share Analysis (%) by End User, 2022 & 2033

Figure 185: Malaysia Market Value Proportion Analysis, 2022

Figure 186: Global Vs. Malaysia Growth Comparison

Figure 187: Malaysia Market Share Analysis (%) by Product, 2022 & 2033

Figure 188: Malaysia Market Share Analysis (%) by Sample Type, 2022 & 2033

Figure 189: Malaysia Market Share Analysis (%) by Application, 2022 & 2033

Figure 190: Malaysia Market Share Analysis (%) by End User, 2022 & 2033

Figure 191: Thailand Market Value Proportion Analysis, 2022

Figure 192: Global Vs. Thailand Growth Comparison

Figure 193: Thailand Market Share Analysis (%) by Product, 2022 & 2033

Figure 194: Thailand Market Share Analysis (%) by Sample Type, 2022 & 2033

Figure 195: Thailand Market Share Analysis (%) by Application, 2022 & 2033

Figure 196: Thailand Market Share Analysis (%) by End User, 2022 & 2033

Figure 197: Oceania Market Value (US$ Million) Analysis, 2017 to 2022

Figure 198: Oceania Market Value (US$ Million) Forecast, 2023 to 2033

Figure 199: Oceania Market Value Share, by Product (2023 E)

Figure 200: Oceania Market Value Share, by Sample Type (2023 E)

Figure 201: Oceania Market Value Share, by Application (2023 E)

Figure 202: Oceania Market Value Share, by End User (2023 E)

Figure 203: Oceania Market Value Share, by Country (2023 E)

Figure 204: Oceania Market Attractiveness Analysis by Product, 2023 to 2033

Figure 205: Oceania Market Attractiveness Analysis by Sample Type, 2023 to 2033

Figure 206: Oceania Market Attractiveness Analysis by Application, 2023 to 2033

Figure 207: Oceania Market Attractiveness Analysis by End User, 2023 to 2033

Figure 208: Oceania Market Attractiveness Analysis by Country, 2023 to 2033

Figure 209: Australia Market Value Proportion Analysis, 2022

Figure 210: Global Vs. Australia Growth Comparison

Figure 211: Australia Market Share Analysis (%) by Product, 2022 & 2033

Figure 212: Australia Market Share Analysis (%) by Sample Type, 2022 & 2033

Figure 213: Australia Market Share Analysis (%) by Application, 2022 & 2033

Figure 214: Australia Market Share Analysis (%) by End User, 2022 & 2033

Figure 215: New Zealand Market Value Proportion Analysis, 2022

Figure 216: Global Vs New Zealand Growth Comparison

Figure 217: New Zealand Market Share Analysis (%) by Product, 2022 & 2033

Figure 218: New Zealand Market Share Analysis (%) by Sample Type, 2022 & 2033

Figure 219: New Zealand Market Share Analysis (%) by Application, 2022 & 2033

Figure 220: New Zealand Market Share Analysis (%) by End User, 2022 & 2033

Figure 221: Middle East & Africa Market Value (US$ Million) Analysis, 2017 to 2022

Figure 222: Middle East & Africa Market Value (US$ Million) Forecast, 2023 to 2033

Figure 223: Middle East & Africa Market Value Share, by Product (2023 E)

Figure 224: Middle East & Africa Market Value Share, by Sample Type (2023 E)

Figure 225: Middle East & Africa Market Value Share, by Application (2023 E)

Figure 226: Middle East & Africa Market Value Share, by End User (2023 E)

Figure 227: Middle East & Africa Market Value Share, by Country (2023 E)

Figure 228: Middle East & Africa Market Attractiveness Analysis by Product, 2023 to 2033

Figure 229: Middle East & Africa Market Attractiveness Analysis by Sample Type, 2023 to 2033

Figure 230: Middle East & Africa Market Attractiveness Analysis by Application, 2023 to 2033

Figure 231: Middle East & Africa Market Attractiveness Analysis by End User, 2023 to 2033

Figure 232: Middle East & Africa Market Attractiveness Analysis by Country, 2023 to 2033

Figure 233: GCC Countries Market Value Proportion Analysis, 2022

Figure 234: Global Vs GCC Countries Growth Comparison

Figure 235: GCC Countries Market Share Analysis (%) by Product, 2022 & 2033

Figure 236: GCC Countries Market Share Analysis (%) by Sample Type, 2022 & 2033

Figure 237: GCC Countries Market Share Analysis (%) by Application, 2022 & 2033

Figure 238: GCC Countries Market Share Analysis (%) by End User, 2022 & 2033

Figure 239: Türkiye Market Value Proportion Analysis, 2022

Figure 240: Global Vs. Türkiye Growth Comparison

Figure 241: Türkiye Market Share Analysis (%) by Product, 2022 & 2033

Figure 242: Türkiye Market Share Analysis (%) by Sample Type, 2022 & 2033

Figure 243: Türkiye Market Share Analysis (%) by Application, 2022 & 2033

Figure 244: Türkiye Market Share Analysis (%) by End User, 2022 & 2033

Figure 245: South Africa Market Value Proportion Analysis, 2022

Figure 246: Global Vs. South Africa Growth Comparison

Figure 247: South Africa Market Share Analysis (%) by Product, 2022 & 2033

Figure 248: South Africa Market Share Analysis (%) by Sample Type, 2022 & 2033

Figure 249: South Africa Market Share Analysis (%) by Application, 2022 & 2033

Figure 250: South Africa Market Share Analysis (%) by End User, 2022 & 2033

Figure 251: Northern Africa Market Value Proportion Analysis, 2022

Figure 252: Global Vs Northern Africa Growth Comparison

Figure 253: Northern Africa Market Share Analysis (%) by Product, 2022 & 2033

Figure 254: Northern Africa Market Share Analysis (%) by Sample Type, 2022 & 2033

Figure 255: Northern Africa Market Share Analysis (%) by Application, 2022 & 2033

Figure 256: Northern Africa Market Share Analysis (%) by End User, 2022 & 2033

Frequently Asked Questions

What is the Clinical Immunodiagnostics Market Size in 2023?

The clinical immunodiagnostics market size is valued at USD 5.0 billion in 2023.

What was the United States’ share in the North American Clinical Immunodiagnostics Market?

The United States occupied 91.1% of the North American clinical immunodiagnostics market share in 2022.

What was China’s CAGR in the East Asia Clinical Immunodiagnostics Market in 2022?

China’s clinical immunodiagnostics market in East Asia rose at a 6.4% CAGR in 2022.

Which product is swiftly expanding in the Clinical Immunodiagnostics Market?

The immunoassay kits & reagents segment will thrive at a 5.4% CAGR from 2023 to 2033.

What was the leading application in the Clinical Immunodiagnostics Market in 2022?

The infectious disease segment garnered 20.7% of the clinical immunodiagnostics market’s revenue share in 2022.

Explore Similar Insights

Future Market Insights

Clinical Immunodiagnostics Market