Reports

- Global Locations -

Headquarters

Future Market Insights, Inc.

Christiana Corporate, 200
Continental Drive, Suite 401,
Newark, Delaware - 19713,
United States

T: +1-845-579-5705

Americas

Future Market Insights, Inc.

616 Corporate Way, Suite 2-9018,
Valley Cottage, NY 10989, United States

T: +1-347-918-3531

MEA

Future Market Insights

1602-6 Jumeirah Bay X2 Tower, Plot No: JLT-PH2-X2A,
Jumeirah Lakes Towers, Dubai,
United Arab Emirates

Europe

Future Market Insights

3rd Floor, 207 Regent Street,
W1B 3HH London
United Kingdom

T: + 44 (0) 20 8123 9659
D: +44 (0) 20 3287 4268

Asia Pacific

Future Market Insights

IndiaLand Global Tech Park, Unit UG-1, Behind Grand HighStreet, Phase 1, Hinjawadi, MH, Pune – 411057, India

Clinical Decision Support Systems Market Outlook

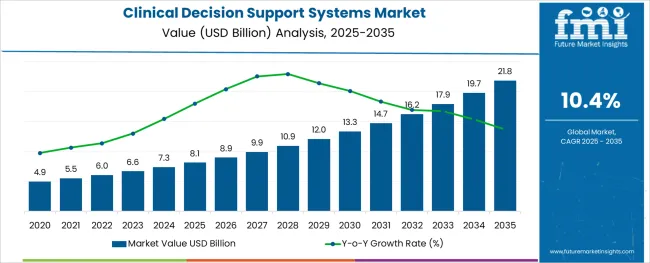
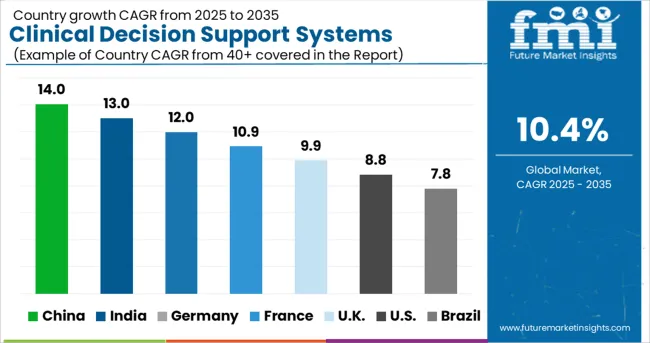
[333 Pages Report] The global clinical decision support systems market is projected to have a moderate-paced CAGR of 10.4% during the forecast period. The current valuation of the clinical decision support systems market is US$ 5.46 Bn in 2023. The value of the clinical decision support systems market is anticipated to reach a high of US$ 14.69 Bn by the year 2033.

This growth in the sales of clinical decision support systems is supported by the following:

  • Growing need for high-caliber medical treatment and dependable technological integration.
  • An uptick in the adoption of information clinical decision support solutions by hospitals and healthcare institutes
  • Supportive measures taken by several governments across the globe
  • Increasing global frequency of chronic diseases

Don't pay for what you don't need

Customize your report by selecting specific countries or regions and save 30%!

The Growth of Cloud Based CDSS

The growth of the cloud-based sector of the market is being fuelled primarily by rising healthcare costs and the widespread use of cloud computing. Governments across Europe are taking steps to encourage the expansion of healthcare IT. For instance, in February 2021, nearly two million National Health Services (NHS) mail mailboxes were migrated to Exchange Online, which is a part of Microsoft's Azure Cloud, as part of the UK government's aim to embrace a fully linked cloud-driven health service. Staff across NHS organizations and departments is expected to be able to communicate with one another more effectively and have easier access to relevant data as a result of this. Because of this, the need for HCIT Change Management services in the United Kingdom is likely to rise, driving the industry forward.

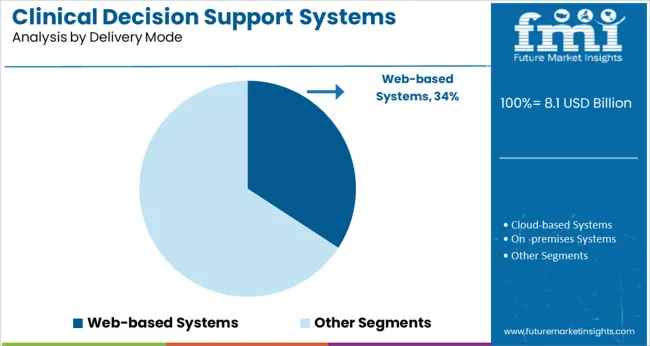
Additionally, clinical decision support solutions that rely on local knowledge management may incur substantial running expenses due to the large amounts of processing power and storage space that may be required. Unlike locally hosted apps, cloud-based ones are hosted on remote servers and don't necessitate a lot of processing power or storage space on the user's end.

By design, cloud-based apps are more secure than their web-based counterparts since they don't rely on browsers. The processing nodes of cloud-based clinical decision support solutions reside on distant servers, which may be in several different data centres across the world. Over the forecast period, cloud-based CDSS adoption is likely to rise in tandem with the proliferation of cloud technologies due to their many advantages.

Attributes Details
Market Value (2023) US$ 5.46 Billion
Market Value (2033) US$ 14.69 Billion
CAGR 10.4%

Key Drivers and Restraints for the Clinical Decision Support Systems Market

Increasing technological sophistication and the growing influence of social media.

Another developing pattern in CDSS products is providing access to many media outlets. For instance, social media data acquired for patients with chronic diseases have been included in the cloud-based Smart Clinical Decision Support System (Smart CDSS) established by independent researchers. This information is combined with clinical observations from actual patient experiences. Patient health, mood, and hobbies are tracked through their social media activity by the system. It gathers patient-specific information from Twitter, e-mail analysis, and other social media platforms by mining for keywords, concepts, and feelings. As a result, doctors are better able to make treatment decisions based on the individual patient's behaviour and way of life. The data is then used by the Smart CDSS to make personalised suggestions for each individual patient.

Problems with cloud based CDSS data security

Data hosted by the vendor is not as secure as on-premises data, which is a big problem with cloud-based CDSS. The confidentiality of patient records is of the utmost importance to ensure that data is only accessed by those who have a legitimate need to know. Data privacy regulations regulated under HIPAA, for example, are constantly under review by legal frameworks (Health Insurance Portability and Accountability Act). The EU Data Protection Regulation also has ramifications for the security of personal health information in the European Union. The healthcare business is uncertain about the efficacy of private clouds, despite their offering of additional access methods and health information technology systems.

A severe lack of competent information technology specialists is plaguing the healthcare sector.

Strong IT infrastructure and support, both inside the company and from the solution vendor, are required for the effective use of healthcare IT solutions. It is essential for a healthcare business to have reliable technical assistance in order to keep its server and network running smoothly, which is essential for clinical workflows and healthcare IT system interface performance. Poor server or network maintenance can cause screen loads, which in turn can impede down clinical workflow. Adoption and deployment of health information technology systems, whether cloud-based or installed on-premises, are hampered by a lack of educated and qualified labor in key markets.

Sabyasachi Ghosh
Sabyasachi Ghosh

Principal Consultant

Talk to Analyst

Find your sweet spots for generating winning opportunities in this market.

Comparative Analysis of Adjacent Markets

Clinical Decision Support Systems Market

Differentiating Aspects Clinical Decision Support Systems Market
CAGR 10.4%
Market Valuation in 2023 US$ 5.46 Billion
Projected Market Value in 2033 US$ 14.69 Billion
Drivers
  • The demand for high-quality medical care and reliable technological integration continues to rise.
  • More healthcare facilities are implementing IT infrastructure.
  • Efforts done by numerous governments around the world to help
  • Consistent rise in the prevalence of chronic diseases around the world

Healthcare Cloud Computing Market:

Differentiating Aspects Healthcare Cloud Computing Market
CAGR 15.6%
Market Valuation in 2023 US$ 54,385.9 Million
Projected Market Value in 2033 US$ 173,886.3 Million
Drivers
  • Getting more products to market or approved for release
  • The popularity of telemedicine is rising.

Teleradiology Services Market:

Differentiating Aspects Teleradiology Services Market
CAGR 12.1%
Market Valuation in 2023 US$ 9,011.6 Million
Projected Market Value in 2033 US$ 22,520.8 Million
Drivers
  • Key participants in the industry should increase the rate of product launches.
  • Inking deals to supply teleradiology services
  • The expensive nature of teleradiology products and services.
  • Inadequate data security
  • Visual quality decline

Category-wise Insights

By Product

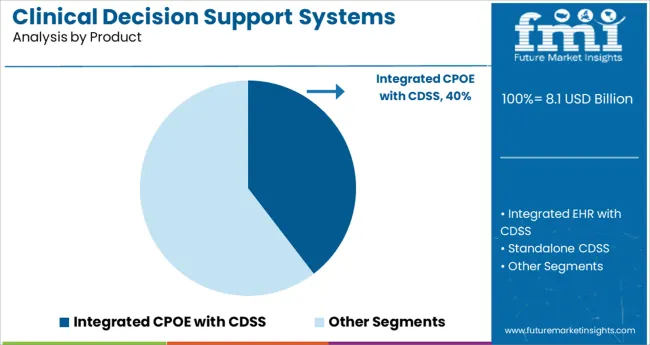
In 2021, standalone CDSS had more than 31.00% of the market because of its widespread adoption, low cost, and ease of use. As a result of its superior usability in healthcare facilities, it has taken the lead in most of these applications. Throughout the anticipated time frame, the solo subsegment is expected to maintain its dominant position. CDSS solutions can function alone or can be integrated with an electronic health record system or computerized provider order entry system.

By 2030, the market for integrated EHR and CDSS is expected to have grown substantially. The percentage of CDSS that is integrated with EHR is likely to change as more and more multi-specialty healthcare units become familiar with and use EHR. These health information technology systems collect patient data and send it to a clinical decision support system (CDSS), which then automates the clinical workflow by providing the doctor with clinical solutions and prescription recommendations. Integration between CDSS and EHRs is commonplace to facilitate the utilization of existing data sets and improve efficiency. The increasing integration of CDSS features into EHR systems is a factor that bodes well for the development of this market.

By Application

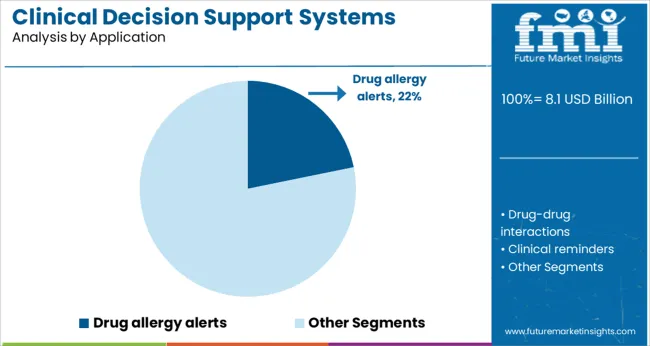
In 2021, drug allergy alerts had more than 26.0% share of the market. Since many people have life-threatening reactions to even the smallest amounts of some medications, it's crucial to have early warning systems in place. Allergies, especially those to medication, are becoming more of a problem. Accidental pharmaceutical administration to a patient with a known allergy, for example, is an example of a medicine error that can have serious consequences at any stage of the drug's life cycle.

During the foreseeable future, the market for clinical guidelines should expand at a profitable rate. The CDS provides recommendations for both diagnosis and treatment. It accesses information stored in a database and applies it to patient care, giving the doctor or nurse specific instructions to follow when they provide treatment.
Get the data you need at a Fraction of the cost

Personalize your report by choosing insights you need
and save 40%!

Regional Insights

United States

Market Value (2023) US$ 5.92 Billion
Market Value (2033) US$ 14.41 Billion
CAGR 9.3%

USA market is expected to reach a valuation of US$ 14.41 Billion by 2033 from US$ 5.92 Bn in 2023. The growth rate is likely to be 9.3%.

One of the key factors in the region's rising market revenue is the development of information technology in the medical sector. The use of electronic health record (EHR)-equipped clinical decision support system platforms is expected to rise in the United States throughout the healthcare industry in the next years, as reported by the Office of the National Coordinator for Health Information Technology (ONC). A rise in adoption can be seen in areas such as pediatric healthcare (68%) and specialty industries (43%). The increasing need for CDSS that integrates with electronic health records is driving the market expansion in this area. This region's governments are likewise making investments in an automated healthcare environment powered by AI.

Furthermore, governments are implementing programmes to raise awareness among hospitals of the uses and benefits of CDSS, as well as the wide range of innovative CDSS technologies currently available. For instance, the U.S. Centers for Medicare & Medicaid Services (CMS) announced on November 18, 2020, that it would offer incentives to doctors who use certain clinical decision-support devices when making a diagnosis. Incentives for the use of Viz.ai's ContaCT and Digital Diagnostics' IDX-DR have been announced by CMS. There has been a rise in market revenue in this area thanks to these strategic activities.

Europe

In 2021, Europe remained a reliable source of revenue. The clinical decision support system market is growing as a result of rising investments in the digitalization and automation of healthcare services. UK-based NHS provider Global Digital Exemplar reports that the government of the United Kingdom invested GBP 395 million to facilitate greater integration of clinical decision support solutions across the healthcare sector. Clinical decision systems in healthcare that are integrated with artificial intelligence have been established with funding from the governments of France (EUR 500 million) and Germany (EUR 3.4 billion). It is anticipated that these funds would be used to enhance Europe's clinical decision support system platform's information technology infrastructure and related services.

Demand for clinical decision support system hardware is growing in this area for several reasons, including the region's growing elderly population. European Union (EU) estimates suggest that by 2021, one in five Europeans is expected to be 65 or older. The percentage of the EU's population that is 80 or older is projected to rise from 6% in 2021 to 14.6% in 2100. Moreover, an aging population means an increase in patient load, which should boost demand for clinical decision support systems in the future.

Japan

High rates of medication errors, the rising popularity of big data and mobile health applications, the rising adoption of cloud computing in healthcare, rising returns on investment for CDSS solutions, and collaborations between clinical decision support businesses and medical research organisations are the primary factors propelling the CDSS market. However, the industry could be hampered by skepticism about mobile CDSS, worries about cloud-based CDSS's security, the need for costly IT infrastructure, and a lack of interoperability. Increases in healthcare IT solution innovation and the emergence of new healthcare IT markets present promising prospects.

China

Significant clinical decision support systems market revenue growth in this region is being driven by an increase in the number of patients and an increase in the need for AI-enabled automated equipment. There has been a recent uptick in the number of healthcare and IT company mergers, which bodes well for the market's future revenue growth. Elsevier and Gramin Health Care launched their artificial intelligence (AI)-powered platform ClinicalPath Primary Care India in the fall of 2021. A clinical decision support tool, it automates clinical guidelines for antenatal care, allowing for more individualized care for mothers experiencing complications during pregnancy. Additionally, it gives first responders in the field of mother and infant health access to automated medical prescriptions and counseling.

Start-up Ecosystem

New Entrants to Foster Innovation in the Global Market

The startups in the clinical decision support systems market are adding a new edge to the properties of excavators by curating innovations beyond the imagination. They are continually upgrading the Clinical Decision Support Systems with advanced technology, and manufacturers and sellers are continuously attempting to reduce costs for greater accessibility to the market share. Startup firms are triggering the expansion of the clinical decision support systems market with their unique attempts.

Top startups operating in the market are:

Name Description
DXS International As a clinical decision support provider, DXS International has been serving the primary care and retail pharmacy industries. A Clinical Decision Support System, DXS Point-of-Care (DXS PoC) (CDSS). Best Triage is a triage management solution that helps prioritise patients for medical treatment based on the severity of the condition or injury and acts as a referral peer review platform; Best Script is a medicine database; and Best Pathways is a care protocol that includes NHS Best Evidence guidance for each stage of the management of a patient with a specific condition. DXS Directory-of-Services (DoS) is an up-to-date resource for primary care physicians and nurses looking for referral information.
Agathos Clinicians' decision-making software. The company's web interface and analytics platform compile a wide range of clinical, claims, and economic data; define objectives by blending external standards with administrator and physician incentives; deliver timely, relevant, and actionable insights to physicians; and modify content to maximise user engagement and the attainment of objectives. Most of the the company's income comes from monthly subscription fees charged to doctors by system administrators for using the software as a service.

Competitive Landscape

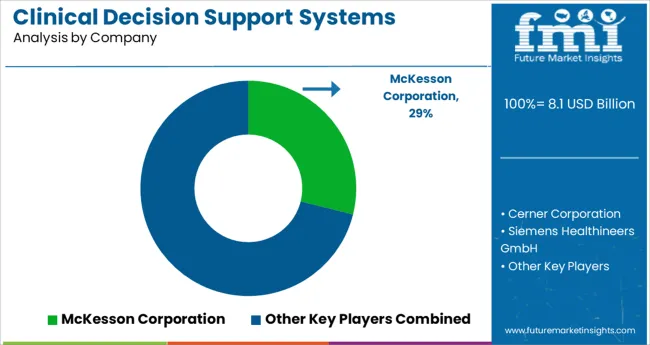
As with many industries, competition in the global demand for clinical decision support systems is fierce. Market leaders include companies like McKesson, Philips, Wolters Kluwer, Cerner, Siemens, and Wolters Kluwer NU. To differentiate themselves from the competition, these companies create new products, develop improved versions of existing ones, merge with others, and form strategic alliances.

To give one specific example, in April 2021, Change Healthcare introduced InterQual 2021, the latest edition of the company's main CDS product. New guidelines for COVID-19 patients, consideration of socioeconomic determinants of health, and appropriate telehealth use are just a few of the evidence-based content updates and additions that accompany this release's four novel Medicare criterion elements.

In addition, a CDSS for the detection of COVID-19 was announced to be developed in collaboration with DHIndia, EHRC@IIITB, and Healthelife in May 2020. The collaboration also resulted in the development of a basic triage program for use by emergency room physicians.

Market leaders in clinical decision support systems worldwide include:

Key Segments in the Clinical Decision Support Systems Market

Product:

  • Integrated CPOE with CDSS
  • Integrated EHR with CDSS
  • Standalone CDSS
  • Integrated CDSS with CPOE & EHR

Application:

  • Drug allergy alerts
  • Drug-drug interactions
  • Clinical reminders
  • Clinical guidelines
  • Drug dosing support
  • Others

Delivery Mode:

  • Web-based Systems
  • Cloud-based Systems
  • On -premises Systems

Component:

  • Hardware
  • Software
  • Services

By Region:

  • North America
  • Latin America
  • Asia Pacific
  • MEA
  • Europe

Frequently Asked Questions

What is the Growth Outlook for the Clinical Decision Support Systems Market?

The growth outlook for the Clinical Decision Support Systems market is predicted to advance at a CAGR of 10.4% from 2023 to 2033.

Which Region Leads the Clinical Decision Support Systems Market?

The North American region is anticipated to lead the Clinical Decision Support Systems market during the forecast period.

What is the market valuation of Clinical Decision Support Systems in 2023?

The market valuation of the Clinical Decision Support Systems market stands at US$ 5.46 Bn in 2023.

How much Growth Potential does Clinical Decision Support Systems hold?

The Clinical Decision Support Systems market is likely to hold a valuation of US$ 14.69 Bn by 2033.

Table of Content

1. Executive Summary

    1.1. Global Market Outlook

    1.2. Demand-side Trends

    1.3. Supply-side Trends

    1.4. Technology Roadmap Analysis

    1.5. Analysis and Recommendations

2. Market Overview

    2.1. Market Coverage / Taxonomy

    2.2. Market Definition / Scope / Limitations

3. Market Background

    3.1. Market Dynamics

        3.1.1. Drivers

        3.1.2. Restraints

        3.1.3. Opportunity

        3.1.4. Trends

    3.2. Scenario Forecast

        3.2.1. Demand in Optimistic Scenario

        3.2.2. Demand in Likely Scenario

        3.2.3. Demand in Conservative Scenario

    3.3. Opportunity Map Analysis

    3.4. Investment Feasibility Matrix

    3.5. PESTLE and Porter’s Analysis

    3.6. Regulatory Landscape

        3.6.1. By Key Regions

        3.6.2. By Key Countries

    3.7. Regional Parent Market Outlook

4. Global Market Analysis 2017-2021 and Forecast, 2022-2032

    4.1. Historical Market Size Value (US$ Mn) Analysis, 2017-2021

    4.2. Current and Future Market Size Value (US$ Mn) Projections, 2022-2032

        4.2.1. Y-o-Y Growth Trend Analysis

        4.2.2. Absolute $ Opportunity Analysis

5. Global Market Analysis 2017-2021 and Forecast 2022-2032, By Product

    5.1. Introduction / Key Findings

    5.2. Historical Market Size Value (US$ Mn) Analysis By Product, 2017-2021

    5.3. Current and Future Market Size Value (US$ Mn) Analysis and Forecast By Product, 2022-2032

        5.3.1. Standalone CDSS

        5.3.2. Integrated CPOE with CDSS

        5.3.3. Integrated E.H.R. with CDSS

        5.3.4. Integrated CDSS with CPOE & E.H.R.

    5.4. Y-o-Y Growth Trend Analysis By Product, 2017-2021

    5.5. Absolute $ Opportunity Analysis By Product, 2022-2032

6. Global Market Analysis 2017-2021 and Forecast 2022-2032, By Application

    6.1. Introduction / Key Findings

    6.2. Historical Market Size Value (US$ Mn) Analysis By Application , 2017-2021

    6.3. Current and Future Market Size Value (US$ Mn) Analysis and Forecast By Application , 2022-2032

        6.3.1. Drug-drug interactions

        6.3.2. Drug allergy alerts

        6.3.3. Clinical reminders

        6.3.4. Clinical guidelines

        6.3.5. Drug dosing support

        6.3.6. Others

    6.4. Y-o-Y Growth Trend Analysis By Application , 2017-2021

    6.5. Absolute $ Opportunity Analysis By Application , 2022-2032

7. Global Market Analysis 2017-2021 and Forecast 2022-2032, By Delivery Mode

    7.1. Introduction / Key Findings

    7.2. Historical Market Size Value (US$ Mn) Analysis By Delivery Mode , 2017-2021

    7.3. Current and Future Market Size Value (US$ Mn) Analysis and Forecast By Delivery Mode , 2022-2032

        7.3.1. Web Delivery

        7.3.2. Cloud Delivery

        7.3.3. On Premises Delivery

    7.4. Y-o-Y Growth Trend Analysis By Delivery Mode , 2017-2021

    7.5. Absolute $ Opportunity Analysis By Delivery Mode , 2022-2032

8. Global Market Analysis 2017-2021 and Forecast 2022-2032, By Component

    8.1. Introduction / Key Findings

    8.2. Historical Market Size Value (US$ Mn) Analysis By Component , 2017-2021

    8.3. Current and Future Market Size Value (US$ Mn) Analysis and Forecast By Component , 2022-2032

        8.3.1. Hardware

        8.3.2. Software

        8.3.3. Services

    8.4. Y-o-Y Growth Trend Analysis By Component , 2017-2021

    8.5. Absolute $ Opportunity Analysis By Component , 2022-2032

9. Global Market Analysis 2017-2021 and Forecast 2022-2032, By Region

    9.1. Introduction

    9.2. Historical Market Size Value (US$ Mn) Analysis By Region, 2017-2021

    9.3. Current Market Size Value (US$ Mn) Analysis and Forecast By Region, 2022-2032

        9.3.1. North America

        9.3.2. Latin America

        9.3.3. Europe

        9.3.4. South Asia

        9.3.5. East Asia

        9.3.6. Oceania

        9.3.7. MEA

    9.4. Market Attractiveness Analysis By Region

10. North America Market Analysis 2017-2021 and Forecast 2022-2032, By Country

    10.1. Historical Market Size Value (US$ Mn) Trend Analysis By Market Taxonomy, 2017-2021

    10.2. Market Size Value (US$ Mn) Forecast By Market Taxonomy, 2022-2032

        10.2.1. By Country

            10.2.1.1. U.S.

            10.2.1.2. Canada

        10.2.2. By Product

        10.2.3. By Application

        10.2.4. By Delivery Mode

        10.2.5. By Component

    10.3. Market Attractiveness Analysis

        10.3.1. By Country

        10.3.2. By Product

        10.3.3. By Application

        10.3.4. By Delivery Mode

        10.3.5. By Component

    10.4. Key Takeaways

11. Latin America Market Analysis 2017-2021 and Forecast 2022-2032, By Country

    11.1. Historical Market Size Value (US$ Mn) Trend Analysis By Market Taxonomy, 2017-2021

    11.2. Market Size Value (US$ Mn) Forecast By Market Taxonomy, 2022-2032

        11.2.1. By Country

            11.2.1.1. Brazil

            11.2.1.2. Mexico

            11.2.1.3. Rest of Latin America

        11.2.2. By Product

        11.2.3. By Application

        11.2.4. By Delivery Mode

        11.2.5. By Component

    11.3. Market Attractiveness Analysis

        11.3.1. By Country

        11.3.2. By Product

        11.3.3. By Application

        11.3.4. By Delivery Mode

        11.3.5. By Component

    11.4. Key Takeaways

12. Europe Market Analysis 2017-2021 and Forecast 2022-2032, By Country

    12.1. Historical Market Size Value (US$ Mn) Trend Analysis By Market Taxonomy, 2017-2021

    12.2. Market Size Value (US$ Mn) Forecast By Market Taxonomy, 2022-2032

        12.2.1. By Country

            12.2.1.1. Germany

            12.2.1.2. U.K.

            12.2.1.3. France

            12.2.1.4. Spain

            12.2.1.5. Italy

            12.2.1.6. Rest of Europe

        12.2.2. By Product

        12.2.3. By Application

        12.2.4. By Delivery Mode

        12.2.5. By Component

    12.3. Market Attractiveness Analysis

        12.3.1. By Country

        12.3.2. By Product

        12.3.3. By Application

        12.3.4. By Delivery Mode

        12.3.5. By Component

    12.4. Key Takeaways

13. South Asia Market Analysis 2017-2021 and Forecast 2022-2032, By Country

    13.1. Historical Market Size Value (US$ Mn) Trend Analysis By Market Taxonomy, 2017-2021

    13.2. Market Size Value (US$ Mn) Forecast By Market Taxonomy, 2022-2032

        13.2.1. By Country

            13.2.1.1. India

            13.2.1.2. Malaysia

            13.2.1.3. Singapore

            13.2.1.4. Thailand

            13.2.1.5. Rest of South Asia

        13.2.2. By Product

        13.2.3. By Application

        13.2.4. By Delivery Mode

        13.2.5. By Component

    13.3. Market Attractiveness Analysis

        13.3.1. By Country

        13.3.2. By Product

        13.3.3. By Application

        13.3.4. By Delivery Mode

        13.3.5. By Component

    13.4. Key Takeaways

14. East Asia Market Analysis 2017-2021 and Forecast 2022-2032, By Country

    14.1. Historical Market Size Value (US$ Mn) Trend Analysis By Market Taxonomy, 2017-2021

    14.2. Market Size Value (US$ Mn) Forecast By Market Taxonomy, 2022-2032

        14.2.1. By Country

            14.2.1.1. China

            14.2.1.2. Japan

            14.2.1.3. South Korea

        14.2.2. By Product

        14.2.3. By Application

        14.2.4. By Delivery Mode

        14.2.5. By Component

    14.3. Market Attractiveness Analysis

        14.3.1. By Country

        14.3.2. By Product

        14.3.3. By Application

        14.3.4. By Delivery Mode

        14.3.5. By Component

    14.4. Key Takeaways

15. Oceania Market Analysis 2017-2021 and Forecast 2022-2032, By Country

    15.1. Historical Market Size Value (US$ Mn) Trend Analysis By Market Taxonomy, 2017-2021

    15.2. Market Size Value (US$ Mn) Forecast By Market Taxonomy, 2022-2032

        15.2.1. By Country

            15.2.1.1. Australia

            15.2.1.2. New Zealand

        15.2.2. By Product

        15.2.3. By Application

        15.2.4. By Delivery Mode

        15.2.5. By Component

    15.3. Market Attractiveness Analysis

        15.3.1. By Country

        15.3.2. By Product

        15.3.3. By Application

        15.3.4. By Delivery Mode

        15.3.5. By Component

    15.4. Key Takeaways

16. MEA Market Analysis 2017-2021 and Forecast 2022-2032, By Country

    16.1. Historical Market Size Value (US$ Mn) Trend Analysis By Market Taxonomy, 2017-2021

    16.2. Market Size Value (US$ Mn) Forecast By Market Taxonomy, 2022-2032

        16.2.1. By Country

            16.2.1.1. GCC Countries

            16.2.1.2. South Africa

            16.2.1.3. Israel

            16.2.1.4. Rest of MEA

        16.2.2. By Product

        16.2.3. By Application

        16.2.4. By Delivery Mode

        16.2.5. By Component

    16.3. Market Attractiveness Analysis

        16.3.1. By Country

        16.3.2. By Product

        16.3.3. By Application

        16.3.4. By Delivery Mode

        16.3.5. By Component

    16.4. Key Takeaways

17. Key Countries Market Analysis

    17.1. U.S.

        17.1.1. Pricing Analysis

        17.1.2. Market Share Analysis, 2021

            17.1.2.1. By Product

            17.1.2.2. By Application

            17.1.2.3. By Delivery Mode

            17.1.2.4. By Component

    17.2. Canada

        17.2.1. Pricing Analysis

        17.2.2. Market Share Analysis, 2021

            17.2.2.1. By Product

            17.2.2.2. By Application

            17.2.2.3. By Delivery Mode

            17.2.2.4. By Component

    17.3. Brazil

        17.3.1. Pricing Analysis

        17.3.2. Market Share Analysis, 2021

            17.3.2.1. By Product

            17.3.2.2. By Application

            17.3.2.3. By Delivery Mode

            17.3.2.4. By Component

    17.4. Mexico

        17.4.1. Pricing Analysis

        17.4.2. Market Share Analysis, 2021

            17.4.2.1. By Product

            17.4.2.2. By Application

            17.4.2.3. By Delivery Mode

            17.4.2.4. By Component

    17.5. Germany

        17.5.1. Pricing Analysis

        17.5.2. Market Share Analysis, 2021

            17.5.2.1. By Product

            17.5.2.2. By Application

            17.5.2.3. By Delivery Mode

            17.5.2.4. By Component

    17.6. U.K.

        17.6.1. Pricing Analysis

        17.6.2. Market Share Analysis, 2021

            17.6.2.1. By Product

            17.6.2.2. By Application

            17.6.2.3. By Delivery Mode

            17.6.2.4. By Component

    17.7. France

        17.7.1. Pricing Analysis

        17.7.2. Market Share Analysis, 2021

            17.7.2.1. By Product

            17.7.2.2. By Application

            17.7.2.3. By Delivery Mode

            17.7.2.4. By Component

    17.8. Spain

        17.8.1. Pricing Analysis

        17.8.2. Market Share Analysis, 2021

            17.8.2.1. By Product

            17.8.2.2. By Application

            17.8.2.3. By Delivery Mode

            17.8.2.4. By Component

    17.9. Italy

        17.9.1. Pricing Analysis

        17.9.2. Market Share Analysis, 2021

            17.9.2.1. By Product

            17.9.2.2. By Application

            17.9.2.3. By Delivery Mode

            17.9.2.4. By Component

    17.10. India

        17.10.1. Pricing Analysis

        17.10.2. Market Share Analysis, 2021

            17.10.2.1. By Product

            17.10.2.2. By Application

            17.10.2.3. By Delivery Mode

            17.10.2.4. By Component

    17.11. Malaysia

        17.11.1. Pricing Analysis

        17.11.2. Market Share Analysis, 2021

            17.11.2.1. By Product

            17.11.2.2. By Application

            17.11.2.3. By Delivery Mode

            17.11.2.4. By Component

    17.12. Singapore

        17.12.1. Pricing Analysis

        17.12.2. Market Share Analysis, 2021

            17.12.2.1. By Product

            17.12.2.2. By Application

            17.12.2.3. By Delivery Mode

            17.12.2.4. By Component

    17.13. Thailand

        17.13.1. Pricing Analysis

        17.13.2. Market Share Analysis, 2021

            17.13.2.1. By Product

            17.13.2.2. By Application

            17.13.2.3. By Delivery Mode

            17.13.2.4. By Component

    17.14. China

        17.14.1. Pricing Analysis

        17.14.2. Market Share Analysis, 2021

            17.14.2.1. By Product

            17.14.2.2. By Application

            17.14.2.3. By Delivery Mode

            17.14.2.4. By Component

    17.15. Japan

        17.15.1. Pricing Analysis

        17.15.2. Market Share Analysis, 2021

            17.15.2.1. By Product

            17.15.2.2. By Application

            17.15.2.3. By Delivery Mode

            17.15.2.4. By Component

    17.16. South Korea

        17.16.1. Pricing Analysis

        17.16.2. Market Share Analysis, 2021

            17.16.2.1. By Product

            17.16.2.2. By Application

            17.16.2.3. By Delivery Mode

            17.16.2.4. By Component

    17.17. Australia

        17.17.1. Pricing Analysis

        17.17.2. Market Share Analysis, 2021

            17.17.2.1. By Product

            17.17.2.2. By Application

            17.17.2.3. By Delivery Mode

            17.17.2.4. By Component

    17.18. New Zealand

        17.18.1. Pricing Analysis

        17.18.2. Market Share Analysis, 2021

            17.18.2.1. By Product

            17.18.2.2. By Application

            17.18.2.3. By Delivery Mode

            17.18.2.4. By Component

    17.19. GCC Countries

        17.19.1. Pricing Analysis

        17.19.2. Market Share Analysis, 2021

            17.19.2.1. By Product

            17.19.2.2. By Application

            17.19.2.3. By Delivery Mode

            17.19.2.4. By Component

    17.20. South Africa

        17.20.1. Pricing Analysis

        17.20.2. Market Share Analysis, 2021

            17.20.2.1. By Product

            17.20.2.2. By Application

            17.20.2.3. By Delivery Mode

            17.20.2.4. By Component

    17.21. Israel

        17.21.1. Pricing Analysis

        17.21.2. Market Share Analysis, 2021

            17.21.2.1. By Product

            17.21.2.2. By Application

            17.21.2.3. By Delivery Mode

            17.21.2.4. By Component

18. Market Structure Analysis

    18.1. Competition Dashboard

    18.2. Competition Benchmarking

    18.3. Market Share Analysis of Top Players

        18.3.1. By Regional

        18.3.2. By Product

        18.3.3. By Application

        18.3.4. By Delivery Mode

        18.3.5. By Component

19. Competition Analysis

    19.1. Competition Deep Dive

        19.1.1. McKesson Corporation

            19.1.1.1. Overview

            19.1.1.2. Product Portfolio

            19.1.1.3. Profitability by Market Segments

            19.1.1.4. Sales Footprint

            19.1.1.5. Strategy Overview

                19.1.1.5.1. Marketing Strategy

        19.1.2. Cerner Corporation

            19.1.2.1. Overview

            19.1.2.2. Product Portfolio

            19.1.2.3. Profitability by Market Segments

            19.1.2.4. Sales Footprint

            19.1.2.5. Strategy Overview

                19.1.2.5.1. Marketing Strategy

        19.1.3. Siemens Healthineers GmbH

            19.1.3.1. Overview

            19.1.3.2. Product Portfolio

            19.1.3.3. Profitability by Market Segments

            19.1.3.4. Sales Footprint

            19.1.3.5. Strategy Overview

                19.1.3.5.1. Marketing Strategy

        19.1.4. Allscripts Healthcare, LLC

            19.1.4.1. Overview

            19.1.4.2. Product Portfolio

            19.1.4.3. Profitability by Market Segments

            19.1.4.4. Sales Footprint

            19.1.4.5. Strategy Overview

                19.1.4.5.1. Marketing Strategy

        19.1.5. athenahealth, Inc.

            19.1.5.1. Overview

            19.1.5.2. Product Portfolio

            19.1.5.3. Profitability by Market Segments

            19.1.5.4. Sales Footprint

            19.1.5.5. Strategy Overview

                19.1.5.5.1. Marketing Strategy

        19.1.6. NextGen Healthcare Inc.

            19.1.6.1. Overview

            19.1.6.2. Product Portfolio

            19.1.6.3. Profitability by Market Segments

            19.1.6.4. Sales Footprint

            19.1.6.5. Strategy Overview

                19.1.6.5.1. Marketing Strategy

        19.1.7. Koninklijke Philips N.V. (Royal Philips)

            19.1.7.1. Overview

            19.1.7.2. Product Portfolio

            19.1.7.3. Profitability by Market Segments

            19.1.7.4. Sales Footprint

            19.1.7.5. Strategy Overview

                19.1.7.5.1. Marketing Strategy

        19.1.8. IBM Corporation

            19.1.8.1. Overview

            19.1.8.2. Product Portfolio

            19.1.8.3. Profitability by Market Segments

            19.1.8.4. Sales Footprint

            19.1.8.5. Strategy Overview

                19.1.8.5.1. Marketing Strategy

        19.1.9. Agfa-Gevaert Group

            19.1.9.1. Overview

            19.1.9.2. Product Portfolio

            19.1.9.3. Profitability by Market Segments

            19.1.9.4. Sales Footprint

            19.1.9.5. Strategy Overview

                19.1.9.5.1. Marketing Strategy

        19.1.10. Wolters Kluwer N.V.

            19.1.10.1. Overview

            19.1.10.2. Product Portfolio

            19.1.10.3. Profitability by Market Segments

            19.1.10.4. Sales Footprint

            19.1.10.5. Strategy Overview

                19.1.10.5.1. Marketing Strategy

20. Assumptions & Acronyms Used

21. Research Methodology

List of Tables

Table 1: Global Market Value (US$ Mn) Forecast by Region, 2017-2032

Table 2: Global Market Value (US$ Mn) Forecast by Product, 2017-2032

Table 3: Global Market Value (US$ Mn) Forecast by Application , 2017-2032

Table 4: Global Market Value (US$ Mn) Forecast by Delivery Mode , 2017-2032

Table 5: Global Market Value (US$ Mn) Forecast by Component , 2017-2032

Table 6: North America Market Value (US$ Mn) Forecast by Country, 2017-2032

Table 7: North America Market Value (US$ Mn) Forecast by Product, 2017-2032

Table 8: North America Market Value (US$ Mn) Forecast by Application , 2017-2032

Table 9: North America Market Value (US$ Mn) Forecast by Delivery Mode , 2017-2032

Table 10: North America Market Value (US$ Mn) Forecast by Component , 2017-2032

Table 11: Latin America Market Value (US$ Mn) Forecast by Country, 2017-2032

Table 12: Latin America Market Value (US$ Mn) Forecast by Product, 2017-2032

Table 13: Latin America Market Value (US$ Mn) Forecast by Application , 2017-2032

Table 14: Latin America Market Value (US$ Mn) Forecast by Delivery Mode , 2017-2032

Table 15: Latin America Market Value (US$ Mn) Forecast by Component , 2017-2032

Table 16: Europe Market Value (US$ Mn) Forecast by Country, 2017-2032

Table 17: Europe Market Value (US$ Mn) Forecast by Product, 2017-2032

Table 18: Europe Market Value (US$ Mn) Forecast by Application , 2017-2032

Table 19: Europe Market Value (US$ Mn) Forecast by Delivery Mode , 2017-2032

Table 20: Europe Market Value (US$ Mn) Forecast by Component , 2017-2032

Table 21: South Asia Market Value (US$ Mn) Forecast by Country, 2017-2032

Table 22: South Asia Market Value (US$ Mn) Forecast by Product, 2017-2032

Table 23: South Asia Market Value (US$ Mn) Forecast by Application , 2017-2032

Table 24: South Asia Market Value (US$ Mn) Forecast by Delivery Mode , 2017-2032

Table 25: South Asia Market Value (US$ Mn) Forecast by Component , 2017-2032

Table 26: East Asia Market Value (US$ Mn) Forecast by Country, 2017-2032

Table 27: East Asia Market Value (US$ Mn) Forecast by Product, 2017-2032

Table 28: East Asia Market Value (US$ Mn) Forecast by Application , 2017-2032

Table 29: East Asia Market Value (US$ Mn) Forecast by Delivery Mode , 2017-2032

Table 30: East Asia Market Value (US$ Mn) Forecast by Component , 2017-2032

Table 31: Oceania Market Value (US$ Mn) Forecast by Country, 2017-2032

Table 32: Oceania Market Value (US$ Mn) Forecast by Product, 2017-2032

Table 33: Oceania Market Value (US$ Mn) Forecast by Application , 2017-2032

Table 34: Oceania Market Value (US$ Mn) Forecast by Delivery Mode , 2017-2032

Table 35: Oceania Market Value (US$ Mn) Forecast by Component , 2017-2032

Table 36: MEA Market Value (US$ Mn) Forecast by Country, 2017-2032

Table 37: MEA Market Value (US$ Mn) Forecast by Product, 2017-2032

Table 38: MEA Market Value (US$ Mn) Forecast by Application , 2017-2032

Table 39: MEA Market Value (US$ Mn) Forecast by Delivery Mode , 2017-2032

Table 40: MEA Market Value (US$ Mn) Forecast by Component , 2017-2032

List of Charts

Figure 1: Global Market Value (US$ Mn) by Product, 2022-2032

Figure 2: Global Market Value (US$ Mn) by Application , 2022-2032

Figure 3: Global Market Value (US$ Mn) by Delivery Mode , 2022-2032

Figure 4: Global Market Value (US$ Mn) by Component , 2022-2032

Figure 5: Global Market Value (US$ Mn) by Region, 2022-2032

Figure 6: Global Market Value (US$ Mn) Analysis by Region, 2017-2032

Figure 7: Global Market Value Share (%) and BPS Analysis by Region, 2022-2032

Figure 8: Global Market Y-o-Y Growth (%) Projections by Region, 2022-2032

Figure 9: Global Market Value (US$ Mn) Analysis by Product, 2017-2032

Figure 10: Global Market Value Share (%) and BPS Analysis by Product, 2022-2032

Figure 11: Global Market Y-o-Y Growth (%) Projections by Product, 2022-2032

Figure 12: Global Market Value (US$ Mn) Analysis by Application , 2017-2032

Figure 13: Global Market Value Share (%) and BPS Analysis by Application , 2022-2032

Figure 14: Global Market Y-o-Y Growth (%) Projections by Application , 2022-2032

Figure 15: Global Market Value (US$ Mn) Analysis by Delivery Mode , 2017-2032

Figure 16: Global Market Value Share (%) and BPS Analysis by Delivery Mode , 2022-2032

Figure 17: Global Market Y-o-Y Growth (%) Projections by Delivery Mode , 2022-2032

Figure 18: Global Market Value (US$ Mn) Analysis by Component , 2017-2032

Figure 19: Global Market Value Share (%) and BPS Analysis by Component , 2022-2032

Figure 20: Global Market Y-o-Y Growth (%) Projections by Component , 2022-2032

Figure 21: Global Market Attractiveness by Product, 2022-2032

Figure 22: Global Market Attractiveness by Application , 2022-2032

Figure 23: Global Market Attractiveness by Delivery Mode , 2022-2032

Figure 24: Global Market Attractiveness by Component , 2022-2032

Figure 25: Global Market Attractiveness by Region, 2022-2032

Figure 26: North America Market Value (US$ Mn) by Product, 2022-2032

Figure 27: North America Market Value (US$ Mn) by Application , 2022-2032

Figure 28: North America Market Value (US$ Mn) by Delivery Mode , 2022-2032

Figure 29: North America Market Value (US$ Mn) by Component , 2022-2032

Figure 30: North America Market Value (US$ Mn) by Country, 2022-2032

Figure 31: North America Market Value (US$ Mn) Analysis by Country, 2017-2032

Figure 32: North America Market Value Share (%) and BPS Analysis by Country, 2022-2032

Figure 33: North America Market Y-o-Y Growth (%) Projections by Country, 2022-2032

Figure 34: North America Market Value (US$ Mn) Analysis by Product, 2017-2032

Figure 35: North America Market Value Share (%) and BPS Analysis by Product, 2022-2032

Figure 36: North America Market Y-o-Y Growth (%) Projections by Product, 2022-2032

Figure 37: North America Market Value (US$ Mn) Analysis by Application , 2017-2032

Figure 38: North America Market Value Share (%) and BPS Analysis by Application , 2022-2032

Figure 39: North America Market Y-o-Y Growth (%) Projections by Application , 2022-2032

Figure 40: North America Market Value (US$ Mn) Analysis by Delivery Mode , 2017-2032

Figure 41: North America Market Value Share (%) and BPS Analysis by Delivery Mode , 2022-2032

Figure 42: North America Market Y-o-Y Growth (%) Projections by Delivery Mode , 2022-2032

Figure 43: North America Market Value (US$ Mn) Analysis by Component , 2017-2032

Figure 44: North America Market Value Share (%) and BPS Analysis by Component , 2022-2032

Figure 45: North America Market Y-o-Y Growth (%) Projections by Component , 2022-2032

Figure 46: North America Market Attractiveness by Product, 2022-2032

Figure 47: North America Market Attractiveness by Application , 2022-2032

Figure 48: North America Market Attractiveness by Delivery Mode , 2022-2032

Figure 49: North America Market Attractiveness by Component , 2022-2032

Figure 50: North America Market Attractiveness by Country, 2022-2032

Figure 51: Latin America Market Value (US$ Mn) by Product, 2022-2032

Figure 52: Latin America Market Value (US$ Mn) by Application , 2022-2032

Figure 53: Latin America Market Value (US$ Mn) by Delivery Mode , 2022-2032

Figure 54: Latin America Market Value (US$ Mn) by Component , 2022-2032

Figure 55: Latin America Market Value (US$ Mn) by Country, 2022-2032

Figure 56: Latin America Market Value (US$ Mn) Analysis by Country, 2017-2032

Figure 57: Latin America Market Value Share (%) and BPS Analysis by Country, 2022-2032

Figure 58: Latin America Market Y-o-Y Growth (%) Projections by Country, 2022-2032

Figure 59: Latin America Market Value (US$ Mn) Analysis by Product, 2017-2032

Figure 60: Latin America Market Value Share (%) and BPS Analysis by Product, 2022-2032

Figure 61: Latin America Market Y-o-Y Growth (%) Projections by Product, 2022-2032

Figure 62: Latin America Market Value (US$ Mn) Analysis by Application , 2017-2032

Figure 63: Latin America Market Value Share (%) and BPS Analysis by Application , 2022-2032

Figure 64: Latin America Market Y-o-Y Growth (%) Projections by Application , 2022-2032

Figure 65: Latin America Market Value (US$ Mn) Analysis by Delivery Mode , 2017-2032

Figure 66: Latin America Market Value Share (%) and BPS Analysis by Delivery Mode , 2022-2032

Figure 67: Latin America Market Y-o-Y Growth (%) Projections by Delivery Mode , 2022-2032

Figure 68: Latin America Market Value (US$ Mn) Analysis by Component , 2017-2032

Figure 69: Latin America Market Value Share (%) and BPS Analysis by Component , 2022-2032

Figure 70: Latin America Market Y-o-Y Growth (%) Projections by Component , 2022-2032

Figure 71: Latin America Market Attractiveness by Product, 2022-2032

Figure 72: Latin America Market Attractiveness by Application , 2022-2032

Figure 73: Latin America Market Attractiveness by Delivery Mode , 2022-2032

Figure 74: Latin America Market Attractiveness by Component , 2022-2032

Figure 75: Latin America Market Attractiveness by Country, 2022-2032

Figure 76: Europe Market Value (US$ Mn) by Product, 2022-2032

Figure 77: Europe Market Value (US$ Mn) by Application , 2022-2032

Figure 78: Europe Market Value (US$ Mn) by Delivery Mode , 2022-2032

Figure 79: Europe Market Value (US$ Mn) by Component , 2022-2032

Figure 80: Europe Market Value (US$ Mn) by Country, 2022-2032

Figure 81: Europe Market Value (US$ Mn) Analysis by Country, 2017-2032

Figure 82: Europe Market Value Share (%) and BPS Analysis by Country, 2022-2032

Figure 83: Europe Market Y-o-Y Growth (%) Projections by Country, 2022-2032

Figure 84: Europe Market Value (US$ Mn) Analysis by Product, 2017-2032

Figure 85: Europe Market Value Share (%) and BPS Analysis by Product, 2022-2032

Figure 86: Europe Market Y-o-Y Growth (%) Projections by Product, 2022-2032

Figure 87: Europe Market Value (US$ Mn) Analysis by Application , 2017-2032

Figure 88: Europe Market Value Share (%) and BPS Analysis by Application , 2022-2032

Figure 89: Europe Market Y-o-Y Growth (%) Projections by Application , 2022-2032

Figure 90: Europe Market Value (US$ Mn) Analysis by Delivery Mode , 2017-2032

Figure 91: Europe Market Value Share (%) and BPS Analysis by Delivery Mode , 2022-2032

Figure 92: Europe Market Y-o-Y Growth (%) Projections by Delivery Mode , 2022-2032

Figure 93: Europe Market Value (US$ Mn) Analysis by Component , 2017-2032

Figure 94: Europe Market Value Share (%) and BPS Analysis by Component , 2022-2032

Figure 95: Europe Market Y-o-Y Growth (%) Projections by Component , 2022-2032

Figure 96: Europe Market Attractiveness by Product, 2022-2032

Figure 97: Europe Market Attractiveness by Application , 2022-2032

Figure 98: Europe Market Attractiveness by Delivery Mode , 2022-2032

Figure 99: Europe Market Attractiveness by Component , 2022-2032

Figure 100: Europe Market Attractiveness by Country, 2022-2032

Figure 101: South Asia Market Value (US$ Mn) by Product, 2022-2032

Figure 102: South Asia Market Value (US$ Mn) by Application , 2022-2032

Figure 103: South Asia Market Value (US$ Mn) by Delivery Mode , 2022-2032

Figure 104: South Asia Market Value (US$ Mn) by Component , 2022-2032

Figure 105: South Asia Market Value (US$ Mn) by Country, 2022-2032

Figure 106: South Asia Market Value (US$ Mn) Analysis by Country, 2017-2032

Figure 107: South Asia Market Value Share (%) and BPS Analysis by Country, 2022-2032

Figure 108: South Asia Market Y-o-Y Growth (%) Projections by Country, 2022-2032

Figure 109: South Asia Market Value (US$ Mn) Analysis by Product, 2017-2032

Figure 110: South Asia Market Value Share (%) and BPS Analysis by Product, 2022-2032

Figure 111: South Asia Market Y-o-Y Growth (%) Projections by Product, 2022-2032

Figure 112: South Asia Market Value (US$ Mn) Analysis by Application , 2017-2032

Figure 113: South Asia Market Value Share (%) and BPS Analysis by Application , 2022-2032

Figure 114: South Asia Market Y-o-Y Growth (%) Projections by Application , 2022-2032

Figure 115: South Asia Market Value (US$ Mn) Analysis by Delivery Mode , 2017-2032

Figure 116: South Asia Market Value Share (%) and BPS Analysis by Delivery Mode , 2022-2032

Figure 117: South Asia Market Y-o-Y Growth (%) Projections by Delivery Mode , 2022-2032

Figure 118: South Asia Market Value (US$ Mn) Analysis by Component , 2017-2032

Figure 119: South Asia Market Value Share (%) and BPS Analysis by Component , 2022-2032

Figure 120: South Asia Market Y-o-Y Growth (%) Projections by Component , 2022-2032

Figure 121: South Asia Market Attractiveness by Product, 2022-2032

Figure 122: South Asia Market Attractiveness by Application , 2022-2032

Figure 123: South Asia Market Attractiveness by Delivery Mode , 2022-2032

Figure 124: South Asia Market Attractiveness by Component , 2022-2032

Figure 125: South Asia Market Attractiveness by Country, 2022-2032

Figure 126: East Asia Market Value (US$ Mn) by Product, 2022-2032

Figure 127: East Asia Market Value (US$ Mn) by Application , 2022-2032

Figure 128: East Asia Market Value (US$ Mn) by Delivery Mode , 2022-2032

Figure 129: East Asia Market Value (US$ Mn) by Component , 2022-2032

Figure 130: East Asia Market Value (US$ Mn) by Country, 2022-2032

Figure 131: East Asia Market Value (US$ Mn) Analysis by Country, 2017-2032

Figure 132: East Asia Market Value Share (%) and BPS Analysis by Country, 2022-2032

Figure 133: East Asia Market Y-o-Y Growth (%) Projections by Country, 2022-2032

Figure 134: East Asia Market Value (US$ Mn) Analysis by Product, 2017-2032

Figure 135: East Asia Market Value Share (%) and BPS Analysis by Product, 2022-2032

Figure 136: East Asia Market Y-o-Y Growth (%) Projections by Product, 2022-2032

Figure 137: East Asia Market Value (US$ Mn) Analysis by Application , 2017-2032

Figure 138: East Asia Market Value Share (%) and BPS Analysis by Application , 2022-2032

Figure 139: East Asia Market Y-o-Y Growth (%) Projections by Application , 2022-2032

Figure 140: East Asia Market Value (US$ Mn) Analysis by Delivery Mode , 2017-2032

Figure 141: East Asia Market Value Share (%) and BPS Analysis by Delivery Mode , 2022-2032

Figure 142: East Asia Market Y-o-Y Growth (%) Projections by Delivery Mode , 2022-2032

Figure 143: East Asia Market Value (US$ Mn) Analysis by Component , 2017-2032

Figure 144: East Asia Market Value Share (%) and BPS Analysis by Component , 2022-2032

Figure 145: East Asia Market Y-o-Y Growth (%) Projections by Component , 2022-2032

Figure 146: East Asia Market Attractiveness by Product, 2022-2032

Figure 147: East Asia Market Attractiveness by Application , 2022-2032

Figure 148: East Asia Market Attractiveness by Delivery Mode , 2022-2032

Figure 149: East Asia Market Attractiveness by Component , 2022-2032

Figure 150: East Asia Market Attractiveness by Country, 2022-2032

Figure 151: Oceania Market Value (US$ Mn) by Product, 2022-2032

Figure 152: Oceania Market Value (US$ Mn) by Application , 2022-2032

Figure 153: Oceania Market Value (US$ Mn) by Delivery Mode , 2022-2032

Figure 154: Oceania Market Value (US$ Mn) by Component , 2022-2032

Figure 155: Oceania Market Value (US$ Mn) by Country, 2022-2032

Figure 156: Oceania Market Value (US$ Mn) Analysis by Country, 2017-2032

Figure 157: Oceania Market Value Share (%) and BPS Analysis by Country, 2022-2032

Figure 158: Oceania Market Y-o-Y Growth (%) Projections by Country, 2022-2032

Figure 159: Oceania Market Value (US$ Mn) Analysis by Product, 2017-2032

Figure 160: Oceania Market Value Share (%) and BPS Analysis by Product, 2022-2032

Figure 161: Oceania Market Y-o-Y Growth (%) Projections by Product, 2022-2032

Figure 162: Oceania Market Value (US$ Mn) Analysis by Application , 2017-2032

Figure 163: Oceania Market Value Share (%) and BPS Analysis by Application , 2022-2032

Figure 164: Oceania Market Y-o-Y Growth (%) Projections by Application , 2022-2032

Figure 165: Oceania Market Value (US$ Mn) Analysis by Delivery Mode , 2017-2032

Figure 166: Oceania Market Value Share (%) and BPS Analysis by Delivery Mode , 2022-2032

Figure 167: Oceania Market Y-o-Y Growth (%) Projections by Delivery Mode , 2022-2032

Figure 168: Oceania Market Value (US$ Mn) Analysis by Component , 2017-2032

Figure 169: Oceania Market Value Share (%) and BPS Analysis by Component , 2022-2032

Figure 170: Oceania Market Y-o-Y Growth (%) Projections by Component , 2022-2032

Figure 171: Oceania Market Attractiveness by Product, 2022-2032

Figure 172: Oceania Market Attractiveness by Application , 2022-2032

Figure 173: Oceania Market Attractiveness by Delivery Mode , 2022-2032

Figure 174: Oceania Market Attractiveness by Component , 2022-2032

Figure 175: Oceania Market Attractiveness by Country, 2022-2032

Figure 176: MEA Market Value (US$ Mn) by Product, 2022-2032

Figure 177: MEA Market Value (US$ Mn) by Application , 2022-2032

Figure 178: MEA Market Value (US$ Mn) by Delivery Mode , 2022-2032

Figure 179: MEA Market Value (US$ Mn) by Component , 2022-2032

Figure 180: MEA Market Value (US$ Mn) by Country, 2022-2032

Figure 181: MEA Market Value (US$ Mn) Analysis by Country, 2017-2032

Figure 182: MEA Market Value Share (%) and BPS Analysis by Country, 2022-2032

Figure 183: MEA Market Y-o-Y Growth (%) Projections by Country, 2022-2032

Figure 184: MEA Market Value (US$ Mn) Analysis by Product, 2017-2032

Figure 185: MEA Market Value Share (%) and BPS Analysis by Product, 2022-2032

Figure 186: MEA Market Y-o-Y Growth (%) Projections by Product, 2022-2032

Figure 187: MEA Market Value (US$ Mn) Analysis by Application , 2017-2032

Figure 188: MEA Market Value Share (%) and BPS Analysis by Application , 2022-2032

Figure 189: MEA Market Y-o-Y Growth (%) Projections by Application , 2022-2032

Figure 190: MEA Market Value (US$ Mn) Analysis by Delivery Mode , 2017-2032

Figure 191: MEA Market Value Share (%) and BPS Analysis by Delivery Mode , 2022-2032

Figure 192: MEA Market Y-o-Y Growth (%) Projections by Delivery Mode , 2022-2032

Figure 193: MEA Market Value (US$ Mn) Analysis by Component , 2017-2032

Figure 194: MEA Market Value Share (%) and BPS Analysis by Component , 2022-2032

Figure 195: MEA Market Y-o-Y Growth (%) Projections by Component , 2022-2032

Figure 196: MEA Market Attractiveness by Product, 2022-2032

Figure 197: MEA Market Attractiveness by Application , 2022-2032

Figure 198: MEA Market Attractiveness by Delivery Mode , 2022-2032

Figure 199: MEA Market Attractiveness by Component , 2022-2032

Figure 200: MEA Market Attractiveness by Country, 2022-2032

Recommendations

Healthcare

AI-based Clinical Trials Solution Provider Market

Published : June 2022

Explore Healthcare Insights

View Reports

Clinical Decision Support Systems Market